0371
Quantitative Metabolite Mapping of the Human Brain at 9.4 T1MRZ, Max Planck Institute for Biological Cybernetics, Tuebingen, Germany, 2International Max Planck Research School, University of Tuebingen, Tuebingen, Germany, 3University of Tuebingen, Tuebingen, Germany, 4Advanced Imaging Research Center, University of Texas Southwestern Medical Center, Dallas, TX, United States
Synopsis
Quantitative metabolite maps are reported from in vivo results at 9.4T. These maps are produced by quantifying with an internal water reference and utilize a novel T1 correction method applied to each voxel individually. Quantitative results allow cross-vendor and cross-site comparisons of results which may help to understand and characterize a variety neurological diseases.
Introduction
High-resolution 1H MRSI of the human brain has been showcased previously from 9.4 T1, and displayed promise in detecting a more comprehensive neurochemical profile compared to results at lower field strengths2. MRSI adds valuable diagnostic information to understanding pathologies such as multiple sclerosis3, tumors4, epilepsy5 and neurodegenerative diseases6,7 due to detectable variations of the neurochemical profile. It has been shown that brain 1H MRSI at 7T brings additional information specifically with respect to the spatial inhomogeneity and spread of brain tumors or in multiple sclerosis where traditional anatomical imaging methods cannot visualize the extent of tissue abnormality beyond lesions3,8.However, to acquire high-resolution 1H MRSI data with sufficient coverage of the brain in a time efficient manner a very short TR of < 300 ms must be used which leads to heavy T1-weighting of metabolites9,10. In addition the sensitivity profile of the receive coil causes a substantial bias field in uncorrected metabolite maps. Thus, this work presents the implementation of an internal water referencing framework for 1H FID MRSI data of the human brain acquired at 9.4T that considers the tissue composition of each voxel for water content and water T1 relaxation corrections and performs additional T1 corrections for all metabolites. Furthermore, previously measured water and metabolite T1-relaxation times for human grey matter (GM) and white matter (WM) tissue at 9.4 T11,12 have been used to produce quantitative metabolite maps of the human brain .
Methods
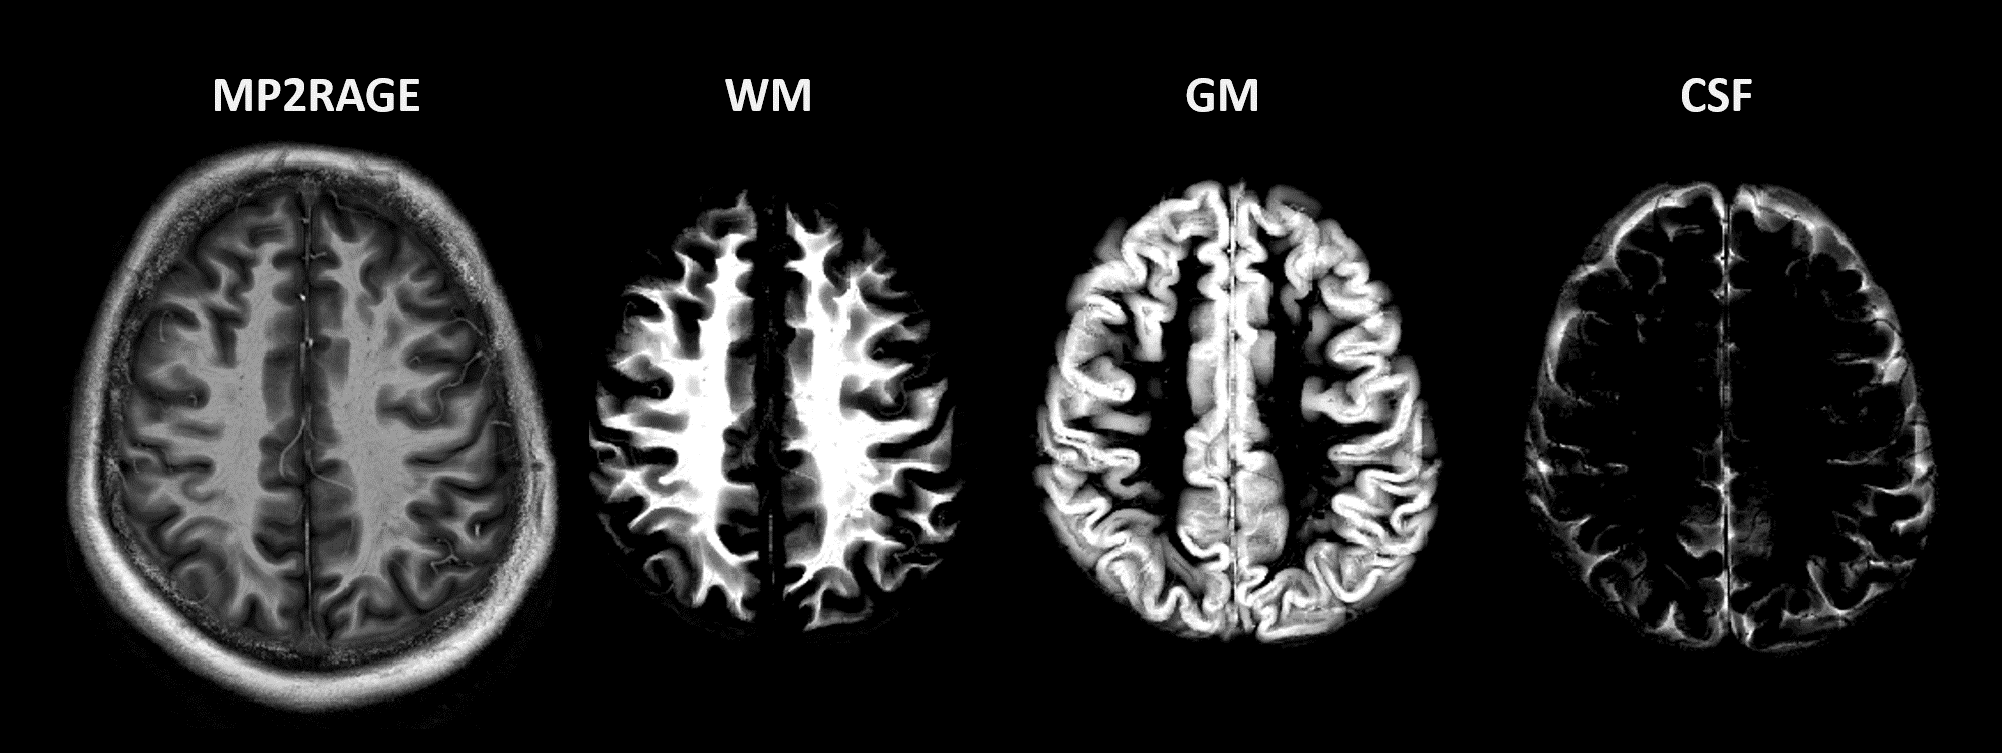
Three healthy volunteers participated in this study with IRB approval and signed consent. An 18/32 Tx/Rx coil13 was utilized to acquire elliptically shuttered high-resolution 1H FID-MRSI (TE* = 1.5ms, TR = 300ms) with a matrix size of 64x64 and FOV of 220 x 220 x 8 mm3 (nominal voxel size: 3.44 x 3.44 x 8 mm3), flip angle of 47$$$^{\circ}$$$, BW of 4000 Hz, and 512 data points acquired. To accompany metabolite data water references with identical sequence parameters were acquired. MRSI and water reference data were acquired from a slice positioned directly above the corpus callosum for each volunteer.MP2RAGE data was acquired (Fig. 1) and reconstructed as described in Hagberg et al.11. This data was segmented using SPM1214 into grey matter (GM), white matter (WM), and cerebrospinal fluid (CSF) components to account for the tissue contribution to each voxel in the 1H MRSI data. An in house tool was used to align the MP2RAGE and MRSI data by using a rigid body transformation, and then tissue type distribution maps were down-sampled to match the resolution of the MRSI data (Fig. 2). The tissue type composition was then extracted from each voxel.
MRSI data was preprocessed by performing eddy current correction and frequency alignment by centering the water peak, residual water was removed by using Hankel Lanczos SVD, and first order phase was corrected for using a Yule-walked method15 for back prediction of the FID. Spectral fitting was performed in LCModel (v-6.3)16 using a FID-sequence simulated basis set created using the GAMMA library (https://scion.duhs.duke.edu/vespa/gamma).
The T1-relaxation for each metabolite was corrected for each voxel from the MRSI acquisition considering its specific voxel composition by utilizing the tissue probability maps and GM and WM T1 relaxation time estimates for 9.4T reported in Wright, et al.12. T1-relaxation times for water in GM, WM, and CSF were taken from 9.4T human results from Hagberg, et al.11 . Quantification of metabolite maps using an internal water reference was performed by utilizing the method as described by Gasparovic et al.17; hence, concentrations are reported in mmolal.
Results
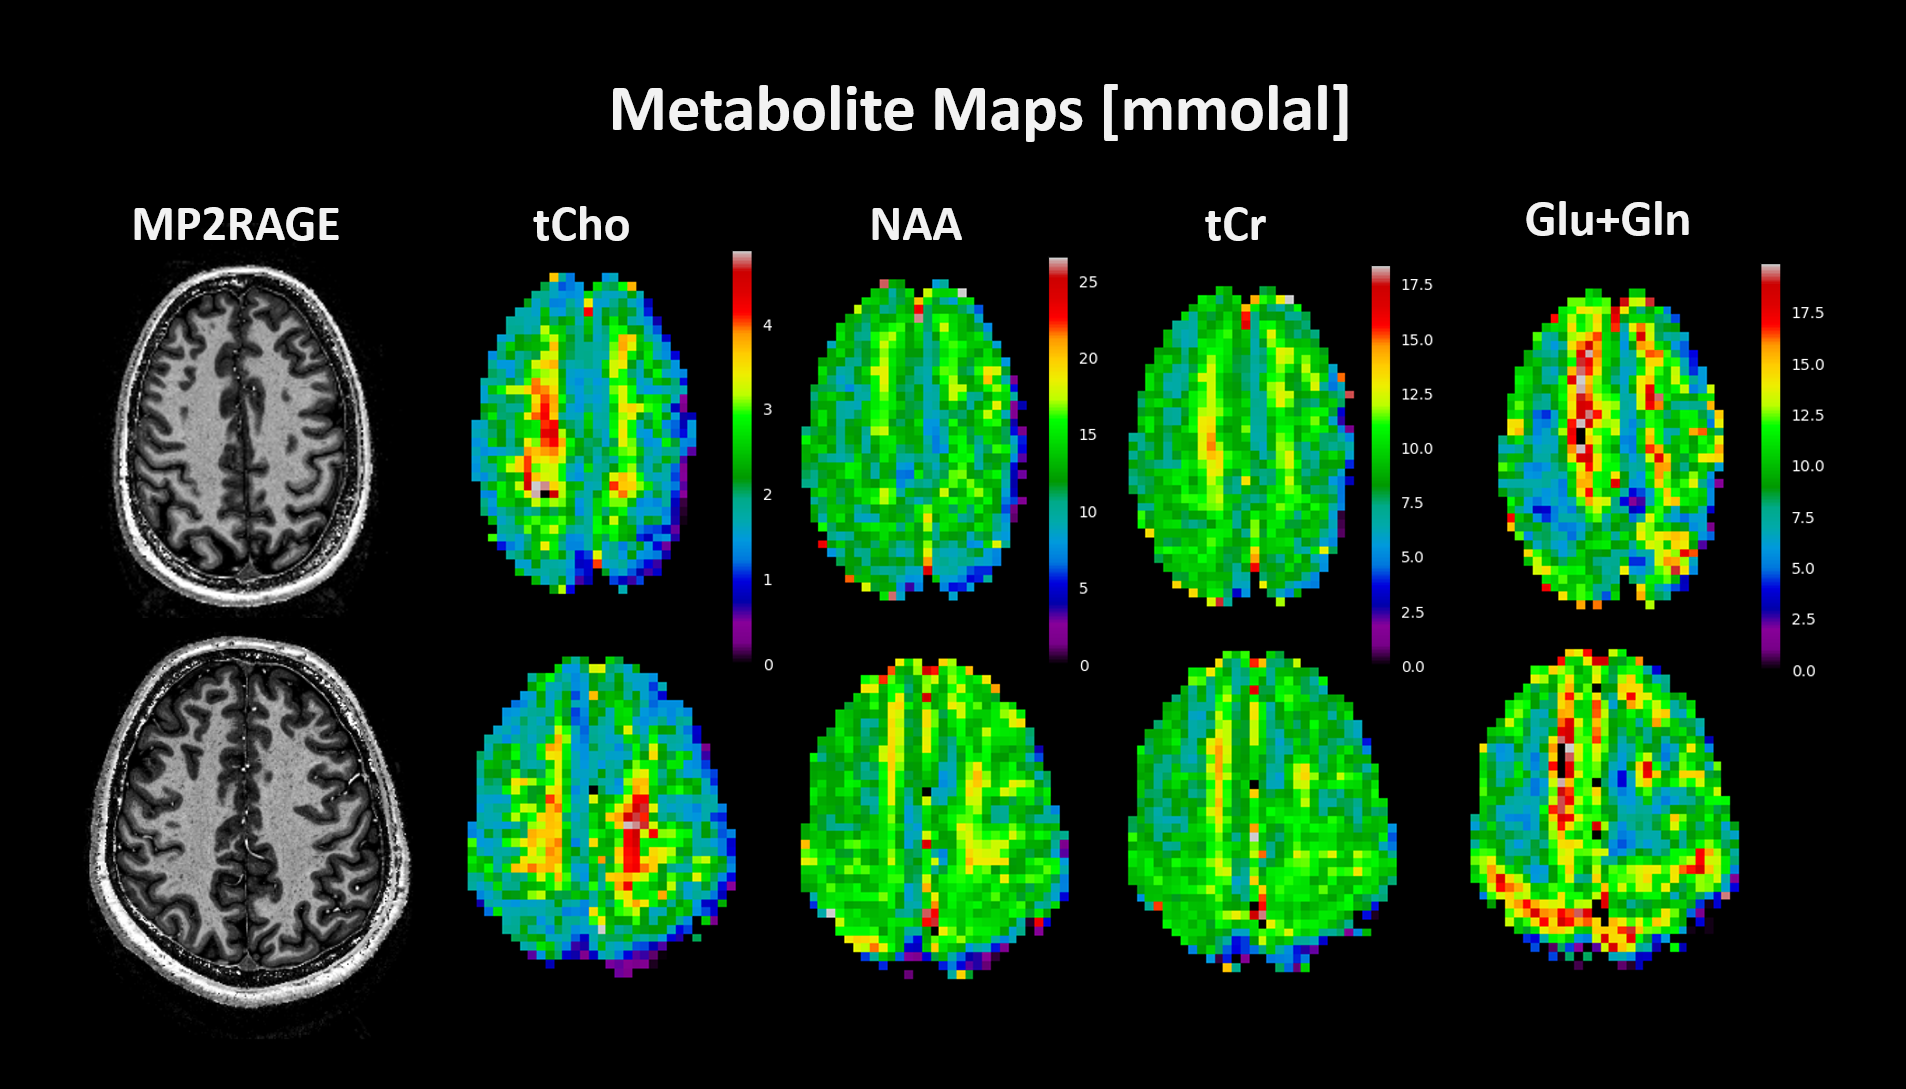
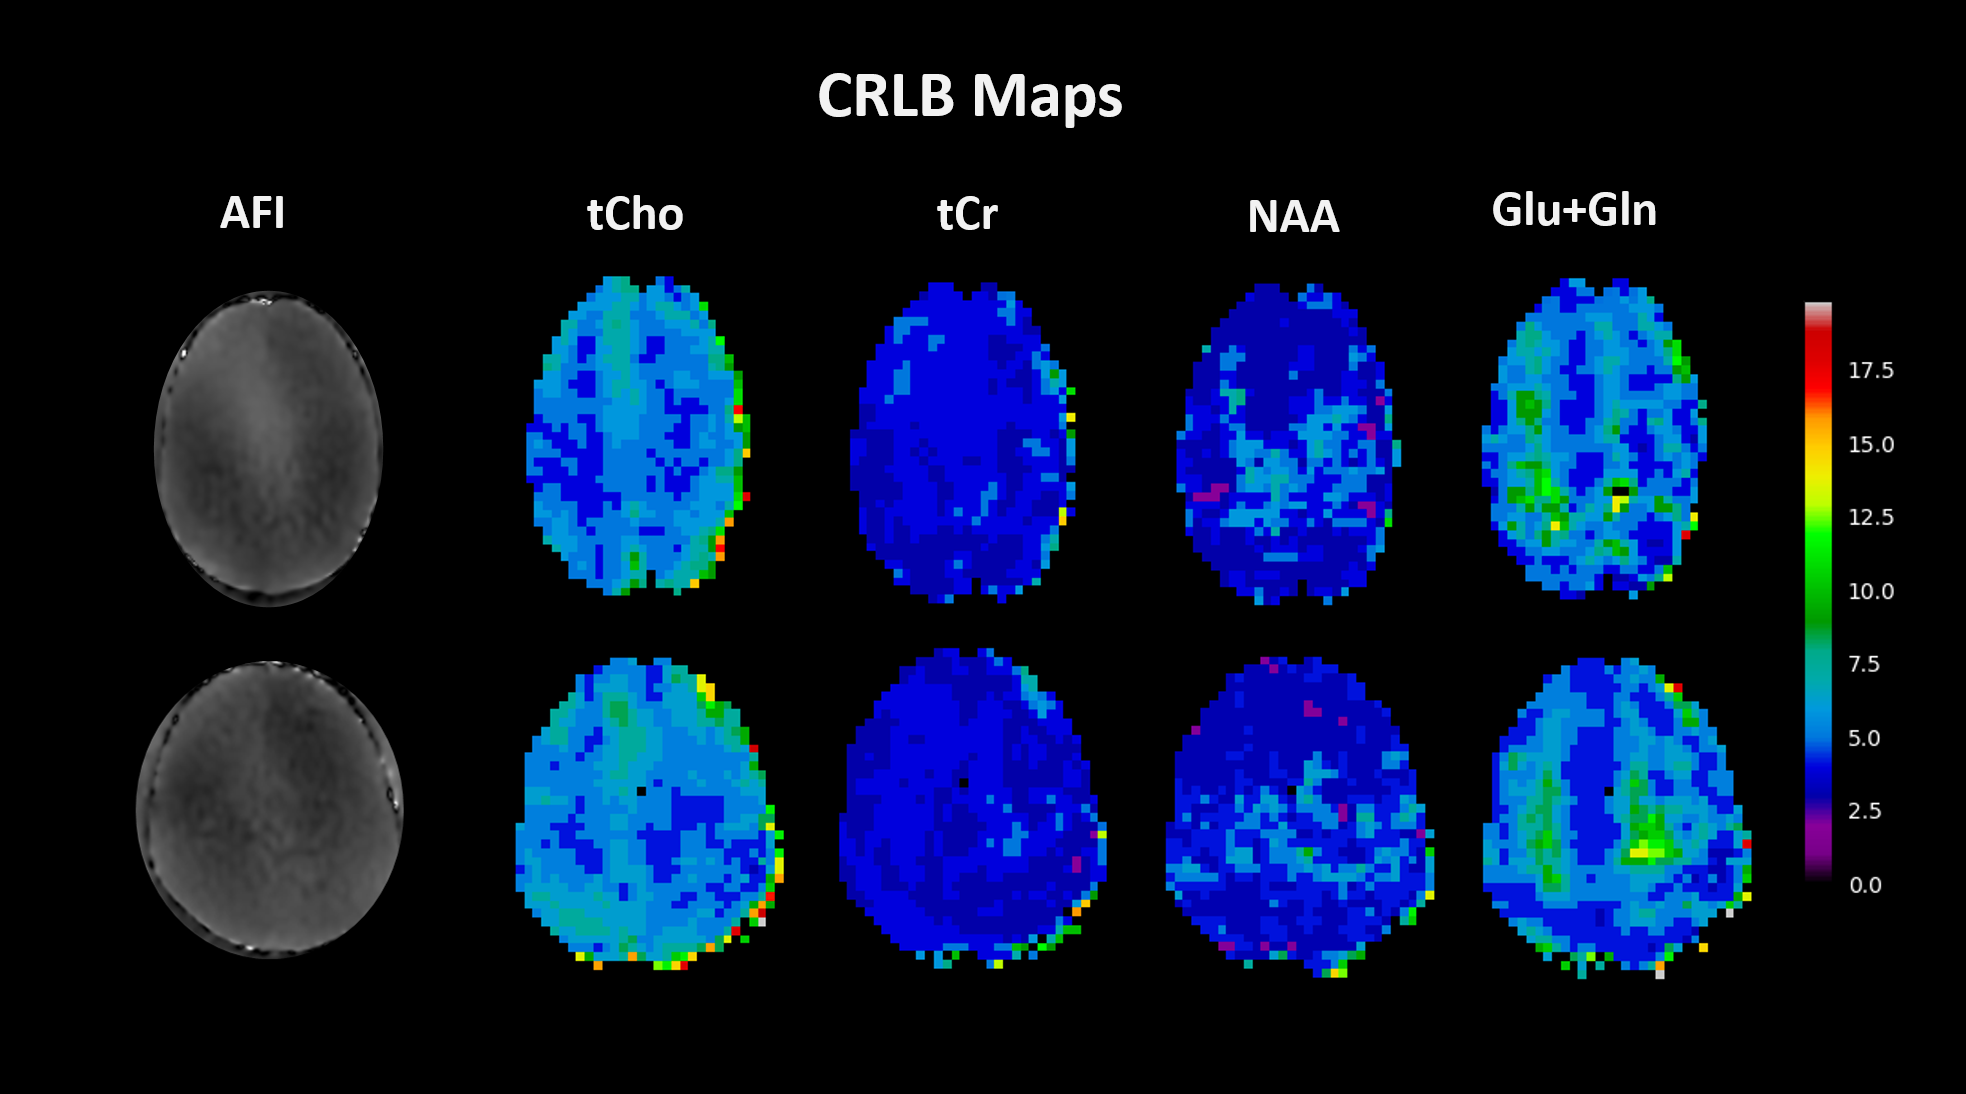
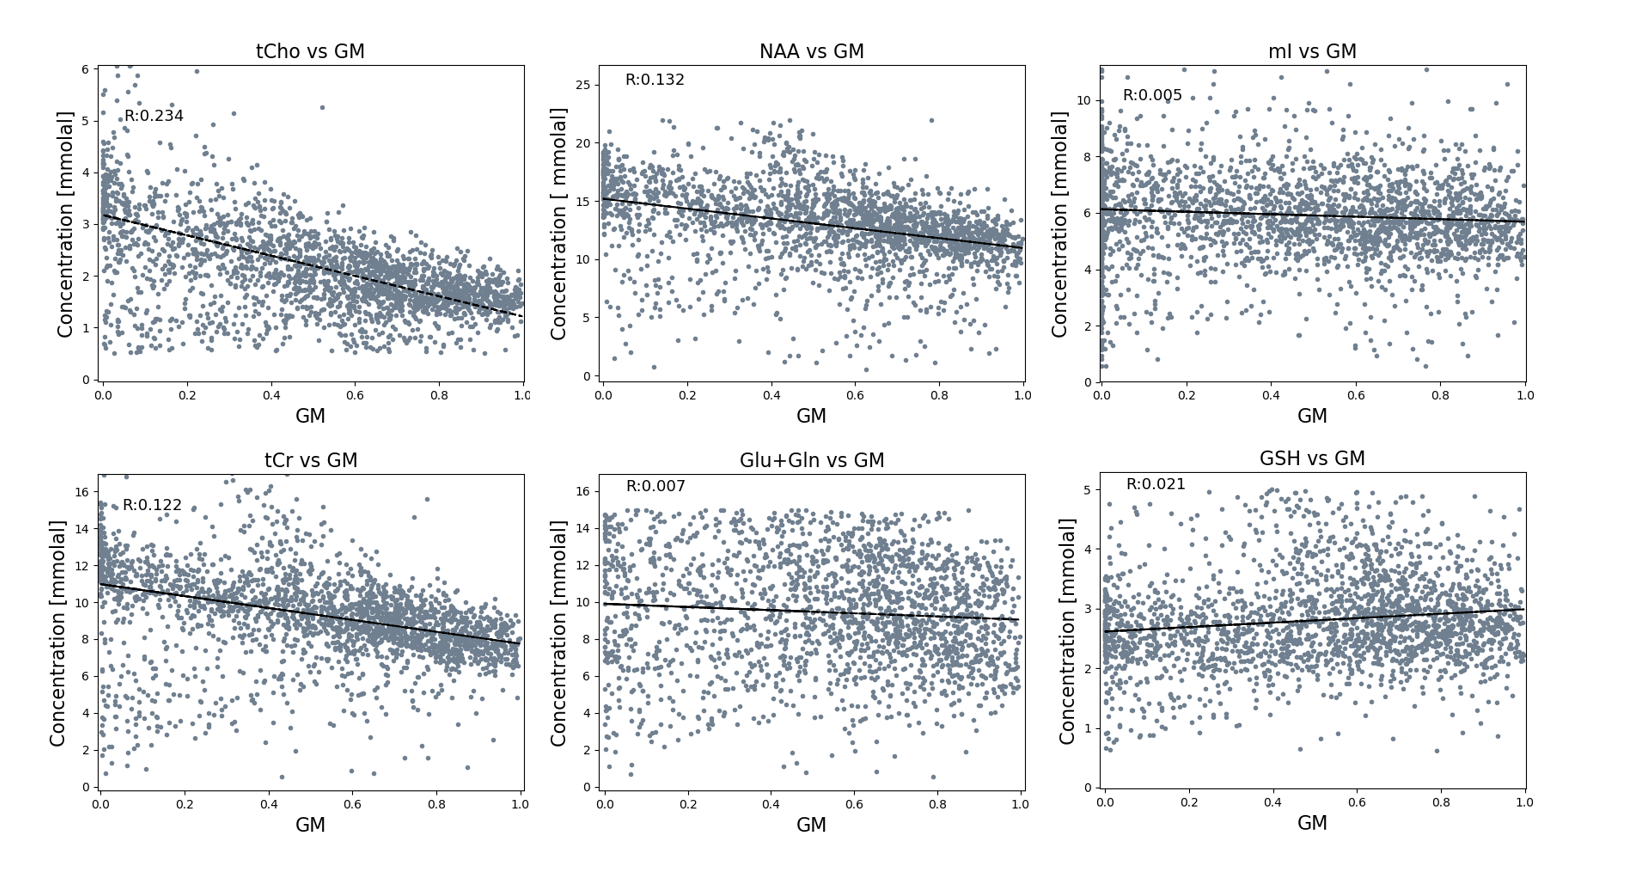
Figure 3 displays quantitative metabolite maps [mmolal] from two subjects, which agree with previously acquired results at ultra-high field for metabolite concentrations, and display tissue contrast for metabolites: tCho and Glu+Gln. As seen in Figure 4, the CRLB maps for the acquired data show a respectable range for tCho, tCr, NAA and Glu+Gln with a maximum value of 20.Linear regressions (Fig. 5) were performed for multiple metabolites; these results show metabolite concentrations as a function of GM fraction.
Discussion
When using a short TE* sequence macromolecules will obviously influence spectra. In this study the dkntmn parameter was set to 0.25 during fitting using LCModel to account for macromolecule influence. In the future, it would be advantageous to use tailored MM baselines either by simulation18 or as described by Považan, et al.19. Fitting macromolecules may also help to improve the variance seen in the Glu+Gln regression (Fig. 5).Quantitative results tend to align with metabolite concentrations that have previously been reported at lower field strengths20–23. However, slight streaking, likely due to hardware instability, makes it difficult to fully assess differences between GM and WM concentrations for all metabolites visible in spectra. This problem will be addressed before moving forward with the acquisition of high-resolution 1H MRSI data to derive whole brain quantitative metabolite maps.
Conclusion
Quantitative, fully T1 corrected in vivo metabolite maps are reported for the first time from 9.4 T. Improving upon high-resolution metabolite mapping is valuable in diagnostic imaging to aid in characterizing progressions of neurological diseases. Having quantitative readouts allows for comparisons between results across sites and vendors, which is valuable when assessing data for larger meta-analysis studies.Acknowledgements
The authors would like to gratefully acknowledge funding from the following sources: ERC Starting Grant, SYNAPLAST MR, (Grant Number: 679927), Horizon2020, CDS-QUAMRI, (Grant Number: 634541), and the Cancer Prevention and Research Institute of Texas (CPRIT) (Grant Number: RR180056)References
1. Nassirpour S, Chang P, Henning A. High and ultra-high resolution metabolite mapping of the human brain using 1H FID MRSI at 9.4T. Neuroimage. 2016;(July):1-11. doi:10.1016/j.neuroimage.2016.12.065
2. Motyka S, Moser P, Hingerl L, et al. The influence of spatial resolution on the spectral quality and quantification accuracy of whole‐brain MRSI at 1.5T, 3T, 7T, and 9.4T. Magn Reson Med. 2019;82(2):551-565. doi:10.1002/mrm.27746
3. Jain S, Sima DM, Sanaei Nezhad F, et al. Patch-Based Super-Resolution of MR Spectroscopic Images: Application to Multiple Sclerosis. Front Neurosci. 2017;11(January):1-12. doi:10.3389/fnins.2017.00013
4. Li Y, Larson P, Chen AP, et al. Short-echo three-dimensional H-1 MR spectroscopic imaging of patients with glioma at 7 tesla for characterization of differences in metabolite levels. J Magn Reson Imaging. 2015;41(5):1332-1341. doi:10.1002/jmri.24672
5. Gilliam FG, Maton BM, Martin RC, et al. Hippocampal 1H-MRSI correlates with severity of depression symptoms in temporal lobe epilepsy. Neurology. 2007;68(5):364-368. doi:10.1212/01.wnl.0000252813.86812.81
6. Schreiner SJ, Kirchner T, Wyss M, et al. Low episodic memory performance in cognitively normal elderly subjects is associated with increased posterior cingulate gray matter N-acetylaspartate: a 1H MRSI study at 7 Tesla. Neurobiol Aging. 2016;48:195-203. doi:10.1016/J.NEUROBIOLAGING.2016.08.022
7. Schreiner SJ, Kirchner T, Narkhede A, et al. Brain amyloid burden and cerebrovascular disease are synergistically associated with neurometabolism in cognitively unimpaired older adults. Neurobiol Aging. 2018;63:152-161. doi:10.1016/J.NEUROBIOLAGING.2017.12.004
8. Henning A. Proton and multinuclear magnetic resonance spectroscopy in the human brain at ultra-high field strength: A review. Neuroimage. 2018;168:181-198. doi:10.1016/J.NEUROIMAGE.2017.07.017
9. Nassirpour S, Chang P, Henning A. High and ultra-high resolution metabolite mapping of the human brain using 1H FID MRSI at 9.4T. Neuroimage. 2016;(July):1-11. doi:10.1016/j.neuroimage.2016.12.065
10. Bogner W, Gruber S, Trattnig S, Chmelik M. High-resolution mapping of human brain metabolites by free induction decay 1 H MRSI at 7 T. 2012;(May 2011):873-882. doi:10.1002/nbm.1805
11. Hagberg GE, Bause J, Ethofer T, et al. Whole brain MP2RAGE-based mapping of the longitudinal relaxation time at 9.4T. Neuroimage. 2017;144:203-216. doi:10.1016/j.neuroimage.2016.09.047
12. Wright A, Murali-Manohar S, Borbath T, Henning A. Longitudinal Relaxation Times of Metabolites in vivo at 9.4T. In: 27th Annu Meet Exhib Int Soc Magn Reson Med (ISMRM 2019). Montréal, QC, Canada; 2019.
13. Avdievich NI, Giapitzakis I-A, Bause J, Shajan G, Scheffler K, Henning A. Double-row 18-loop transceive-32-loop receive tight-fit array provides for whole-brain coverage, high transmit performance, and SNR improvement near the brain center at 9.4T. Magn Reson Med. 2019;81(5):3392-3405. doi:10.1002/mrm.27602
14. Ashburner J, Barnes G, Chen C, et al. SPM12 Manual. Wellcome Trust Centre for Neuroimaging, London, UK; 2014.
15. Kallas M, Honeine P, Richard C, Francis C, Amoud H. Prediction of time series using Yule-Walker equations with kernels. In: 2012 IEEE International Conference on Acoustics, Speech and Signal Processing (ICASSP). IEEE; 2012:2185-2188. doi:10.1109/ICASSP.2012.6288346
16. Provencher SW. Automatic quantitation of localizedin vivo1H spectra with LCModel. NMR Biomed. 2001;14(4):260-264. doi:10.1002/nbm.698
17. Gasparovic C, Song T, Devier D, et al. Use of tissue water as a concentration reference for proton spectroscopic imaging. Magn Reson Med. 2006;55(6):1219-1226. doi:10.1002/mrm.20901
18. Wright A, Murali-Manohar S, Henning A. Relaxation corrected and Sequence-dependent Macromolecule Baseline Model. In: 27th Annu Meet Exhib Int Soc Magn Reson Med (ISMRM 2019). Montréal, QC, Canada; 2019.
19. Považan M, Strasser B, Hangel G, et al. Simultaneous mapping of metabolites and individual macromolecular components via ultra-short acquisition delay 1 H MRSI in the brain at 7T. Magn Reson Med. 2017;00:1-10. doi:10.1002/mrm.26778
20. Marjańska M, Auerbach EJ, Valabrègue R, Van de Moortele P-F, Adriany G, Garwood M. Localized 1H NMR spectroscopy in different regions of human brain in vivo at 7 T: T2 relaxation times and concentrations of cerebral metabolites. NMR Biomed. 2012;25(2):332-339. doi:10.1002/nbm.1754
21. Mekle R, Mlynárik V, Gambarota G, Hergt M, Krueger G, Gruetter R. MR spectroscopy of the human brain with enhanced signal intensity at ultrashort echo times on a clinical platform at 3T and 7T. Magn Reson Med. 2009;61(6):1279-1285. doi:10.1002/mrm.21961
22. Mangia S, Tkáč I, Gruetter R, et al. Sensitivity of single-voxel 1H-MRS in investigating the metabolism of the activated human visual cortex at 7 T. Magn Reson Imaging. 2006;24(4):343-348. doi:10.1016/J.MRI.2005.12.023
23. Terpstra M, Ugurbil K, Tkac I. Noninvasive quantification of human brain ascorbate concentration using 1 H NMR spectroscopy at 7 T. NMR Biomed. 2009;23(3):n/a-n/a. doi:10.1002/nbm.1423
Figures