0370
Whole-brain MR Spectroscopic Imaging with stack of Spirals Out-In k-space Trajectory at 7T1Athinoula A. Martinos Center for Biomedical Imaging, Department of Radiology, Massachusetts General Hospital, Boston, MA, United States, 2Department of Diagnostic Imaging, Akershus University Hospital, Lørenskog, Norway, 3High-field MR Center, Department of Biomedical Imaging and Image-guided Therapy, Medical University of Vienna, Vienna, Austria, 4Siemens Medical Solutions, Charlestown, MA, United States
Synopsis
Metabolic imaging using magnetic resonance spectroscopic imaging (MRSI) provides important biomarkers for brain neurochemistry. We developed a spiral-out-in (SOI) trajectory for human whole-brain MRSI at 7T to take advantage of increased sensitivity and spectral separation at ultra-high field. We hypothesized that spectral-spatial SOI sampling will provide higher signal-to-noise ratio(SNR) compared to spiral-out (SO) sampling by increasing the efficiency of data collection. We acquired data from phantom and six healthy volunteers. Metabolic maps, SNR, Cramér-Rao-Lower-Bounds (CRLB) were evaluated between SO and SOI acquisitions. By more efficient data points collection per repetition time, SOI provided a significant improvement in SNR and CRLB.
Proton (1H) magnetic resonance spectroscopic imaging (MRSI) detects spatial distribution of brain metabolism non-invasively and ultra-high field (≥7T) provides increased spectral sensitivity and dispersion. Fast MRSI differ in k-space sampling strategy, aiming to maximize the acquisition of data points per excitation. Spiral trajectories have been used successfully in brain MRSI (1-3) along with other non-cartesian trajectories (4,5). At 7T the acquisition efficiency of spiral-out is about 70%, including almost 40-50% of the gradient rewinder points to rewind the trajectory to the k-space origin. In this study, we extend the spiral-out (SO) to a new spiral-out-in (SOI) trajectory (also called PinWheel), aiming to acquire maximum k-space data points by minimizing the rewinders.
METHODS
Data were acquired with a 7T Magnetom scanner (Siemens Healthcare, Erlangen, Germany) running VB17A IDEA software. A custom-built 32-channel phased-array head coil was used for imaging.
An axial brain slab was selected with an adiabatic spin-echo sequence (ASE) described in (2). ASE was obtained with an excitation hyperbolic secant adiabatic half passage pulse (HS8 modulation; duration = 4 ms; bandwidth = 5 kHz; B1,max = 0.65 kHz) and a pair of gradient offset independent adiabatic refocusing pulses (W16,4 modulation; duration = 5 ms; bandwidth= 20 kHz; B1,max = 0.7 kHz (6)). Acceleration was obtained by the simultaneous spatial-spectral encoding of (kx, ky, t) space using either constant-density SO or SOI spectral-spatial readouts. Phase-encoding was employed in the z-dimension, resulting in 3D stack-of-spirals. Prospective, real-time motion correction and shim updates were performed during the MRSI acquisition (7,8).
The following parameters were used for acquiring ASE MRSI: TR = 1800 ms; TE = 78 ms; FOV of 220×220×80 mm; matrix of 44×44×8; one average; and acquisition time = 10:12 min:s. Lipids were suppressed with an asymmetric adiabatic inversion recovery using an HGSB pulse of 30 ms and an inversion time of 270 ms (2,9). ASE consisted of a 60 mm thick axial slab that contained six consecutive MRSI slices in the supra-tentorial brain. For all MRSI acquisitions, the SAR (specific absorption rate) was between 50%–85% of the maximum SAR limit as monitored by the MRI system.
In addition to metabolite data, water unsuppressed data (matrix of 22×22×8; acquisition time = 4:19 min:s) were acquired for coil combination and phasing of metabolite spectra. The raw MRSI data were reconstructed and analyzed with an in-house processing package using Matlab R2018b (MathWorks, Natick, MA, USA), Bash V4.2.25 (Free Software Foundation, Boston, MA, USA), MINC tools V2.0 (McConnell Brain Imaging Center, Montreal, QC, Canada), and spectral fitting by LCModel V6.3 (LCMODEL Inc, Oakville, Ontario, Canada, (9)). Non-cartesian data were reconstructed with a discrete Fourier transform, B0 corrected with the acquired B0 map (10), followed by removal of residual lipid signal with L1 penalty (11), and spatial Hamming filtering.
MR spectra were fitted with LCModel between 1.8 and 4.2 ppm, with a basis-set of 17 brain metabolites. Linewidths less than 0.1 ppm and Cramer-Rao lower bounds (CRLB) less than 20 % was determined for the goodness of fit of the metabolites peaks.
RESULTS
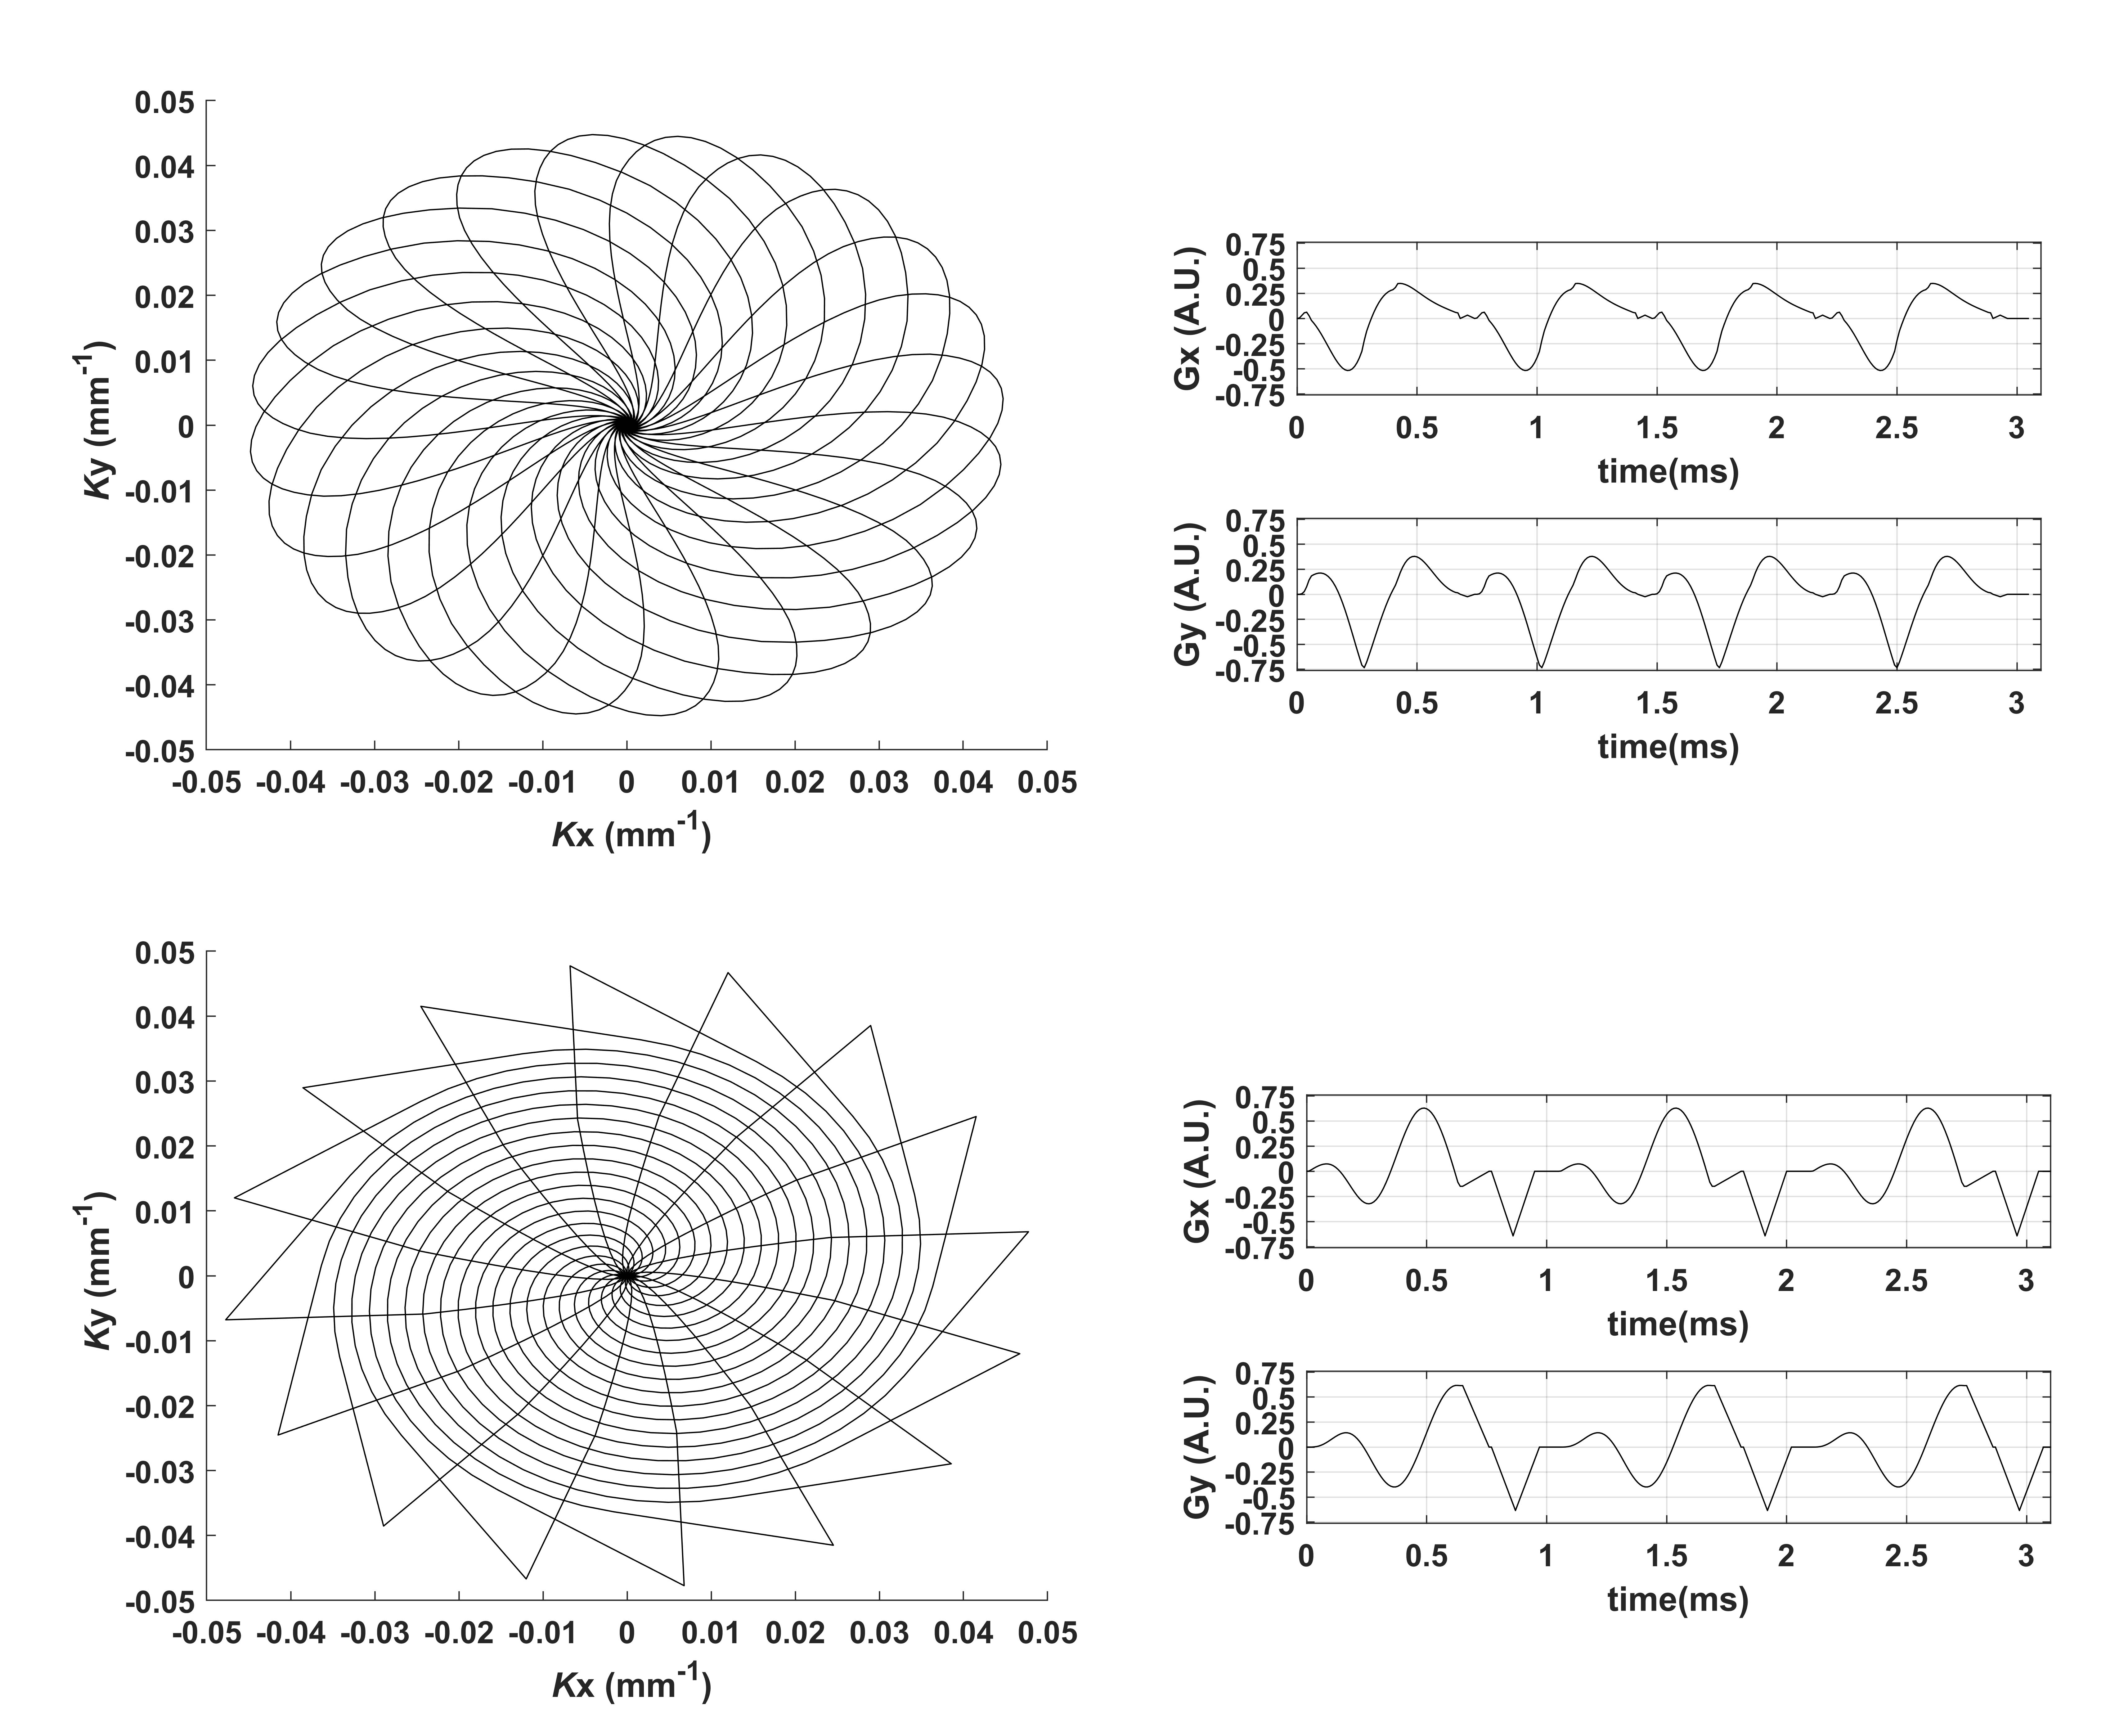
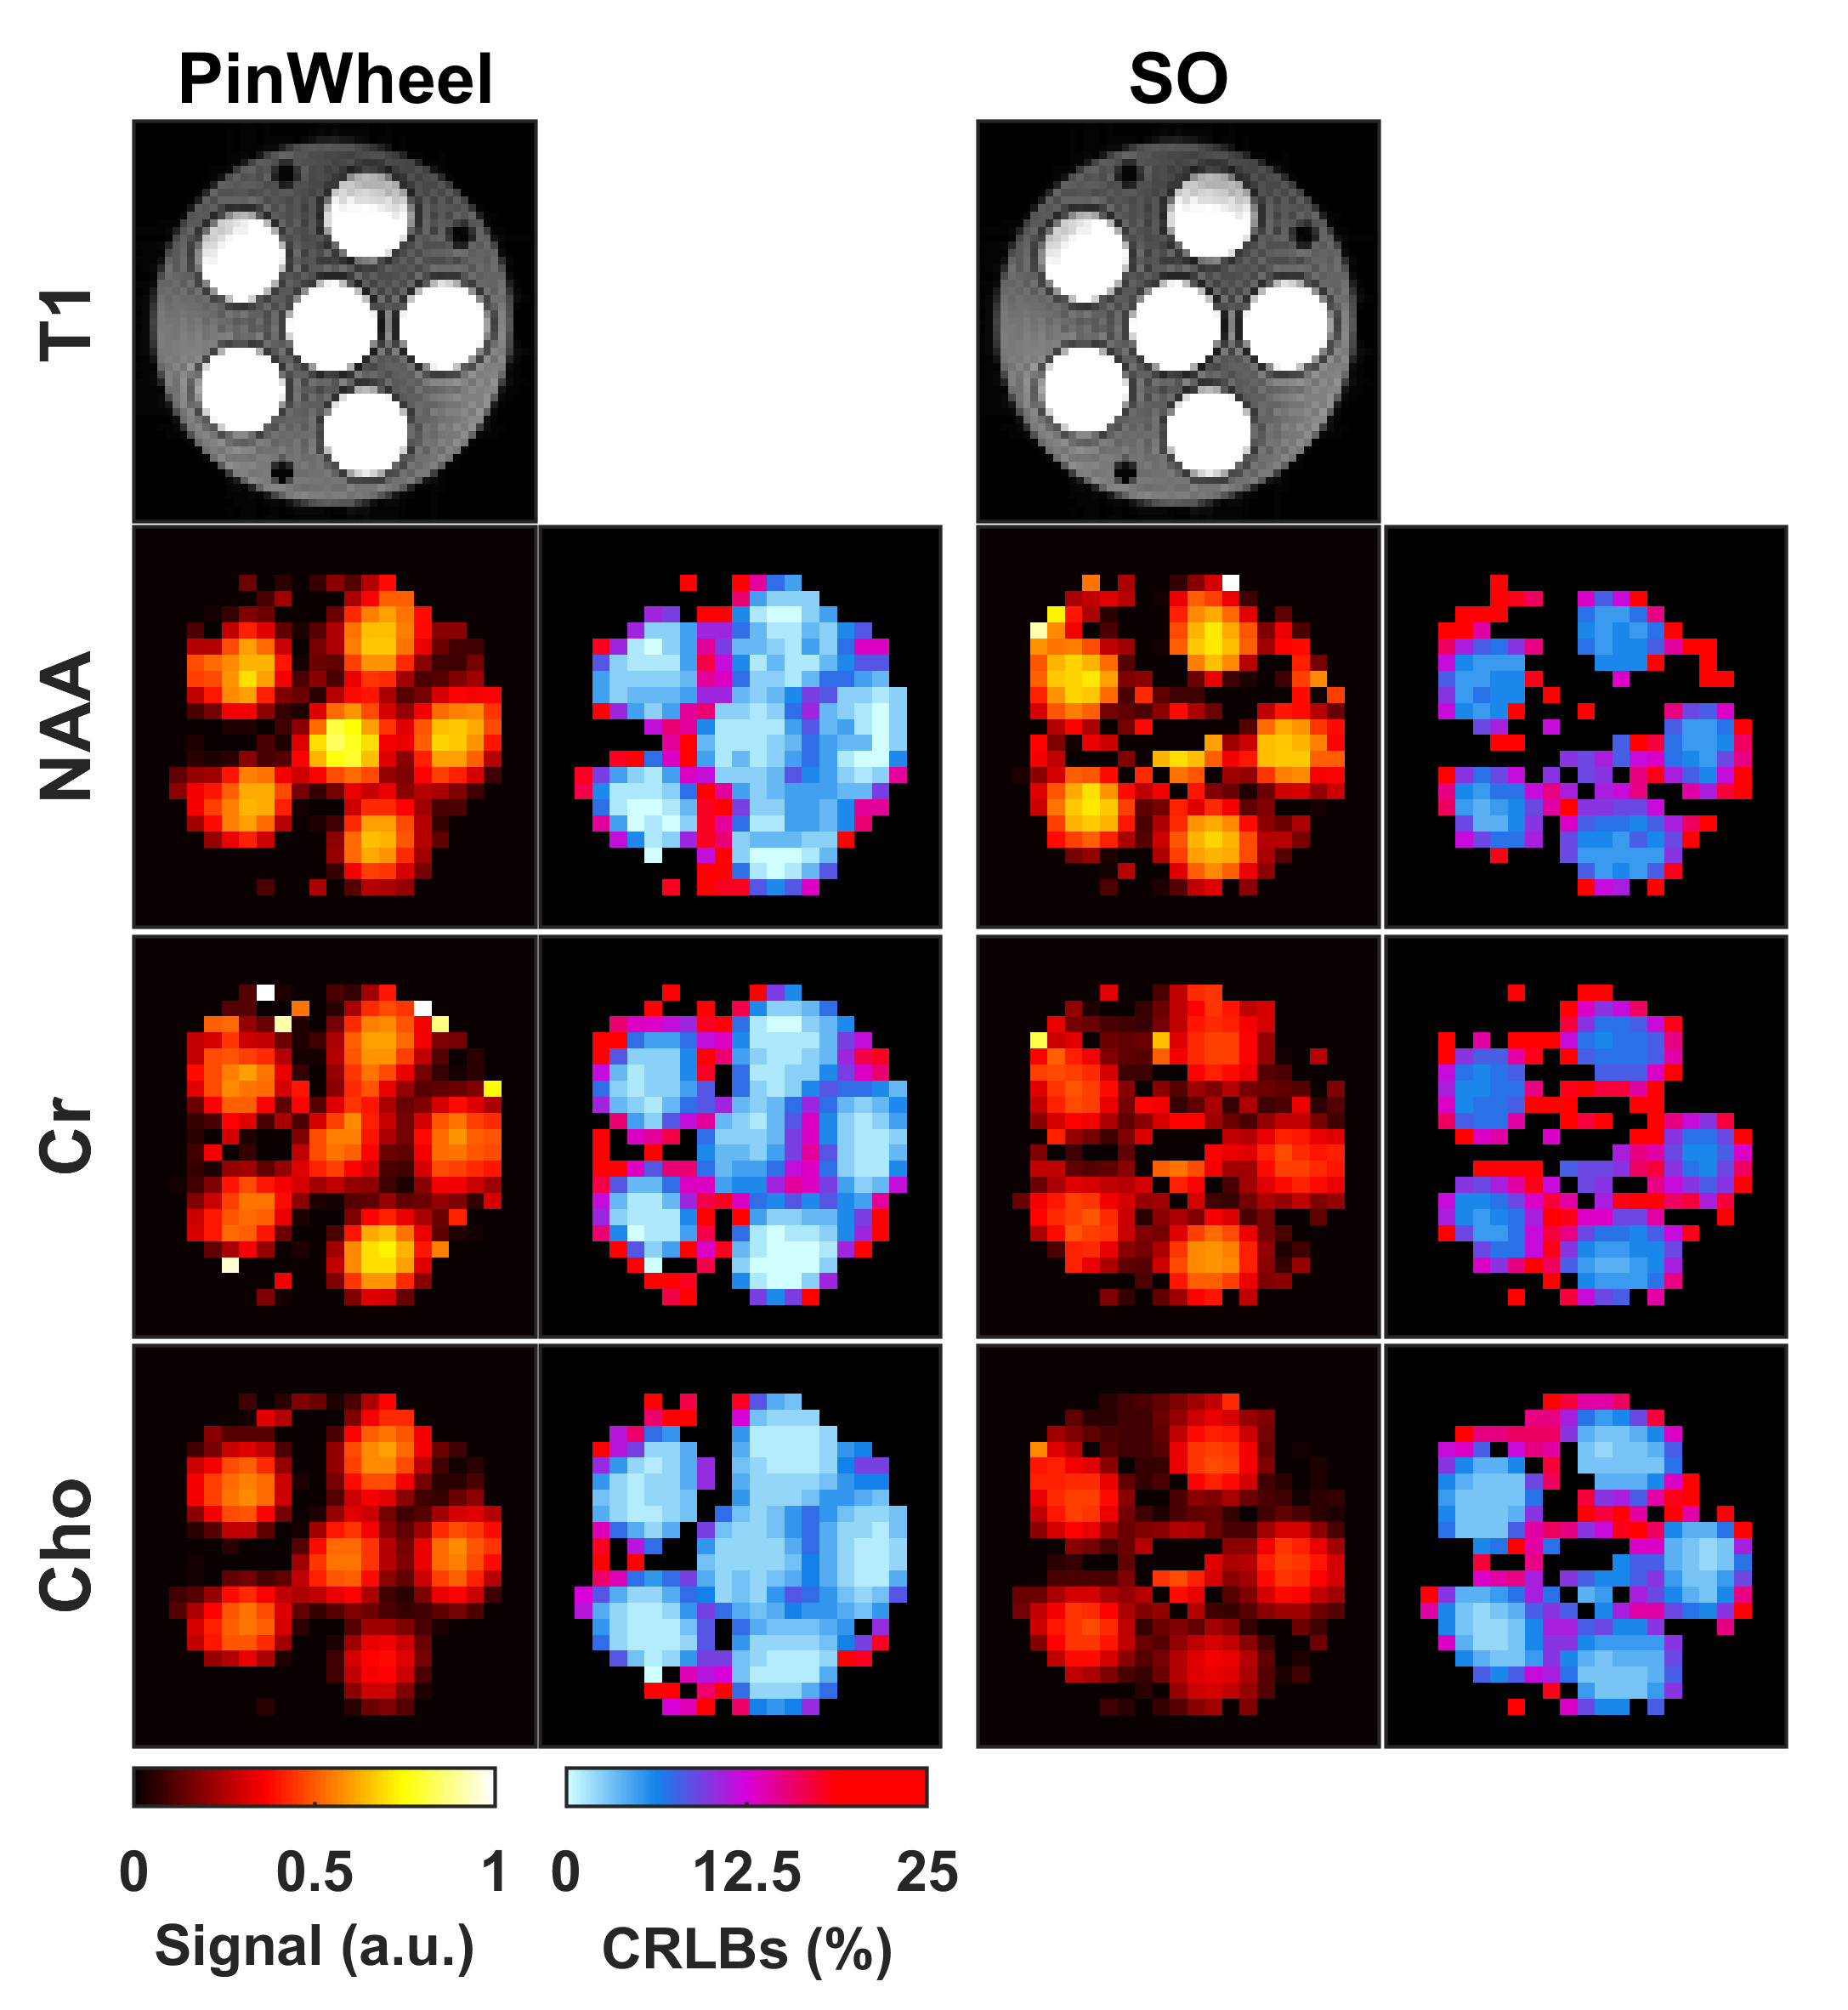
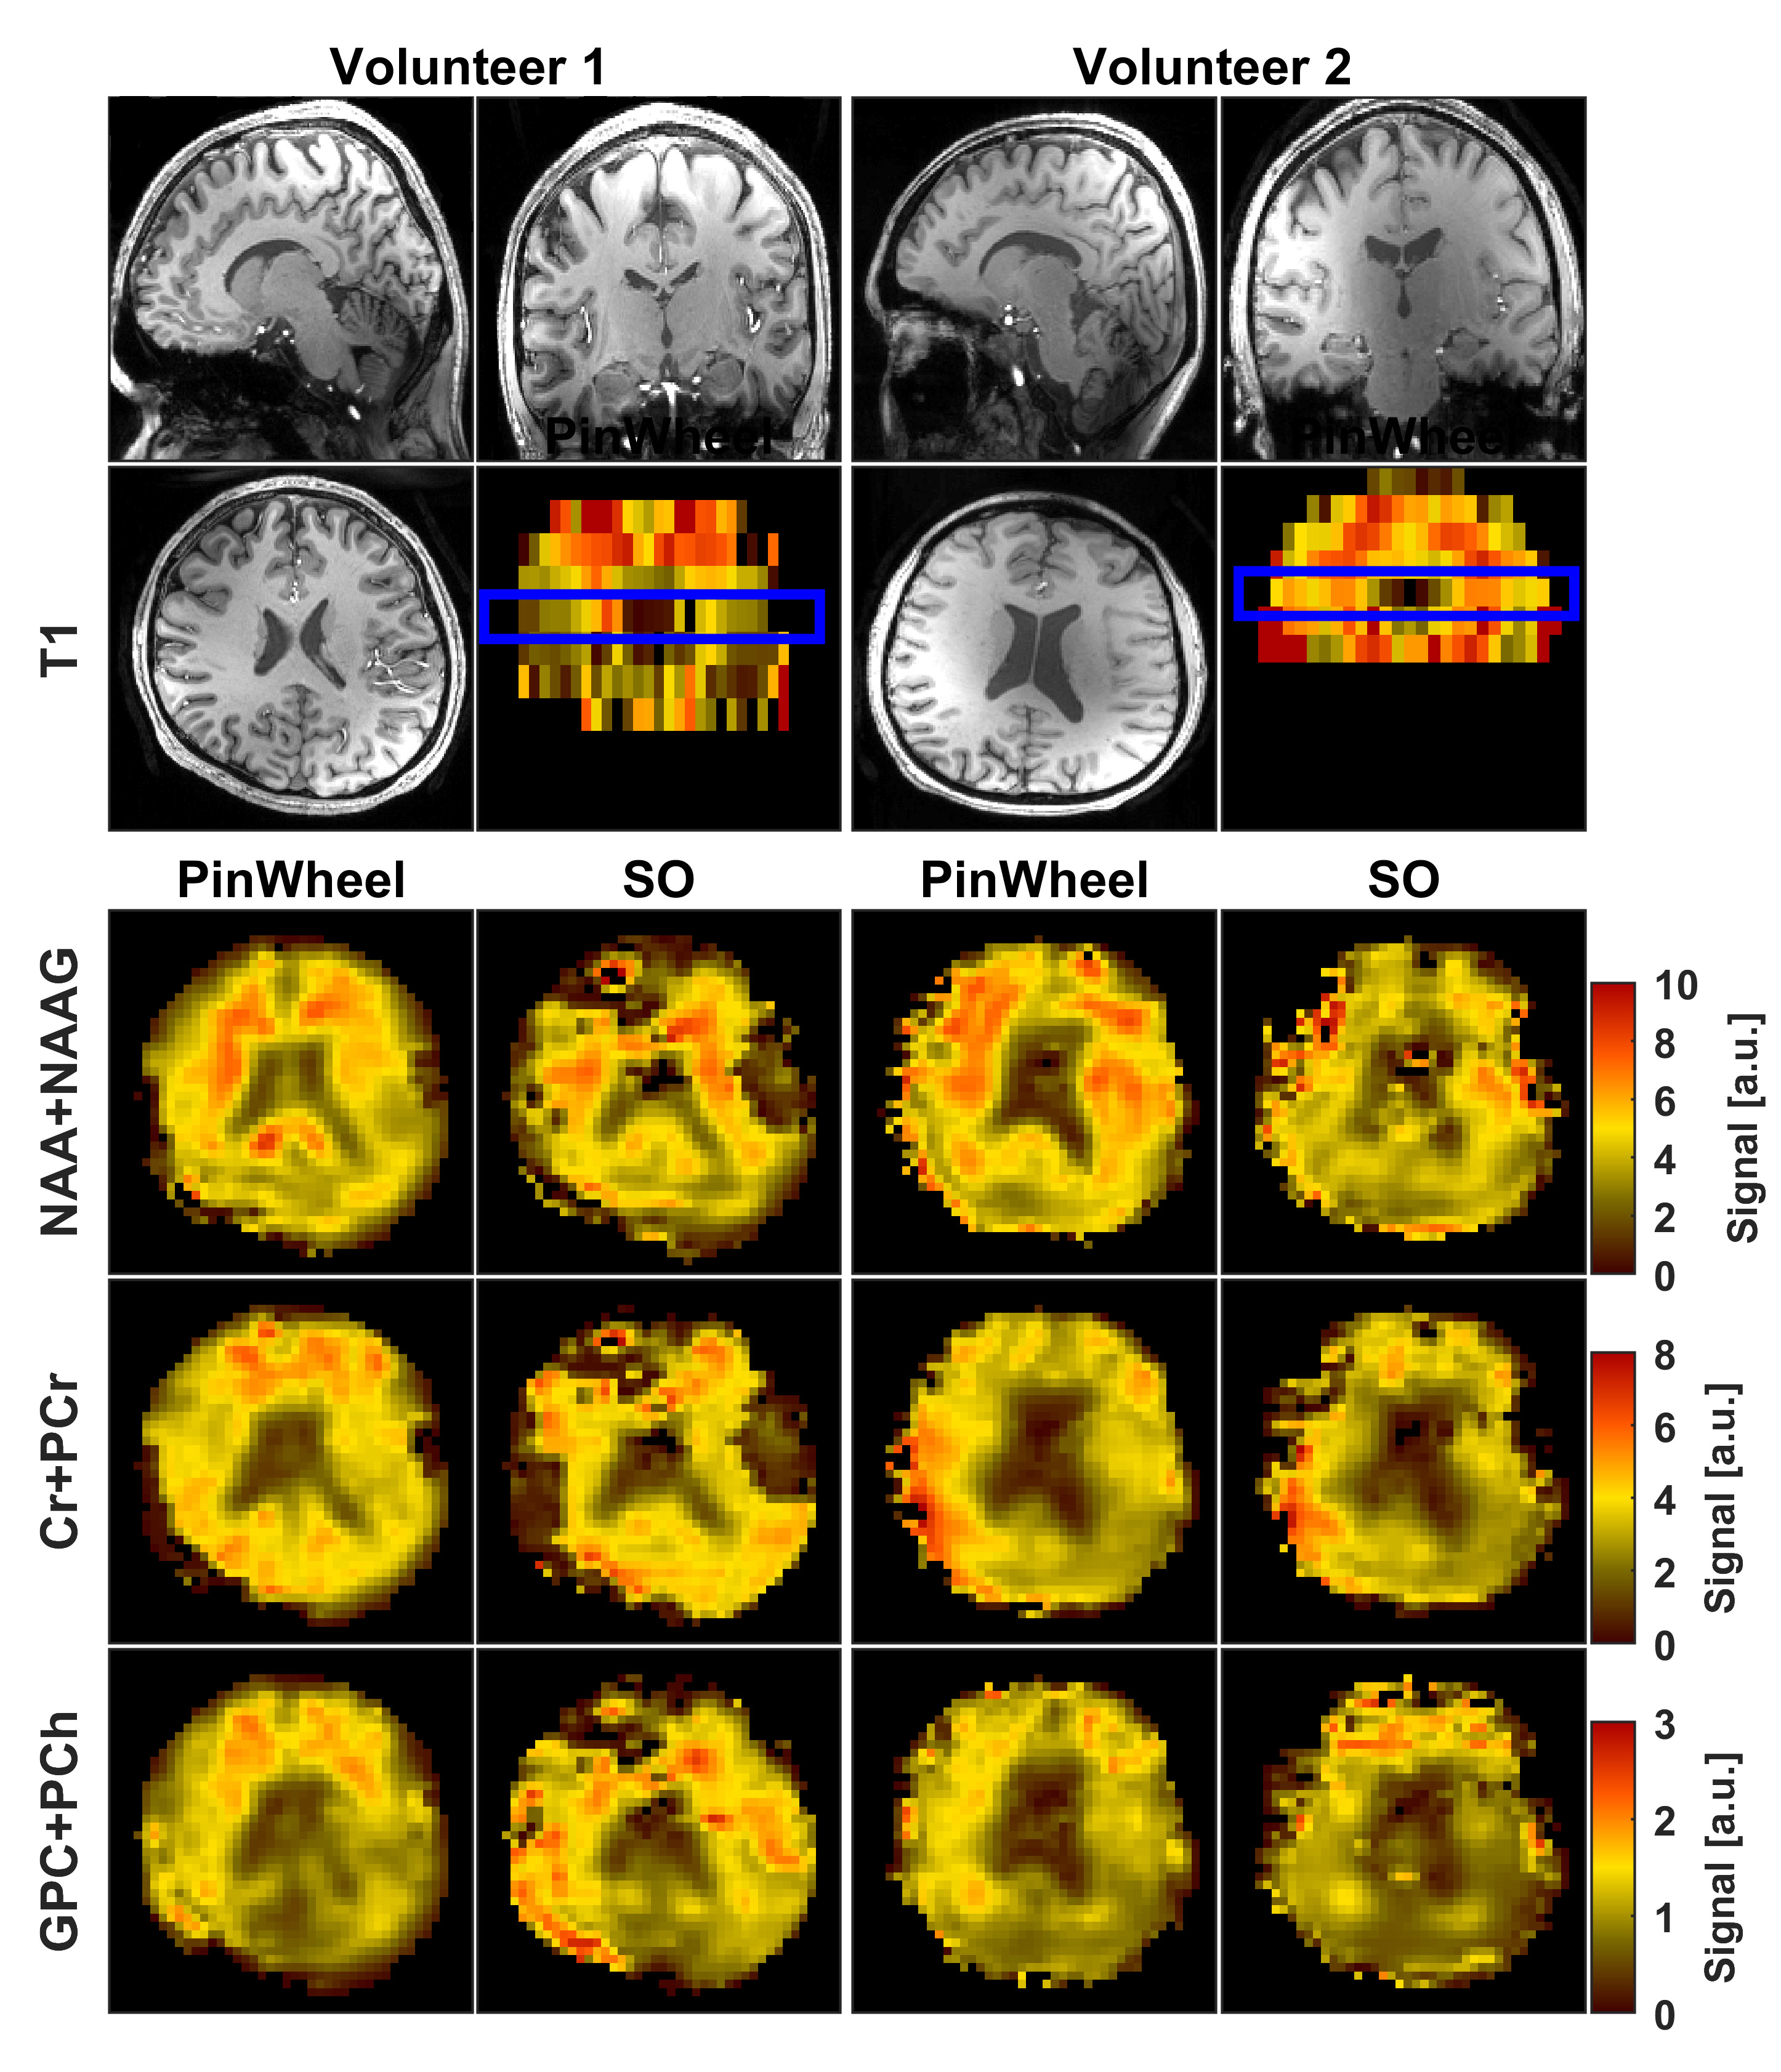
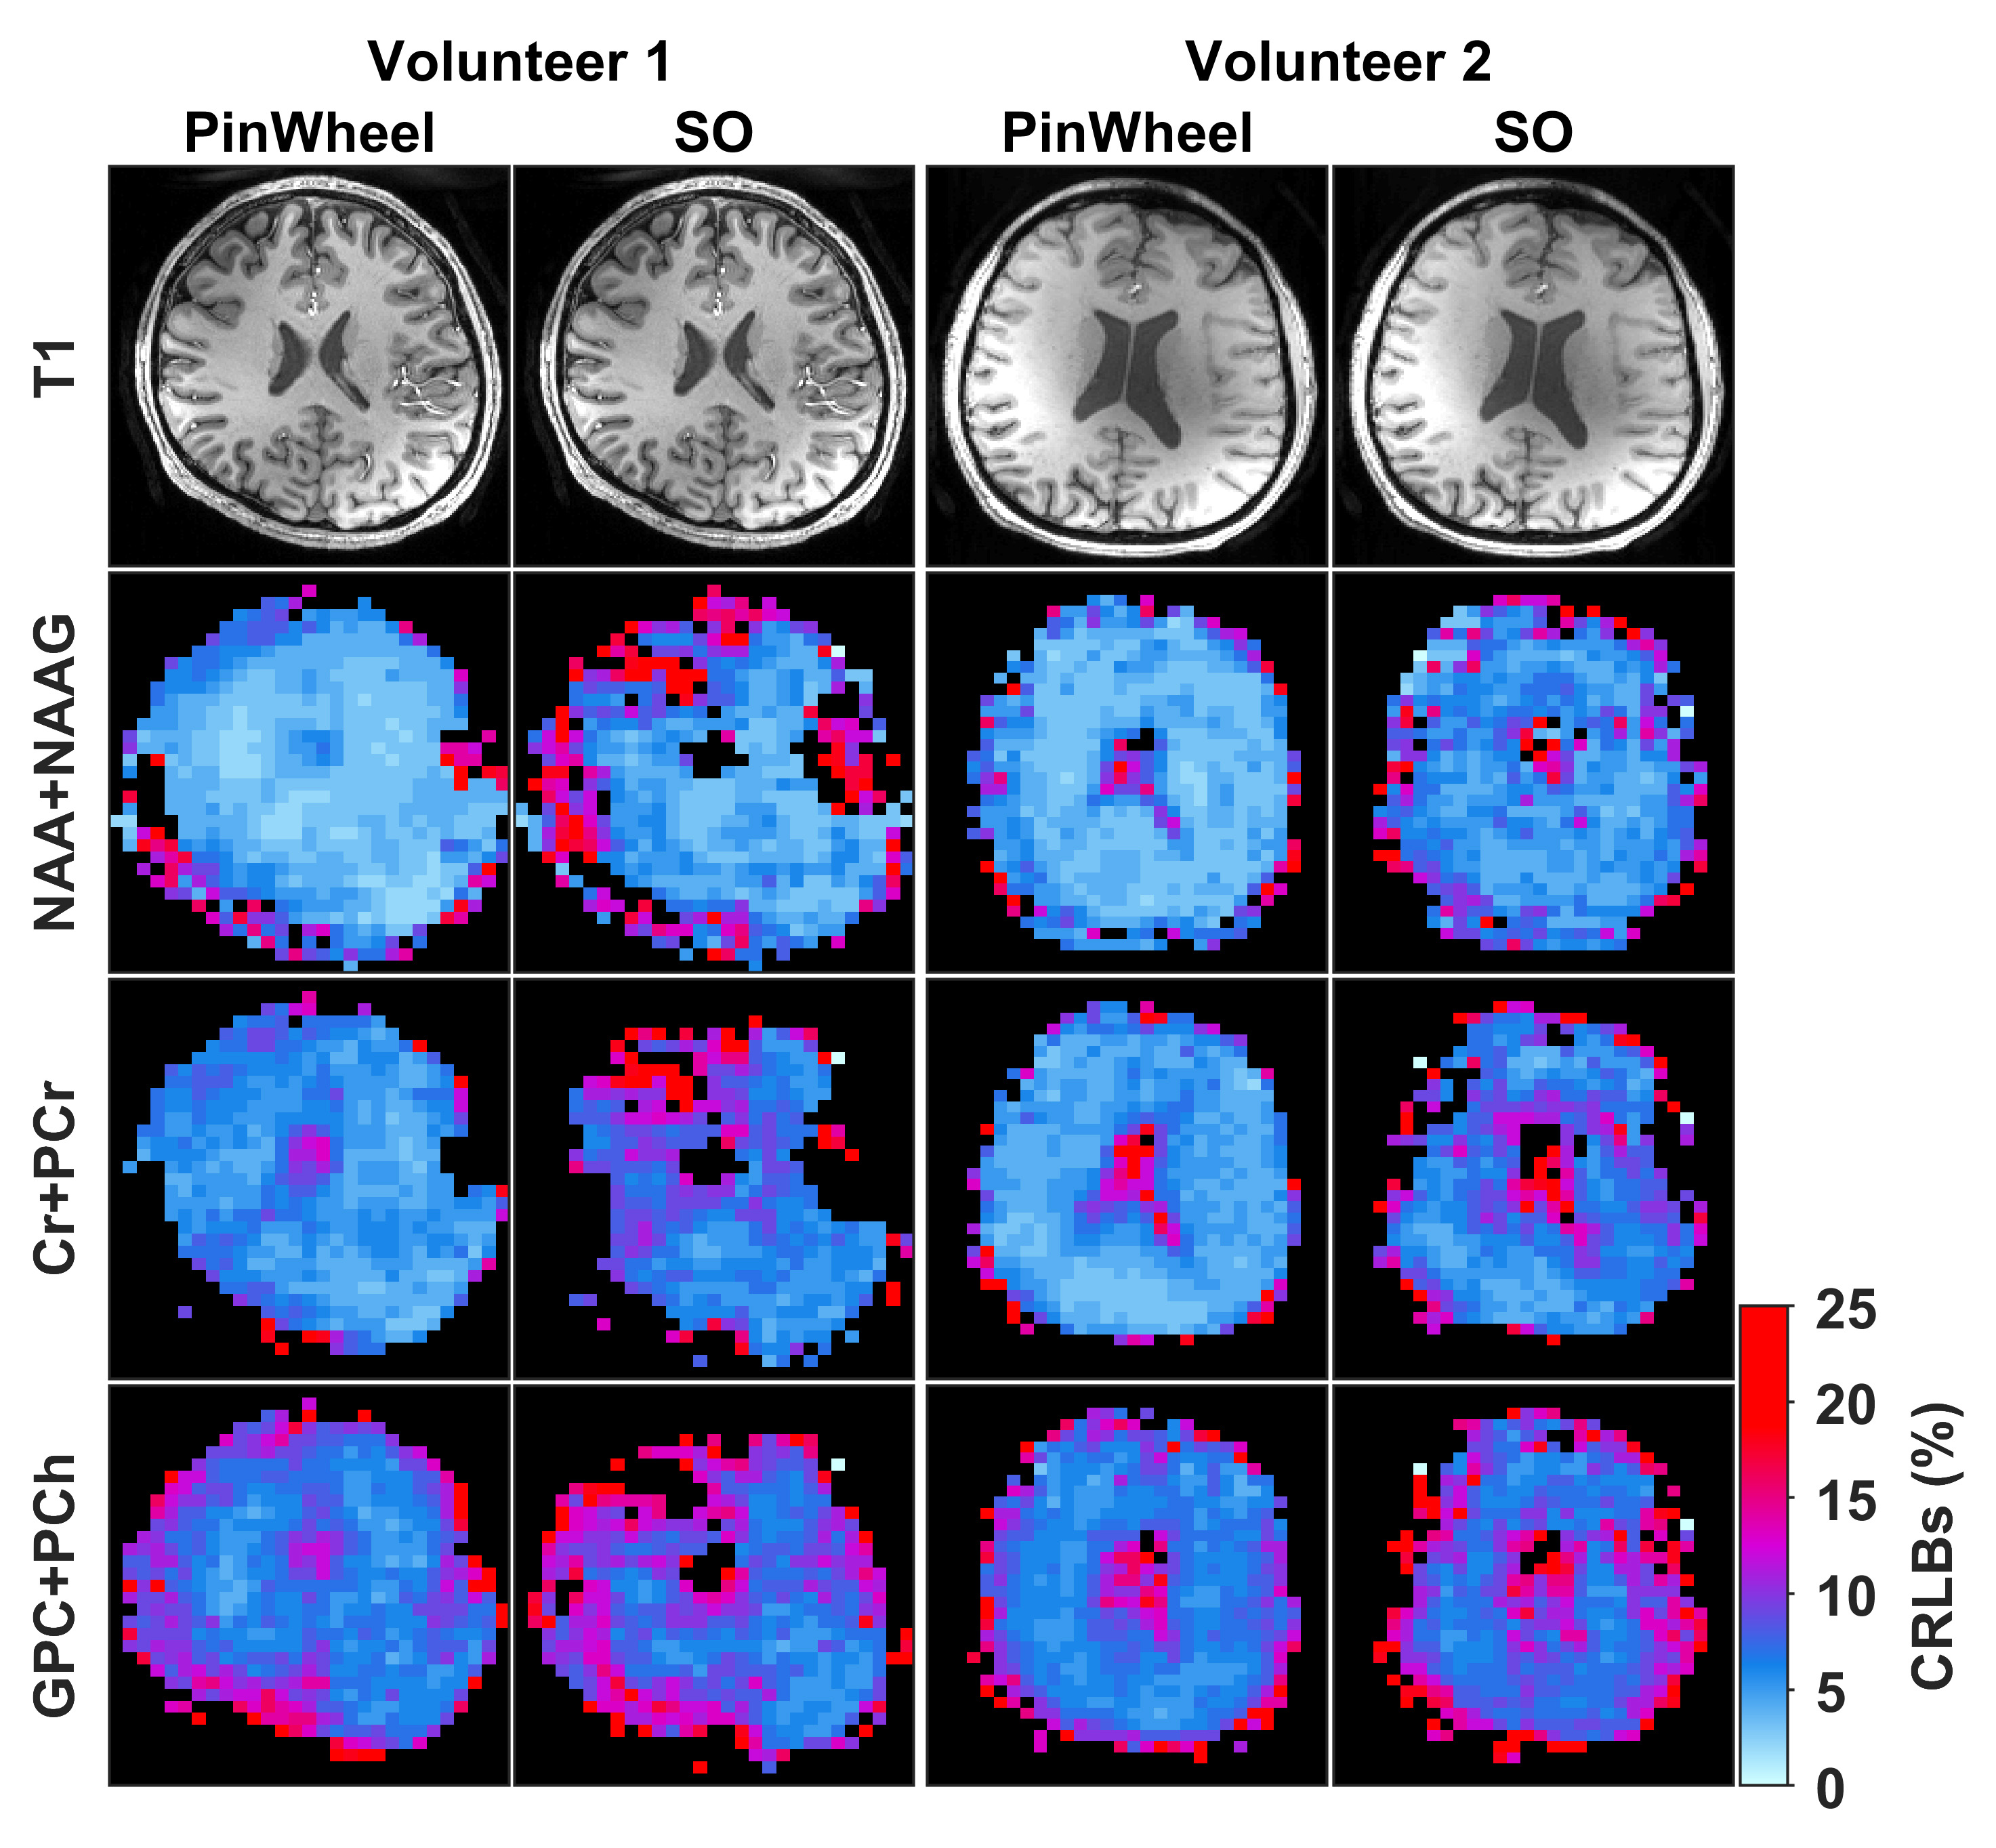
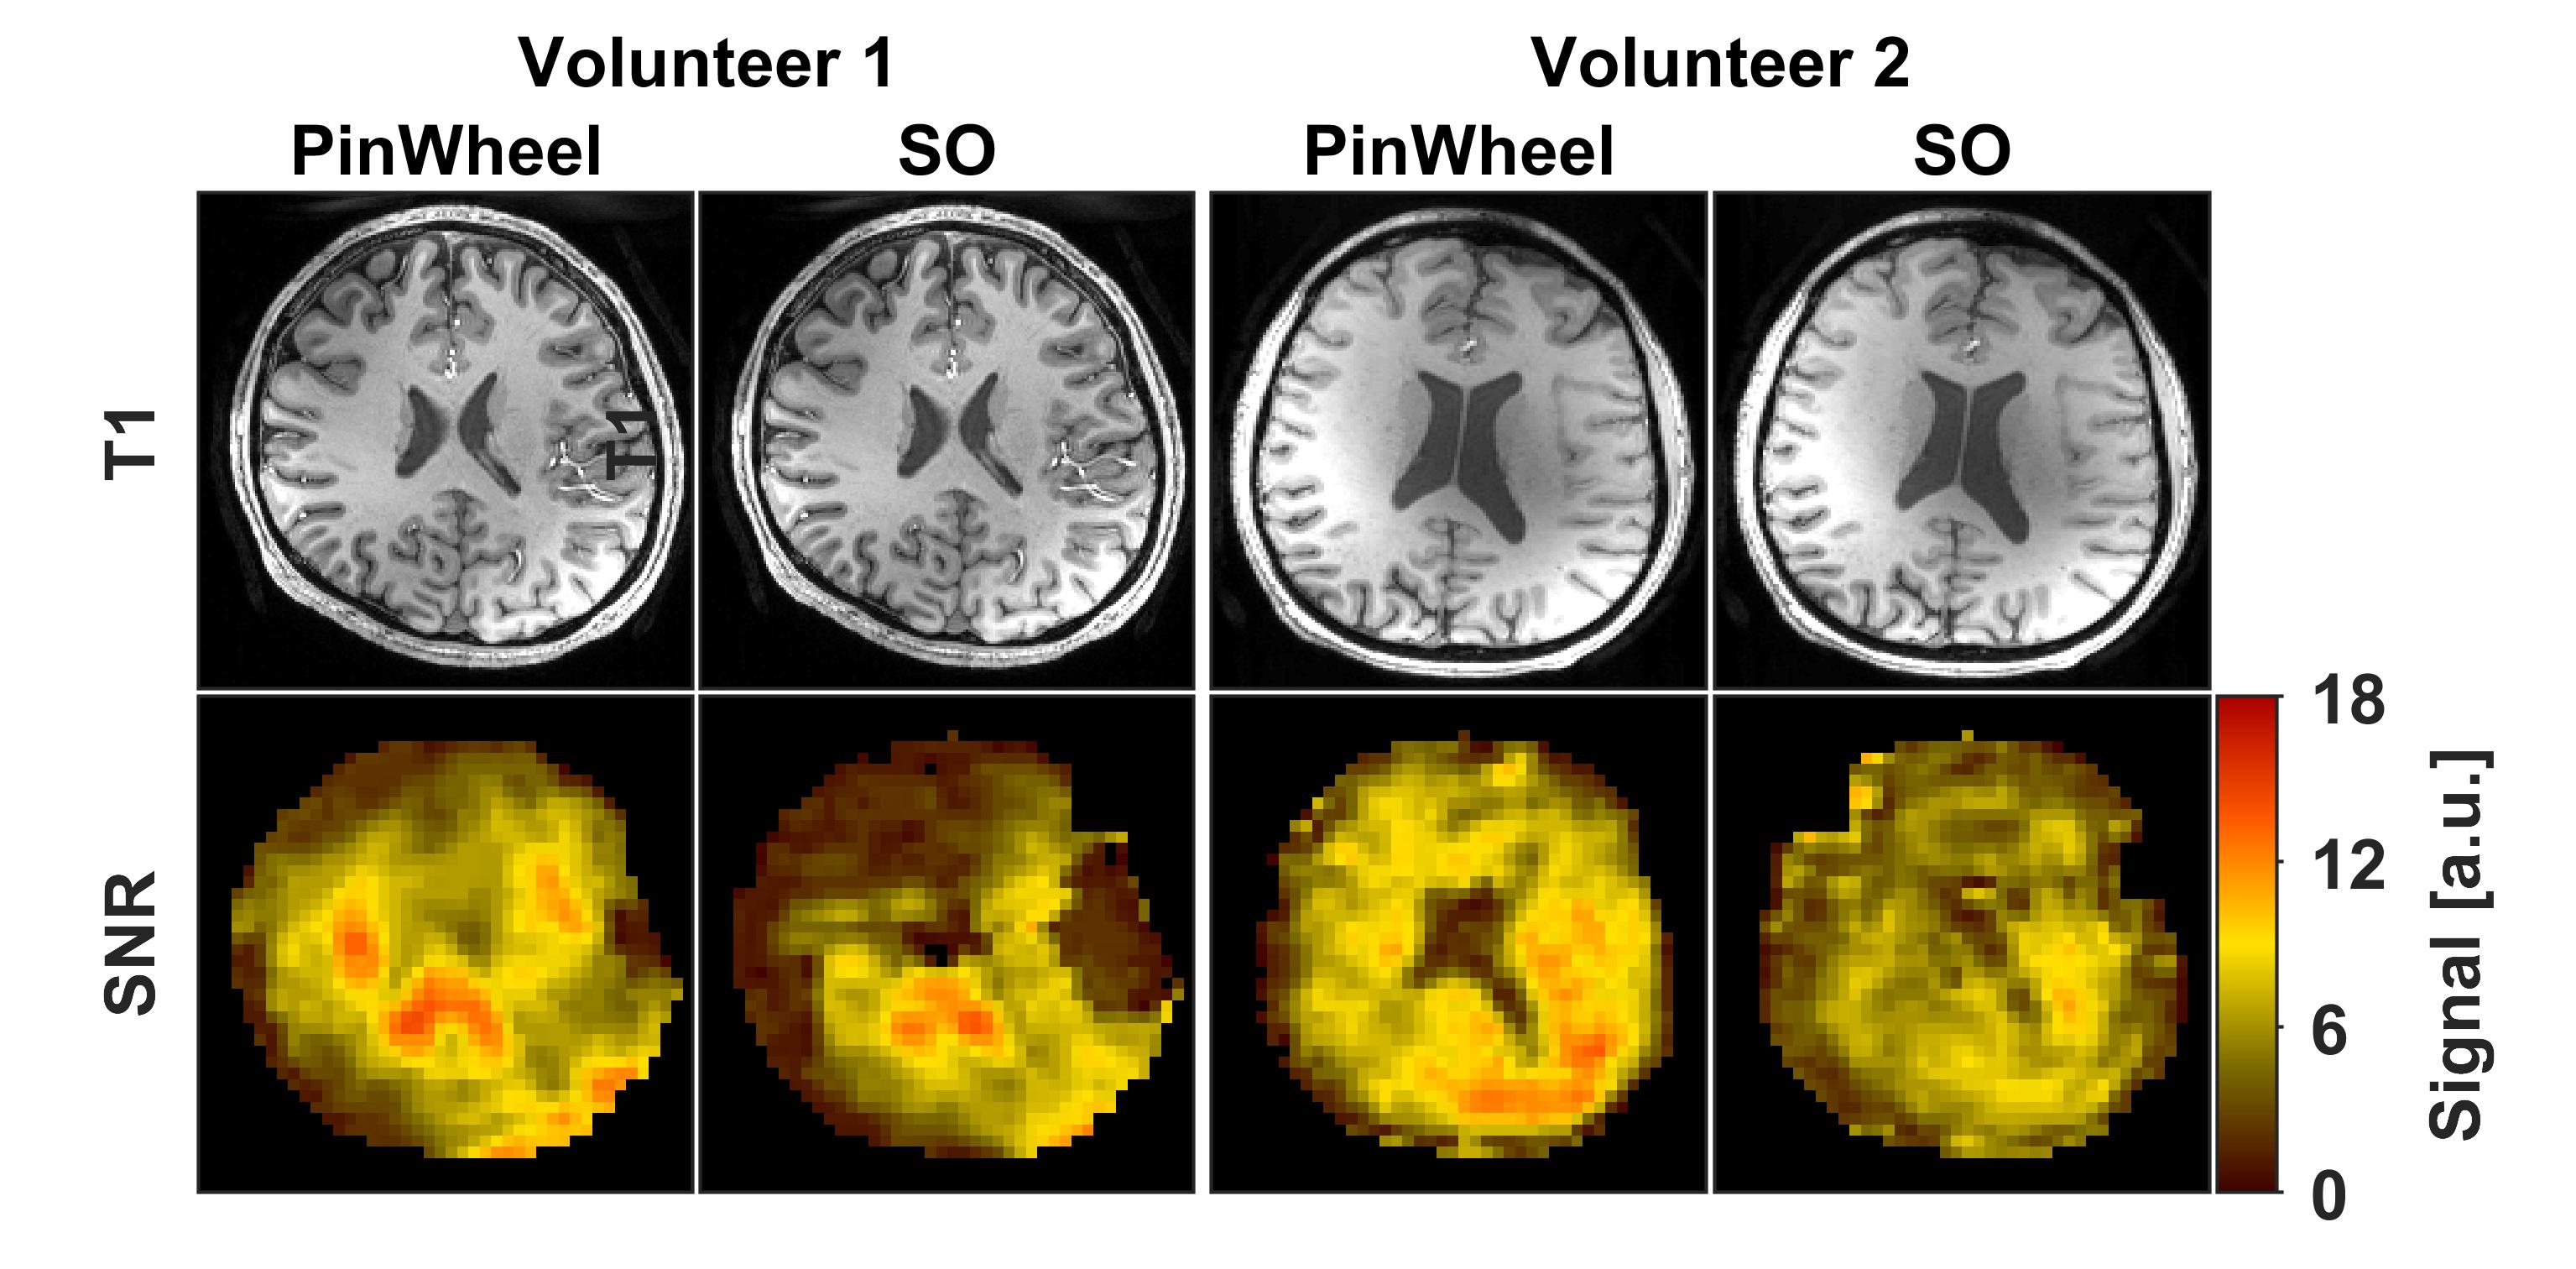
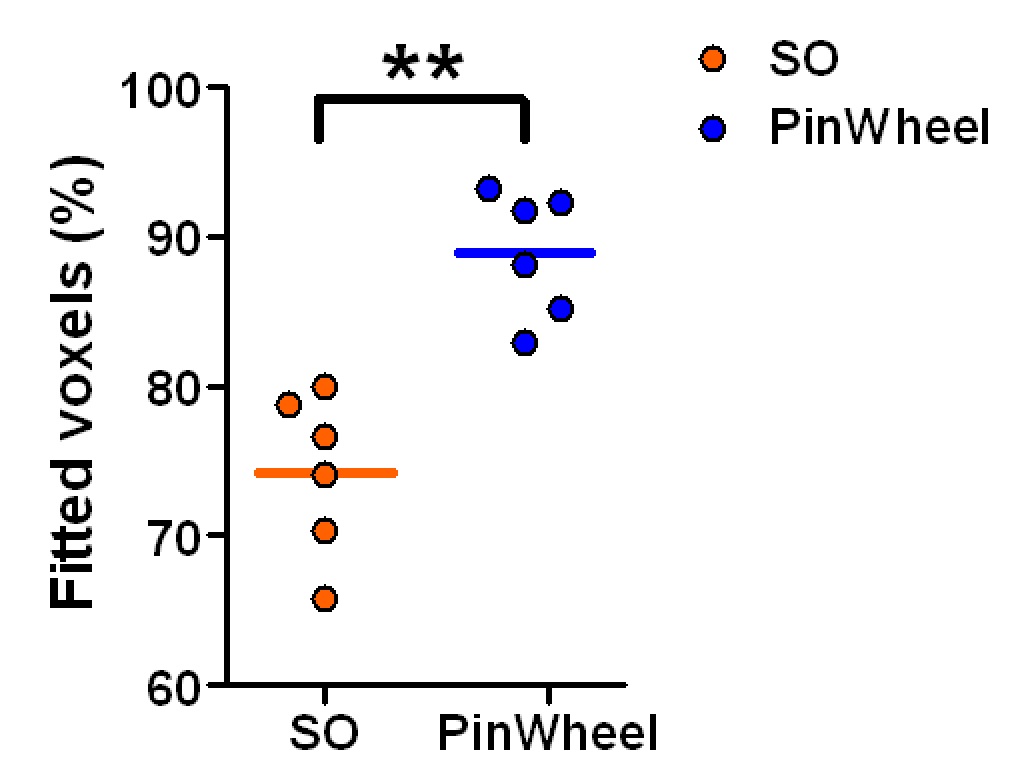
Figure 1 shows gradient waveforms in kx, ky plane for SOI and SO trajectories for FOV=220x220 mm and matrix 44x44 and spectral window of 2700 Hz and 3000 Hz for SOI and SO trajectories, respectively. The SOI k-space was acquired with 24 angular and 2 temporal interleaves (Gmax = 14.19 mT/m, Smax=158.89 mT/m/s). The spiral-out sequence used 16 angular and 3 temporal interleaves (Gmax = 18.56 mT/m, Smax=190.93 mT/m/s). The total acquisition time given by TR×Ni×Nt was, therefore, the same for both trajectories. The SOI design provides a trajectory efficiency of 95% compared to that of the spiral-out with a trajectory efficiency of 67%, by eliminating rewinders. Metabolic maps generated with SOI-MRSI on both phantom (Fig. 2) and volunteers (Fig. 3) showed improved signal-to-noise with less bluring and streaking artifacts compared to that of SO-MRSI. The SOI-MRSI decreased CRLBs (Figs 2 and 4) while the SNR was increased compared to SO-MRSI (Fig. 5). PinWheel increased the number of fitted voxels for individual metabolites significantly (P=0.0022 for NAA+NAAG, Fig.6) compared to SO-MRSI.
DISCUSSION
The use of volumetric metabolic mapping benefits clinical brain studies. Whole-brain MRSI is valuable for neurological, psychiatric, neurooncological diseases to image metabolism and neurochemistry of the brain for diagnosis and treatment planning. In applications where the total scan time needs to be minimized, the accelerated acquisitions such as spiral MRSI are used because it requires less repetitions for spatial-spectral encoding. Our results suggest that the SOI trajectory (PinWheel) provide higher quality metabolic mapping compared to SO trajectory by more efficient sampling. The proposed technique improved SNR and thus the possibility for scan time trade-off compared with conventional SO.
CONCLUSION
We designed and implemented a new SOI trajectory (PinWheel) for metabolic mapping that provides increased SNR and goodness of fit (low CRLB) for metabolite quantification. Depending on the clinical question and application, PinWheel MRSI can be optimized for a shorter scan time implementation by trading off SNR and scan time. The shorter scan time with the non-Cartesian PinWheel acquisition interleaved with the real-time motion and shim correction provides robustness to motion artifacts.
Acknowledgements
This work was supported by NIH/NCI (1R01CA211080), the South-Eastern Norway Regional Health Authority (Helse Sør-Øst 2018047), and Austrian Science Fund (J 4110, P30701).References
1. Adalsteinsson E, Irarrazabal P, Topp S, Meyer C, Macovski A, Spielman DM. Volumetric spectroscopic imaging with spiral-based k-space trajectories. Magn Reson Med 1998;39(6):889-898. 2. Esmaeili M, Bathen TF, Rosen BR, Andronesi OC. Three-dimensional MR spectroscopic imaging using adiabatic spin echo and hypergeometric dual-band suppression for metabolic mapping over the entire brain. Magnetic resonance in medicine 2017;77(2):490-497.
3. Andronesi OC, Gagoski BA, Sorensen AG. Neurologic 3D MR spectroscopic imaging with low-power adiabatic pulses and fast spiral acquisition. Radiology 2012;262(2):647-661.
4. Moser P, Bogner W, Hingerl L, Heckova E, Hangel G, Motyka S, Trattnig S, Strasser B. Non-Cartesian GRAPPA and coil combination using interleaved calibration data - application to concentric-ring MRSI of the human brain at 7T. Magnetic resonance in medicine 2019;82(5):1587-1603.
5. Schirda CV, Zhao T, Andronesi OC, Lee Y, Pan JW, Mountz JM, Hetherington HP, Boada FE. In vivo brain rosette spectroscopic imaging (RSI) with LASER excitation, constant gradient strength readout, and automated LCModel quantification for all voxels. Magnetic resonance in medicine 2016;76(2):380-390.
6. Andronesi OC, Ramadan S, Ratai EM, Jennings D, Mountford CE, Sorensen AG. Spectroscopic imaging with improved gradient modulated constant adiabaticity pulses on high-field clinical scanners. Journal of Magnetic Resonance 2010;203(2):283-293.
7. Bogner W, Gagoski B, Hess AT, Bhat H, Tisdall MD, van der Kouwe AJW, Strasser B, Marjańska M, Trattnig S, Grant E, Rosen B, Andronesi OC. 3D GABA imaging with real-time motion correction, shim update and reacquisition of adiabatic spiral MRSI. NeuroImage 2014;103:290-302.
8. Moser P, Hingerl L, Strasser B, Povazan M, Hangel G, Andronesi OC, van der Kouwe A, Gruber S, Trattnig S, Bogner W. Whole-slice mapping of GABA and GABA(+) at 7T via adiabatic MEGA-editing, real-time instability correction, and concentric circle readout. NeuroImage 2019;184:475-489.
9. Provencher SW. Estimation of Metabolite Concentrations from Localized in-Vivo Proton Nmr-Spectra. Magnetic resonance in medicine 1993;30(6):672-679.
10. Kirchner T, Fillmer A, Henning A. Mechanisms of SNR and line shape improvement by B0 correction in overdiscrete MRSI reconstruction. Magnetic resonance in medicine 2017;77(1):44-56.
11. Bilgic B, Gagoski B, Kok T, Adalsteinsson E. Lipid suppression in CSI with spatial priors and highly undersampled peripheral k-space. Magn Reson Med 2013;69(6):1501-1511.
Figures