0369
Optimization of echo time choice for seven common MRS pulse sequences through minimization of expected Cramér-Rao lower bounds.1Biomedical Engineering, Columbia University, New York, NY, United States, 2Radiology, Columbia University, New York, NY, United States
Synopsis
It has recently been recommended to utilize the minimum echo time for non-editing magnetic resonance spectroscopic experiments. Despite this intuitive recommendation there is no comprehensive and systematic investigation into the choice of echo time across numerous sequences. Here the impact of echo time on the Cramér-Rao lower bounds for 17 different metabolites across the six most commonly used pulse sequences are investigated using simulated spectral shapes, as well as a MEGA-sLASER sequence for GABA quantification. Recommendations are provided for the choice of echo time which will minimize the expected Cramér-Rao lower bound for all metabolites and sequences in question.
Introduction
Short echo time proton magnetic resonance spectroscopy (MRS) is appealing because it offers the ability to quantify roughly 15 to 20 metabolites in vivo in a non-invasive fashion[1]. As compared to an editing experiment[2], this comes at the cost of strong spectral overlap for most metabolites. Recently, a consensus recommendation has been made to utilize the shortest echo time achievable[3]. However, this intuitive recommendation has yet to be substantiated by objective measures. A method has previously been developed which determines the optimal echo times based on the minimization of the expected Cramér-Rao lower bounds[4] (CRLBs). This method is used here to determine the optimal echo time for 17 different metabolites for six commonly used short echo time sequence implementations, as well as a J-difference editing[2] sequence to measure γ-aminobutyric acid (GABA). The seven sequence implementations are: sLASER[5], [6], a stock STEAM[7] sequence (which does not have substantially different spectral shapes between implementations by the three major vendors GE, Siemens and Philips[8]), SPECIAL[9], the stock implementations of PRESS[10] for the three major vendors (which do have substantially different spectral shapes[8]), and MEGA-sLASER[11].Methods
Spectral signals were simulated for each of the 17 metabolites (Table 1) and 10 macromolecules for all short echo time sequences. For the MEGA-sLASER experiment the metabolites GABA, glutamine, glutamate and N-acetylaspartic acid were included, as they are observed in the edited spectrum[12]. All simulations used realistic RF pulses, timings, gradients and 32 spatial points in each of the three dimensions with MARSS[8]. The echo times spanned from the minimum achievable echo time (in milliseconds) on standard clinical MR systems for each of the seven sequences: 20, 20, 7, 30, 30, 30, 55 for sLASER, STEAM, SPECIAL, GE PRESS, Siemens PRESS, Philips PRESS, and MEGA-sLASER respectively, to 220, 220, 219, 216, 216, 216, and 221, assuming the typical acquisition of half echo sampling (i.e., acquisition starts at the peak of the echo). To increment the echo time for sLASER, equal delays were added between the 3rd and 4th refocusing pulse and between the 4th refocusing pulse and the start of data acquisition. Because either TE1 or TE2 of PRESS can be adjusted separately to obtain a specified echo time these values were arrayed over separately. Echo time steps of 2 ms were used for sLASER, STEAM, SPECIAL and 6 ms for PRESS, and 1 ms for MEGA-sLASER. All simulations were performed at 3.00 Tesla except the Siemens PRESS, sLASER and MEGA-sLASER which were performed at 2.90 Tesla (Siemens’ 3T field strength).Synthetic spectra, similar to the procedure performed by Bolliger et al[13]., were assembled at each of the echo times for each of the seven pulse sequences. This was achieved by exponentially line broadening each of the metabolites by LB + $$$1/({\pi T_2^m})$$$, where LB is the linebroadening constant applied to all metabolites (5 Hz) and $$$T_2^m$$$ is the spin-spin relaxation constant for each of the individual metabolites. These broadened simulated spectra were then scaled by their respective concentration, and multiplied by the appropriate scaling factors derived from analytical solutions to the Bloch equation for each sequence and metabolite to incorporate T1 and T2 relaxation. The values used from the literature for metabolite concentration, T1 and T2 to create synthetic spectra are given in Table 1. Additionally, ten macromolecule signals, modeled as linebroadened Lorentzian shapes[14], were included in the simulations. The macromolecules were modeled with measured concentrations, linewidths and T2 values from 12 different voxels, as measured with a sLASER sequence, and an assumed T1 of 420 ms[15]. Cramér-Rao lower bounds (CRLBs) were then calculated for all metabolites at each individual echo time for each metabolite with INSPECTOR[16], [17] using a procedure identical to Bolliger et al[13]. Relative CRLBs (rCRLB) were calculated by normalizing the CRLB at each echo time by the value at the minimum echo time for each respective metabolite and sequence.
Results and Discussion
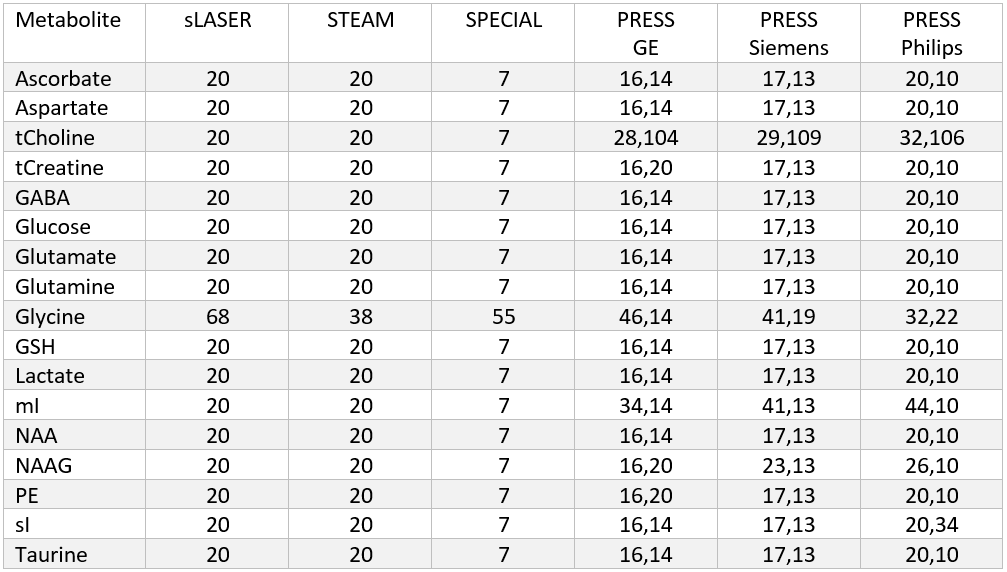
Realistic synthesized spectra were obtained with each of the seven pulse sequence implementations (Figure 1). Curves consistent with Bolliger et al. were obtained for all sequences, with representative results of a short echo time sequence (sLASER) being shown in Figure 2, and MEGA-sLASER being shown in Figure 3. For all sequences the majority of metabolites had a minimum rCRLB at the minimum achievable echo time (Table 2). For sLASER the only metabolite which benefited from a longer echo time (68 ms) was glycine. The rCRLB can increase quite dramatically with echo time for metabolites which evolve rapidly or have a short T2. For example, the rCRLB with sLASER for glutamate and GABA at TE = 30 ms is 1.49 and 1.77, respectively.The optimal echo time for MEGA-sLASER to measure GABA was TE = 79 ms. The reduction in rCRLB from the optimal echo time as compared to the typically used TE of 72 ms[17], [18] is 17%. Additionally the longer TE reduces macromolecule contamination due to longer editing pulses[19].
Conclusions
The optimal echo time for individual metabolites was determined for seven different sequence implementations. These results provide quantitative evidence for the consensus recommendation of utilizing the minimum achievable echo time for general-purpose MRS. The optimal echo time for MEGA-sLASER to measure GABA is 79 ms.Acknowledgements
Special thanks to Martin Gajdošík, PhD, for fruitful discussions and input.References
[1] R. A. de Graaf, In Vivo NMR Spectroscopy: Principles and Techniques. 1998.
[2] D. L. Rothman, O. A. C. Petroff, L. Kevin, and R. H. Mattson, “Localized 1H NMR measurements of y-aminobutyric acid in human brain in vivo,” Proc Natl Acad Sci USA, vol. 90, pp. 5662–5666, 1993.
[3] M. Wilson et al., “Methodological consensus on clinical proton MRS of the brain: Review and recommendations,” Magn Reson Med, pp. 1–24, 2019.
[4] S. Cavassila, S. Deval, C. Huegen, D. van Ormondt, and D. Graveron-Demilly, “Cramer-Rao Bound Expressions for Parametric Estimation of Overlapping Peaks: Influence of Prior Knowledge,” J Magn Reson, vol. 143, pp. 311–320, 2000.
[5] T. W. J. Scheenen, D. W. J. Klomp, J. P. Wijnen, and A. Heerschap, “Short echo time 1H-MRSI of the human brain at 3T with minimal chemical shift displacement errors using adiabatic refocusing pulses,” Magn Reson Med, vol. 59, no. 1, pp. 1–6, 2008.
[6] T. W. Scheenen, A. Heerschap, and D. W. Klomp, “Towards 1H-MRSI of the human brain at 7T with slice-selective adiabatic refocusing pulses.,” Magn Reson Mater Phy, vol. 21, no. 1–2, pp. 95–101, 2008.
[7] J. Frahm, K.-D. Merboldt, and W. Hänicke, “Localized Proton Spectroscopy using Stimulated Echoes,” J Magn Reson, vol. 72, no. 3, pp. 502–508, 1987.
[8] K. Landheer, K. M. Swanberg, and C. Juchem, “Magnetic Resonance Spectrum Simulator (MARSS), A Novel Software Package for Fast and Computationally Efficient Basis Set Simulation,” NMR Biomed, p. e4129, 2019.
[9] V. Mlynárik, G. Gambarota, H. Frenkel, and R. Gruetter, “Localized short-echo-time proton MR spectroscopy with full signal-intensity acquisition,” Magn Reson Med, vol. 56, no. 5, pp. 965–970, 2006.
[10] P. A. Bottomley, “Spatial Localization in NMR Spectroscopy in Vivo.,” Ann N Y Acad Sci, vol. 508, pp. 333–348, 1987.
[11] A. Andreychenko, D. W. J. Klomp, R. A. De Graaf, P. R. Luijten, and V. O. Boer, “In vivo GABA T2 determinaton with J-refocused echo time extension at 7 T,” NMR Biomed., vol. 26, no. 11, pp. 1596–1601, 2013.
[12] K. Landheer, R. F. Schulte, M. S. Treacy, K. M. Swanberg, and C. Juchem, “Theoretical description of modern 1H in Vivo magnetic resonance spectroscopic pulse sequences,” JMRI, p. [Epub ahead of print], 2019.
[13] C. S. Bolliger, C. Boesch, and R. Kreis, “On the use of Cramér-Rao minimum variance bounds for the design of magnetic resonance spectroscopy experiments.,” Neuroimage, vol. 83, pp. 1031–40, 2013.
[14] J. Pfeuffer, C. Juchem, H. Merkle, A. Nauerth, and N. K. Logothetis, “High-field localized 1H NMR spectroscopy in the anesthetized and in the awake monkey,” Magn Reson Imag, vol. 22, no. 10 SPEC. ISS., pp. 1361–1372, 2004.
[15] L. Xin, B. Schaller, V. Mlynarik, H. Lu, and R. Gruetter, “Proton T1 relaxation times of metabolites in human occipital white and gray matter at 7 T,” Magn Reson Med, vol. 69, pp. 931–936, 2013.
[16] C. Juchem, “INSPECTOR - Magnetic Resonance Spectroscopy Software,” http://juchem.bme.columbia.edu/software-and-tools.
[17] H. Prinsen, R. a de Graaf, G. F. Mason, D. Pelletier, and C. Juchem, “Reproducibility measurement of glutathione, GABA, and glutamate: Towards in vivo neurochemical profiling of multiple sclerosis with MR spectroscopy at 7T.,” J Magn Reson Imag, vol. 45, no. 1, pp. 187–198, Jan. 2017.
[18] A. Andreychenko, V. O. Boer, C. S. Arteaga de Castro, P. R. Luijten, and D. W. J. Klomp, “Efficient Spectral Editing at 7 T: GABA Detection with MEGA-sLASER.,” Magn Reson Med, vol. 68, no. 4, pp. 1018–1025, 2012.
[19] P. Mullins et al., “Current practice in the use of MEGA-PRESS spectroscopy for the detection of GABA,” Neuroimage, pp. 43–52, 2014.
[20] J. Knight-Scott, P. Brennan, S. Palasis, and X. Zhong, “Effect of Repetition Time on Metabolite Quantification in the Human Brain in 1H MR Spectroscopy at 3 Tesla,” J Magn Reson Imaging, vol. 45, pp. 710–721, 2017.
[21] V. Mlynarik, S. Gruber, and E. Moser, “Proton T1 and T2 relaxation times of human brain metabolites at 3 Tesla,” NMR Biomed., vol. 14, no. 5, pp. 325–331, 2001.
[22] N. A. J. Puts, P. B. Barker, and R. A. E. Edden, “Measuring the longitudinal relaxation time of GABA in vivo at 3T,” vol. 85, no. 0 1, pp. 1–27, 2015.
[23] K. Landheer, A. Sahgal, S. Myrehaug, A. P. Chen, C. H. Cunningham, and S. J. Graham, “A rapid inversion technique for the measurement of longitudinal relaxation times of brain metabolites: application to lactate in high-grade gliomas at 3 T.,” NMR Biomed., vol. 29, pp. 1381–1390, Jul. 2016.
[24] P. O. Wyss et al., “In Vivo Estimation of Transverse Relaxation Time Constant (T2) of 17 Human Brain Metabolites at 3T,” Magn Reson Med, vol. 80, pp. 452–461, 2018.
Figures