0368
HERCULES and ConCAT: Simultaneous modelling and fitting of 11 metabolites using LCModel1Neuroimaging, King's College London, London, United Kingdom, 2Russell H. Morgan Department of Radiology and Radiological Science, The Johns Hopkins University School of Medicine, Baltimore, MD, United States, 3F. M. Kirby Research Center for Functional Brain Imaging, Kennedy Krieger Institute, Baltimore, MD, United States, 4Radiology and Radiological Science, The Johns Hopkins University School of Medicine,, Baltimore, MD, United States
Synopsis
Advanced spectral editing techniques have focused mainly on GABA and GSH discrimination and detection. HERCULES, unlike all predecessor sequences, delivers a reliable detection method for GABA and GSH, but also for ascorbate, aspartate, 2-hydroxyglutarate, lactate, NAA and NAAG. However, current analysis methods have not been optimized for HERCULES analysis. We investigated simultaneous LCModel fitting of the concatenated sum and difference spectra calculated from HERCULES data. The concatenated (ConCAT) approach enables the use of all available spectral information. Compared to traditional single-spectrum analysis, ConCAT yielded improved results, with lower coefficients of variation obtained for concentration estimates and Cramér-Rao lower bounds.
Introduction
Recent advancements in the field of J-difference editing have shifted the perspective from editing gamma-aminobutyric acid (GABA) and glutathione (GSH) to multiple-metabolite editing using a single pulse sequence: HERCULES. Compared to MEGA-PRESS2 and HERMES3, HERCULES4 is the only scheme to simultaneously edit and resolve the signals of up to eleven chemicals: ascorbate, aspartate, GABA, GSH, 2-hydroxyglutarate, lactate, NAA, NAAG, total choline, myo-inositol, glutamate and glutamine.HERCULES is a four-step editing scheme that Hadamard-encodes MR signals from coupled low and high-concentration metabolites using 20-ms editing pulses applied at specific frequency shifts: 4.58 ppm (targeting GSH, NAA, NAAG), 1.9 ppm (targeting GABA, 2-hydroxyglutarate), 4.18 ppm (targeting ascorbate, aspartate, lactate) (Figure 1.a). The editing steps (Figure 1.b) are designed to facilitate the discrimination of edited signals with reduced spectral overlap. Sum and difference spectra for GABA and GSH are calculated using A, B, C, D sub-spectra.
A persisting analysis issue is the compromise between the amount of spectral information used and the reliability of concentration estimations. Single-spectrum analysis of HERCULES data would prevent the incorporation of valuable spectral information and therefore drastically limit the analysis software (LCModel5, Gannet6, Tarquin7 or jMRUI8) to estimating a limited number of chemical compounds.
Here, we investigated whether the simultaneous modelling and multiplexed fitting (ConCAT) of HERCULES sum and difference spectra in LCModel generates improved metabolite quantification compared to single-spectrum modelling and independent fitting of the individual Hadamard combinations.
Methods
All MR data were acquired on a 3T Siemens Prisma scanner (Siemens Healthineers, Erlangen, Germany), using a 32-channel head matrix coil for receive. Ten healthy adults (5 men, mean age=29.3±2.9 years) were recruited. Ethical approval and informed consent were obtained for all subjects.Data were acquired from two 3.0×3.0×3.0 cm3 voxels, one white-matter-rich (WM) in the centrum semiovale and another, grey-matter-rich (GM), over the cingulate cortex (Figure 1.c). Acquisition parameters included: TR/TE=2000/80ms; 2048 data points; 2kHz spectral width; 320 averages; PRESS localization, CHESS water suppression.
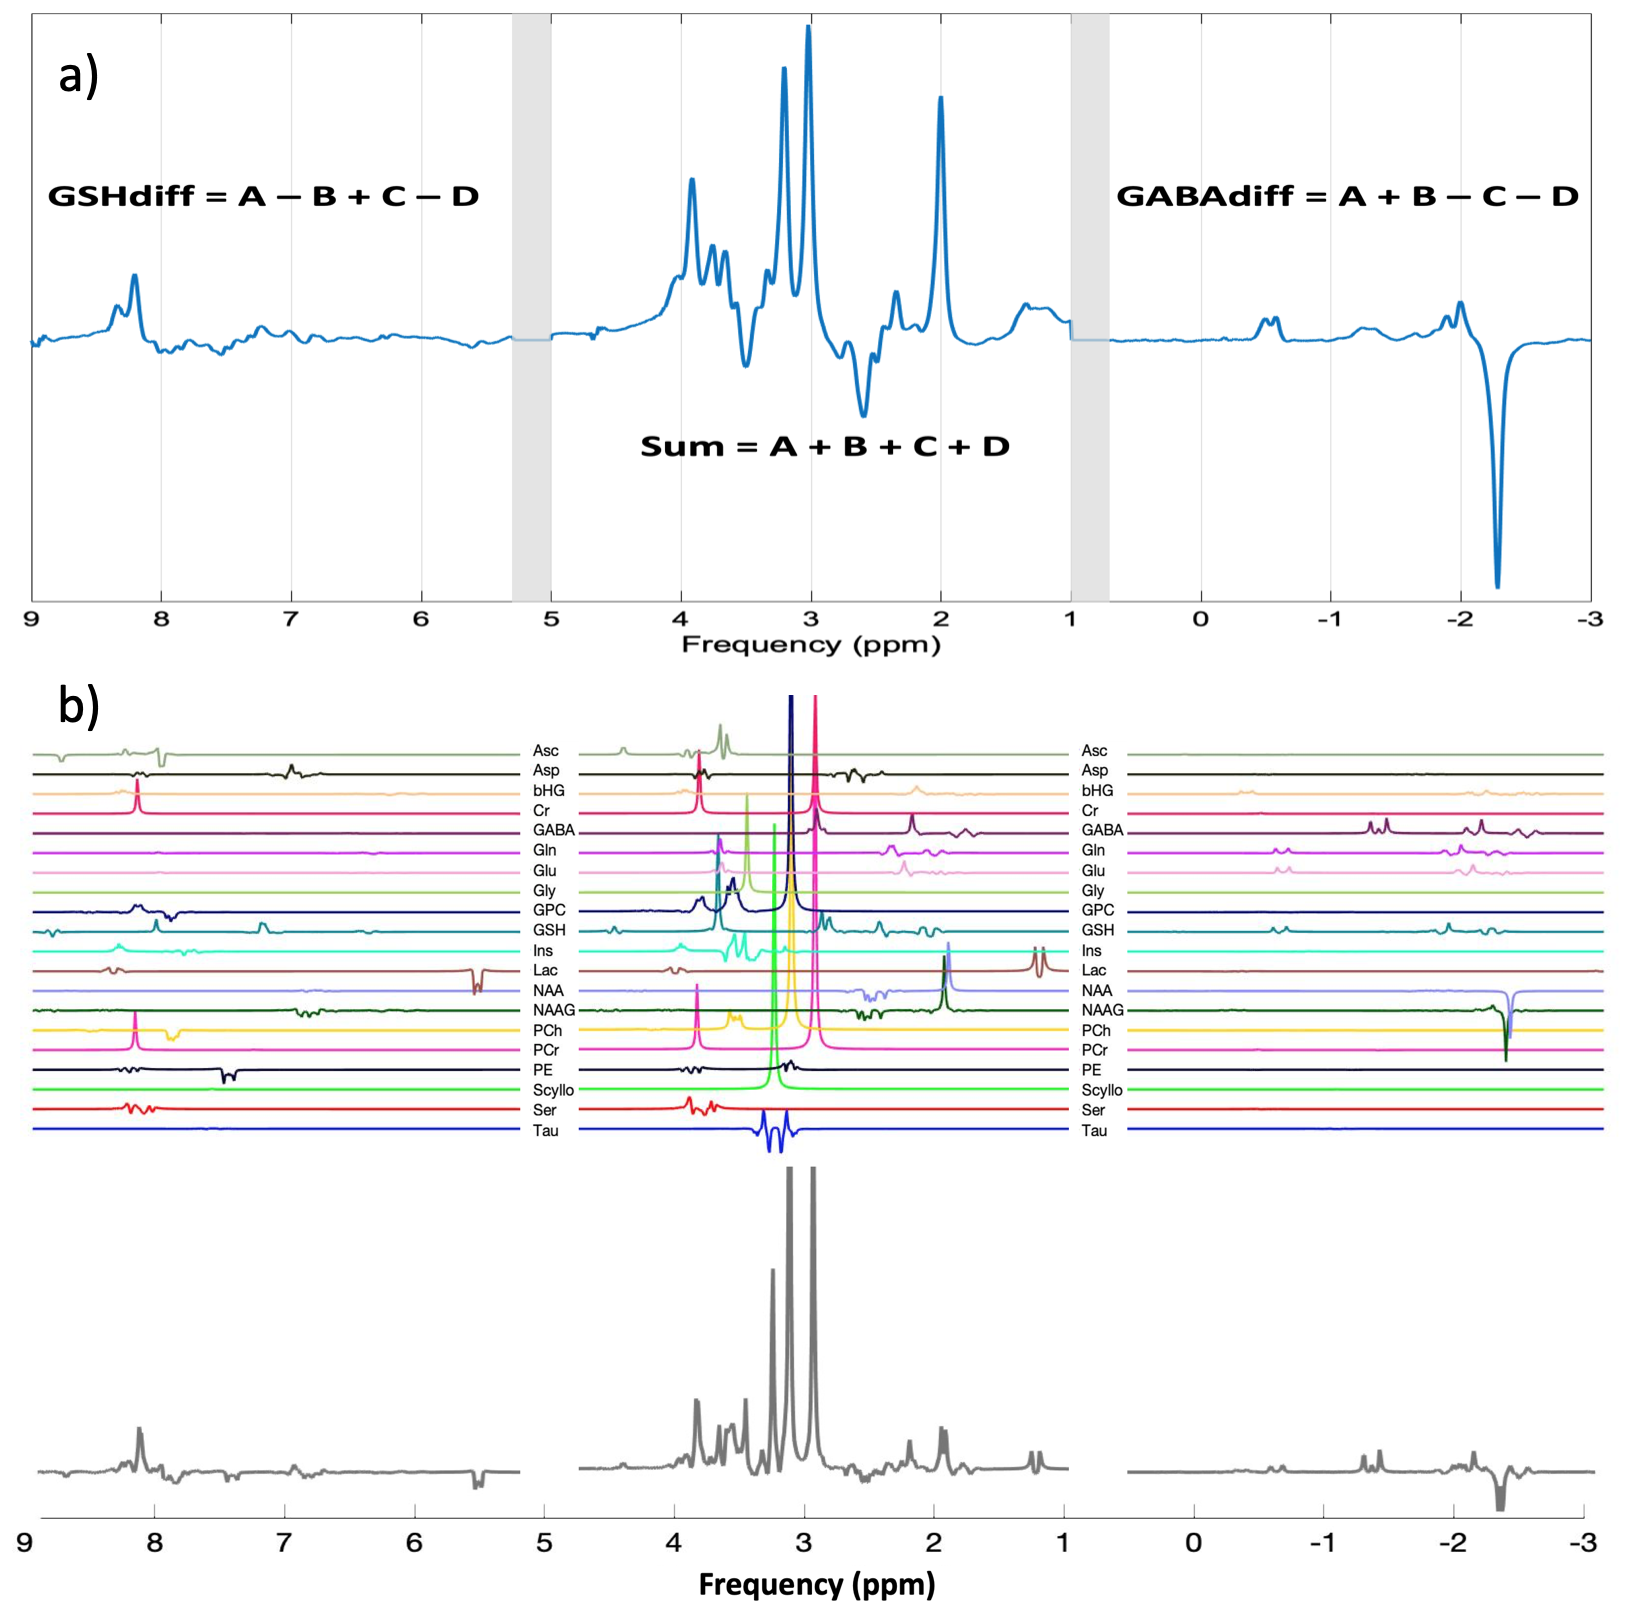
Pre-processing was performed in MATLAB (The MathWorks, Natick, MA) using a custom-made pipeline based on adapted scripts and functions from the FID-A9 package. Receiver-coil combination, removal of motion corrupted averages, and frequency and phase correction using spectral registration10 were applied. The four HERCULES sub-spectra were multiplied by a 4×4 Hadamard matrix to obtain the following recombined spectra: Sum=A+B+C+D, GABAdiff=A+B–C–D and GSHdiff=A–B+C–D. A single, unified spectrum was created by concatenating these three spectra with 0.2 ppm gaps (Figure 2.a). All calculated spectra were saved in LCModel RAW format.
Metabolite basis sets were created using full density matrix simulations performed on a three-dimensional grid of 21×21×21 spatial points within the 3.0×3.0×3.0 cm3 voxel (Figure 2.b). Twenty metabolite spin systems were included in the basis set: ascorbate, aspartate, 2-hydroxyglutarate, creatine, GABA, glycerophosphorylcholine, GSH, glutamate, glutamine, glycine, inositol, lactate, NAA, NAAG, phosphorylcholine, phosphocreatine, phosphorylethanolamine, scyllo-inositol, serine, taurine. For each metabolite, the basis functions obtained were Hadamard-transformed, concatenated and converted to LCModel-compatible format.
The LCModel (version 6.3-1L) software package was used for analysis. The two difference spectra, sum spectrum and concatenated spectrum were analysed with corresponding basis sets and individually optimised control parameters files. Phase corrections and soft constraints on signal amplitudes imposed by LCModel were disabled. The estimated metabolite levels were referenced to tCr (=Cr+PCr) and tNAA (=NAA+NAAG).
Coefficients of variance (CV) of metabolite ratios and Cramer-Rao lower bounds (CRLB) across the sample were considered to estimate the modelling performance for each metabolite and fitting approach.
Results
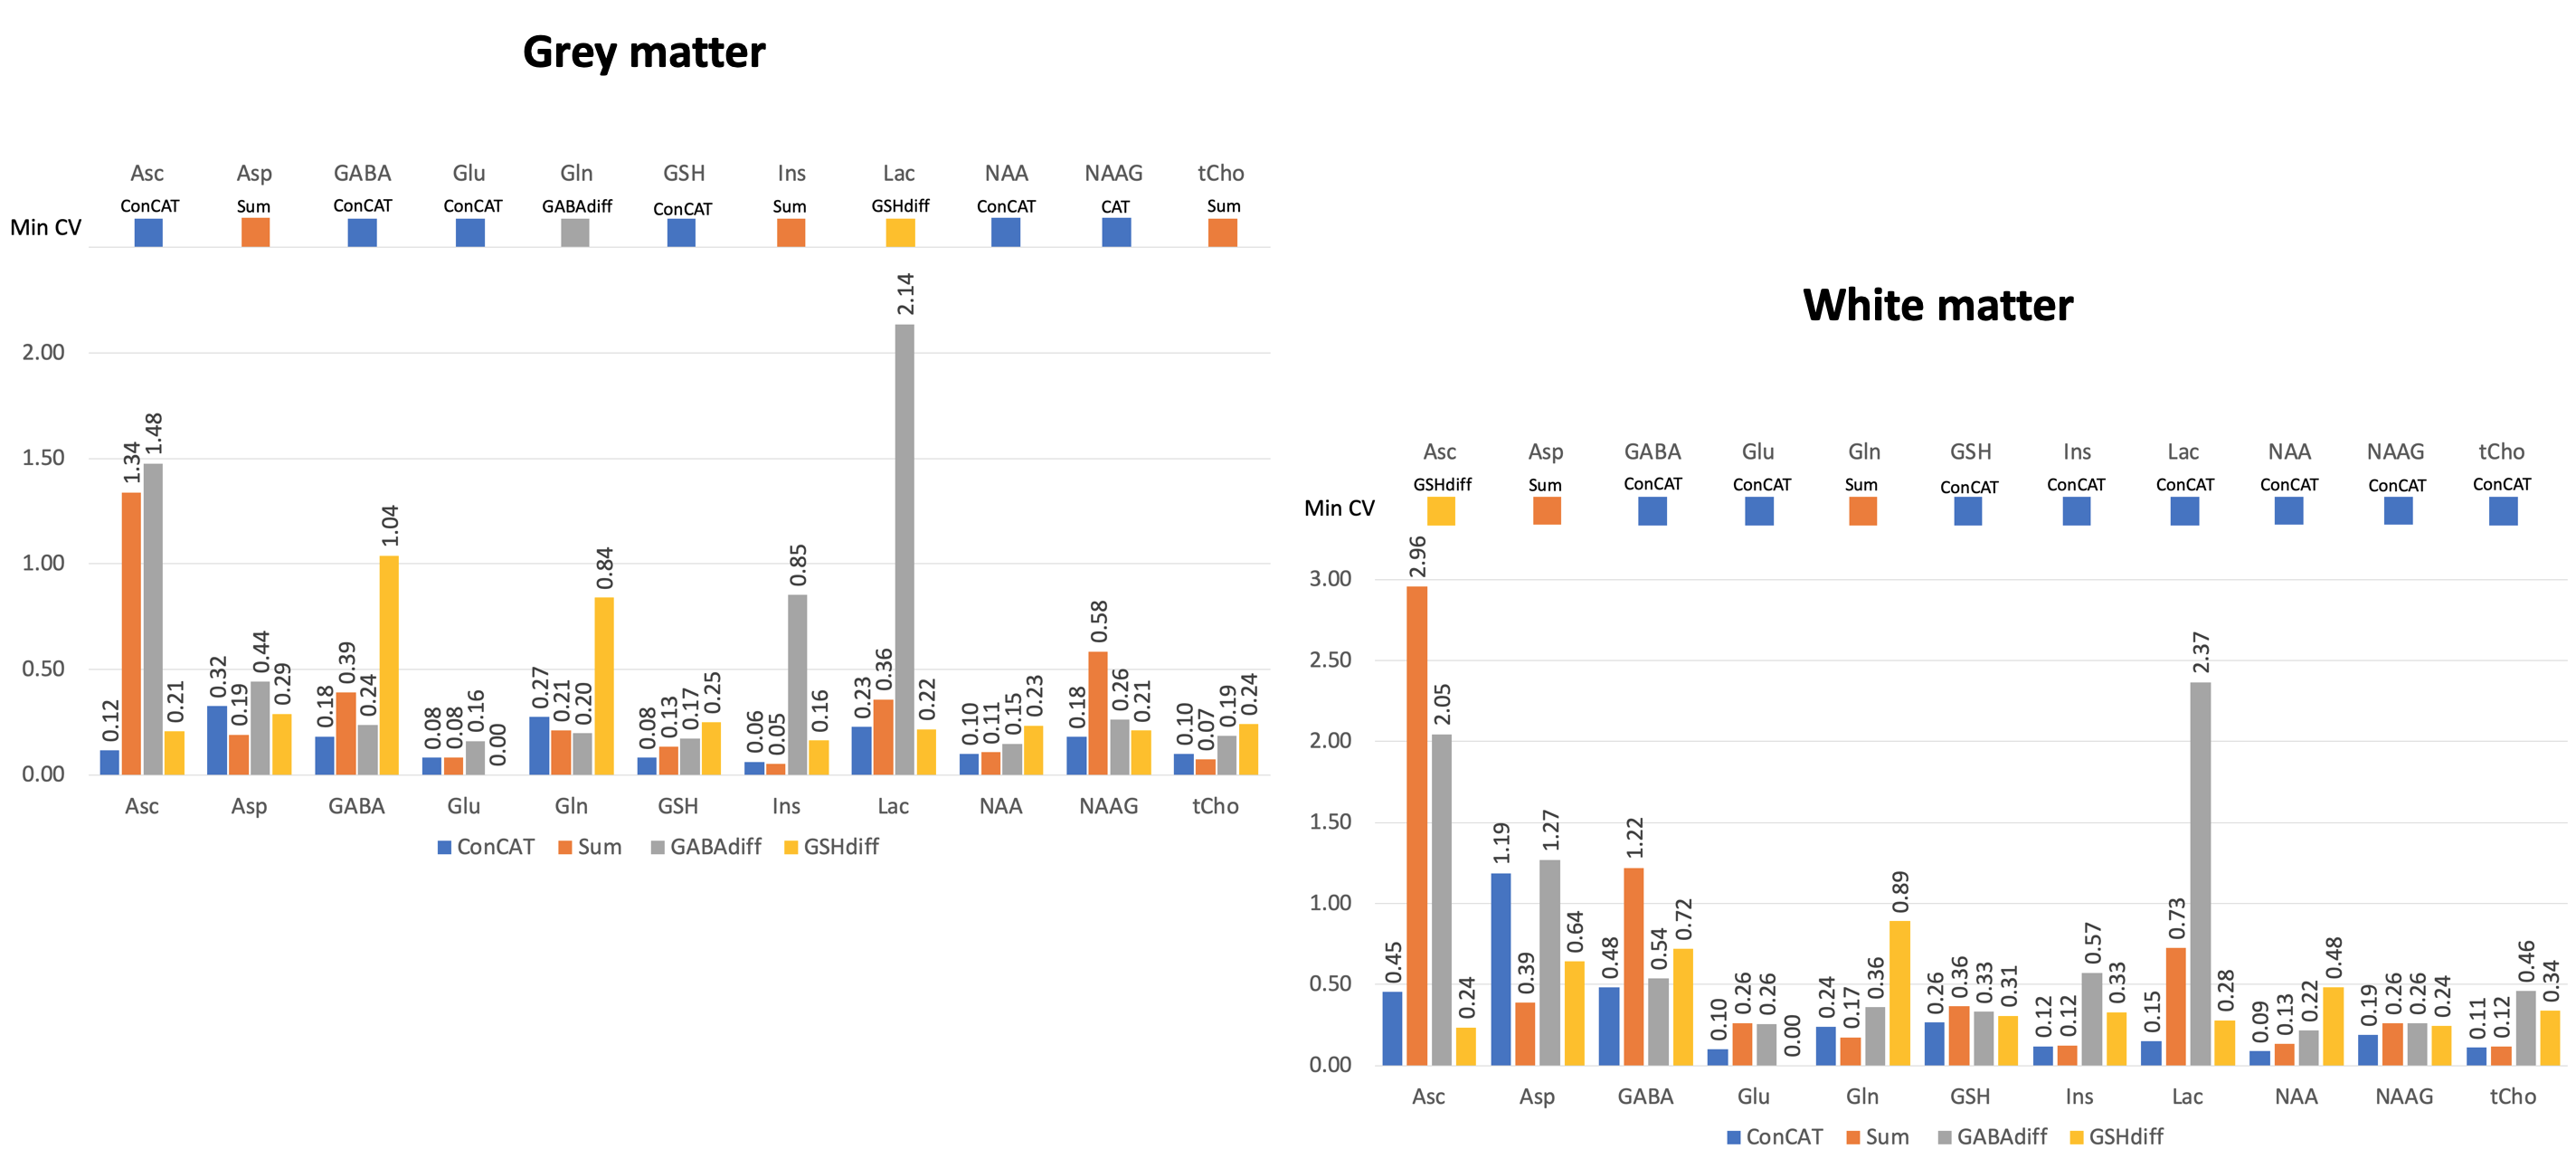
Figure 3 shows the concatenated spectrum and the three individual Hadamard recombined spectra: GABA and GSH difference spectra and the sum spectrum.CVs for each analysis approach are presented in Figure 4 for ascorbate, aspartate, GABA, glutamate, glutamine, GSH, myo-inositol, lactate, NAA, NAAG and total choline. 2-hydroxyglutarate (an oncometabolite) was not included.
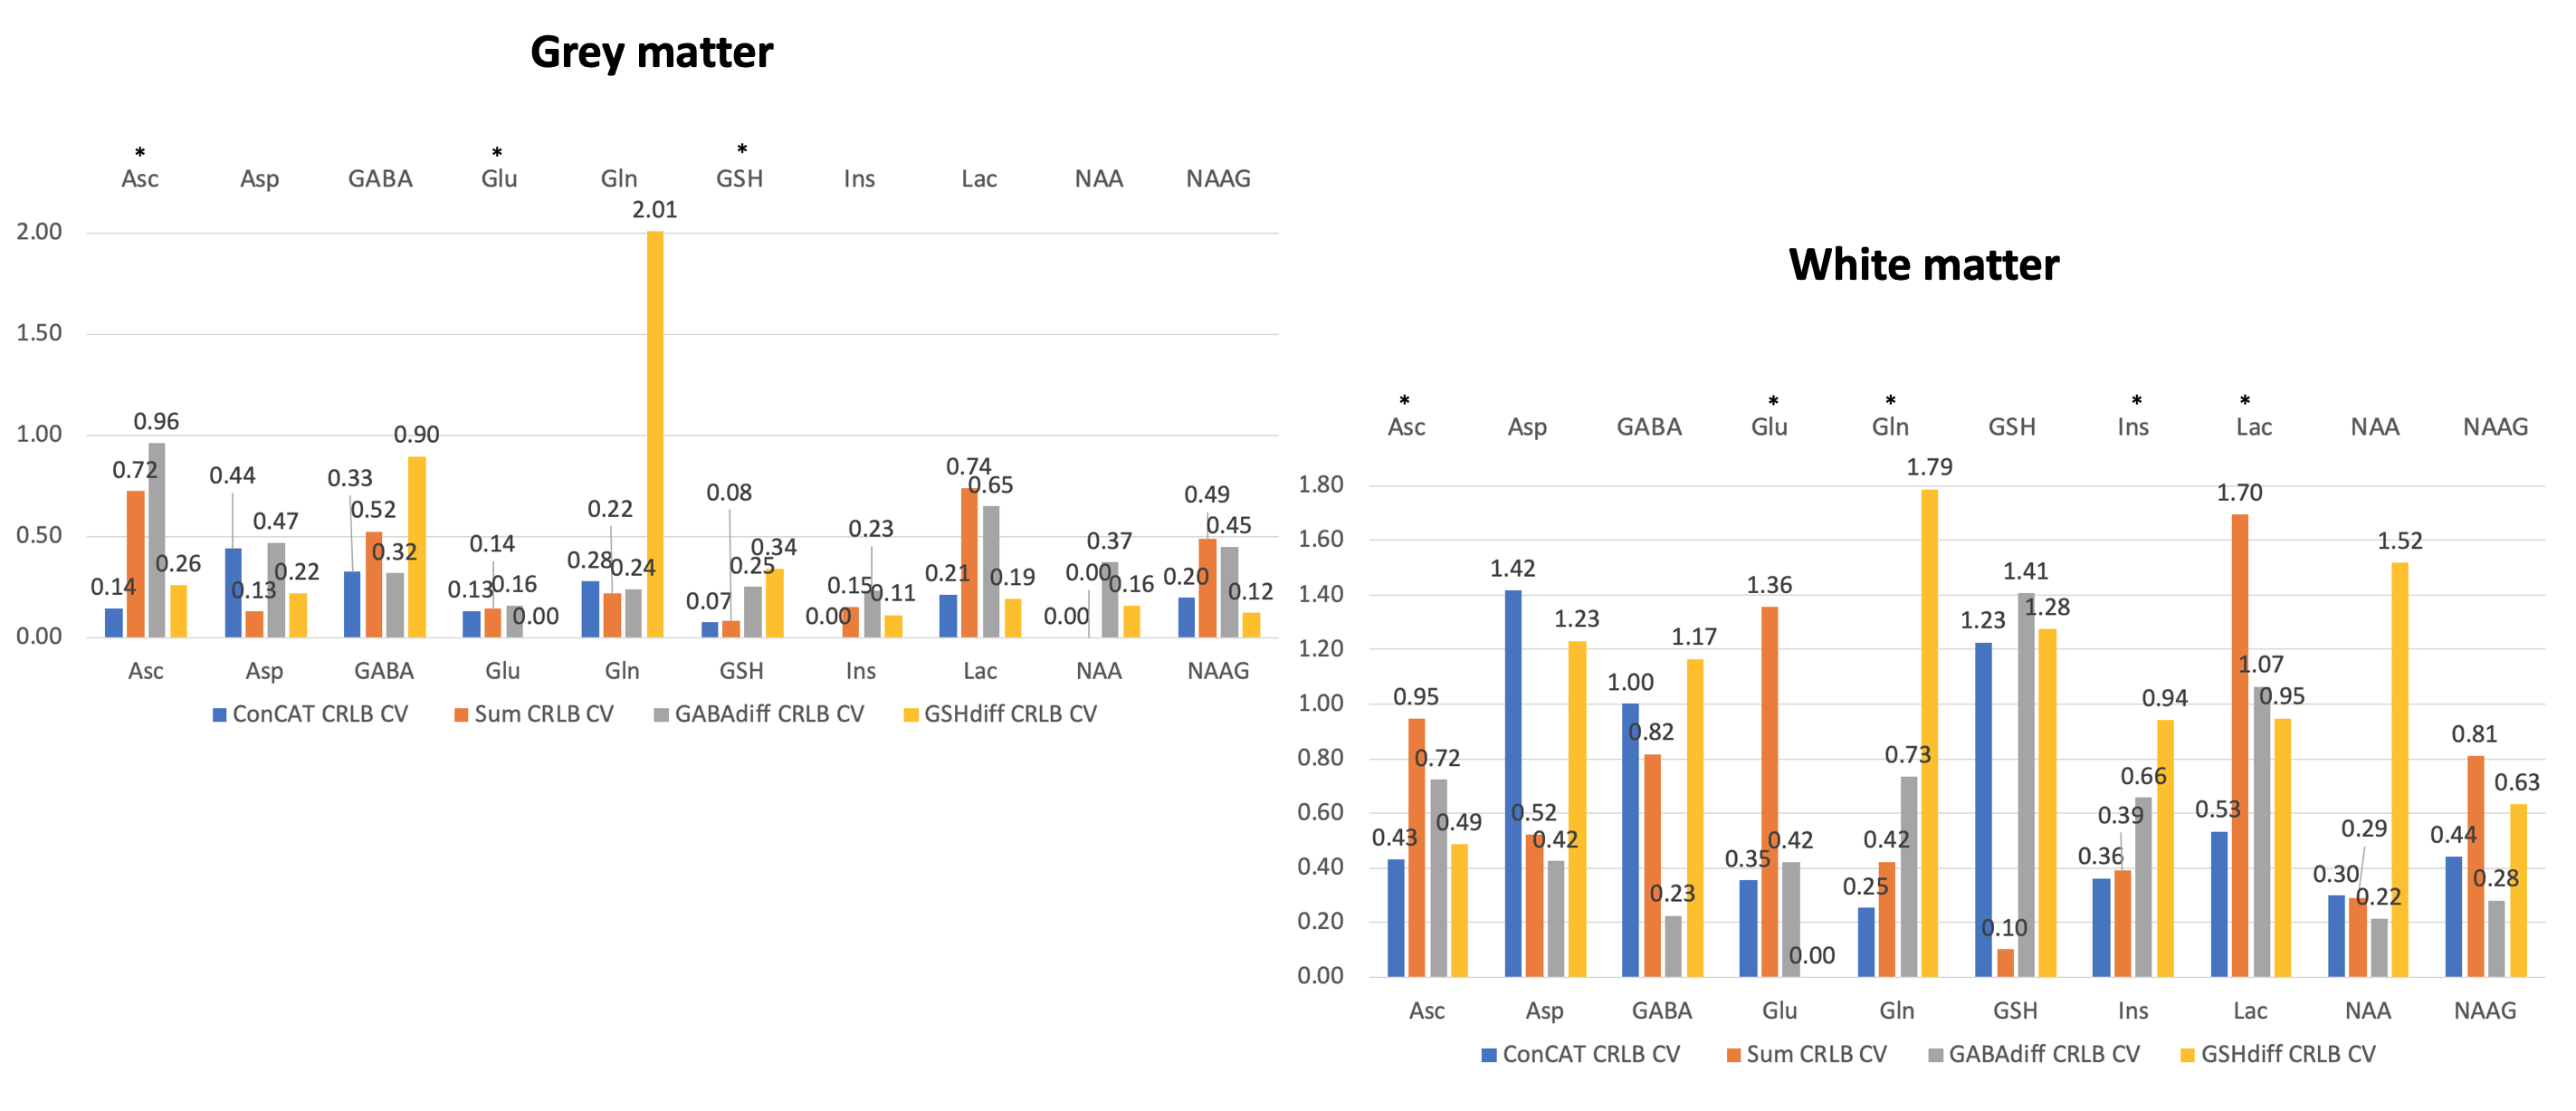
CVs of metabolite CRLBs across all subjects are shown for all fitting approaches in Figure 5.
Discussion
Our approach uses all available spectral information and avoids the use of internal LCModel soft constraints on GABA (used by default to stabilise the model solution for unedited data). The resulting ConCAT concentration estimates relative to tCr and tNAA are in good agreement with literature reported values11.CVs for most of the metabolites relative to tCr and tNAA in the WM voxel were lowest for the ConCAT method, while for the GM voxel only half of the lowest CVs were assigned to ConCAT. This suggests that adding the sum and difference spectra in the quantification of GM metabolites is not adding any additional useful information. A factor that could significantly contribute to these results is the impurity of the GM voxel. Also worth noticing is the appearance of ripples in the ConCAT residuals of NAA suggesting that NAA LCModel quantification needs further optimisation.
CRLB CVs seem to be heterogeneously distributed between the four approaches. Nonetheless, ConCAT was the second-lowest CV for the majority of metabolite CRLBs in both voxels.
Conclusions
An analysis pipeline for simultaneous modelling and fitting of HERCULES spectral data in LCModel was successfully created. Considering our preliminary results, we consider our technique is well-suited to be used with HERCULES data sets. Future investigations will include larger datasets from healthy and diseased participants.Acknowledgements
GO and RAEE received support from NIH grants K99 AG062230, R01 EB016089, R01 EB023963, and R01MH106564.References
1. Bottomley PA, Ann N Y Acad Sci. 1987, 508, 333-348.
2. Mescher M, & Garwood M, NMR Biomed 1998, 11, 266–272.
3. Chan K. et al, Magn Reson Med 2016, 76, 11–19.
4. Oeltzschner G, Neuroimage 2018, 185, 181–190.
5. Provencher S, Magn Reson Med 1993, 30, 672–679.
6. Evans, C.J. & Edden, J Magn Reson Imag 2014, 40, 1445–1452.
7. Wilson M et al., Magn. Reson. Med., 65, 1–12.
8. Naressi A et al., Magn. Reson. Mater. Phys, 12, 141–152.
9. Simpson R et al, Magn Reson Med 2017, 77, 23–33.
10. Near J, Magn Reson med 2014, 73, 44-50
11.Govindaraju V et al., NMR Biomed. 2000,13, 129–153
Figures