0364
Diffusion-weighted MRS at short TE using a Connectom system: non-Gaussian metabolite diffusion and macromolecular signals in human brain1Department of Radiology and Biomedical Research, University of Bern, Bern, Switzerland, 2Max-Planck Institute For Human Cognitive and Brain Sciences, Leipzig, Germany
Synopsis
Diffusion-weighted MRS was successfully implemented on a 3T Connectom system reaching b-values of 25 ms/um2 at a short TE of 30 ms and a moderate TM of 65 ms. Motion-compensation based on the water peak was found feasible up to the highest b-value and can be supplemented by scaling to the macromolecule peak intensity at 0.9 ppm. Non-Gaussian diffusion behavior was detected for multiple metabolites and was modeled with biexponential and kurtosis representations. In addition, a macromolecular spectrum could be determined by diffusion weighting and simultaneous modeling, which can now be used for quantification in clinical short TE MRS.
Introduction
Diffusion-weighted MRS (DW-MRS) has become of prime interest as a tool to explore brain microstructure given the exclusive intracellular and partly celltype-specific location of metabolites. Besides, it may also prove to be of diagnostic value. However, on clinical systems, DW-MRS is severely limited by the available gradient strength, and in general by motion-related signal loss at high b-values. DW-MRS needs larger gradient power than DW-MRI because A) metabolites diffuse substantially slower than water and B) short TE is beneficial for MRS for multiple reasons: i) MRS has low inherent SNR and can't afford T2-related signal loss; ii) many metabolites lose additional SNR at long TE due to J-coupling-related dephasing; iii) macromolecular (MM) signals (short T2) can be used for motion-correction only at short TE. Two further reasons for high DW are: C) evaluation of non-Gaussian diffusion at high b-values is valuable to extract microstructural features1 and D) very high DW enables determination of the MM signal relevant for quantification of clinical MR spectra based on diffusion rather than relaxation characteristics2,3.Here, we explore the potential of the Connectom gradients for the use in short-TE MRS (<~30ms) of human brain with these aims: 1st investigate feasible acquisition conditions given the limits of the gradients and peripheral nerve stimulation (PNS). 2nd evaluate the applicability of water-signal-based motion-compensation (MoCom) and the need for ECG triggering at ultra-high gradient amplitudes. 3rd explore metabolite diffusion with short-TE STEAM for b-values up to 25 ms/$$$\mu$$$m2 in comparison to rodent data2. 4th probe the feasibility to determine the MM spectrum needed for clinical MRS based on high diffusion-weighting and simultaneous fitting3,4.
Methods
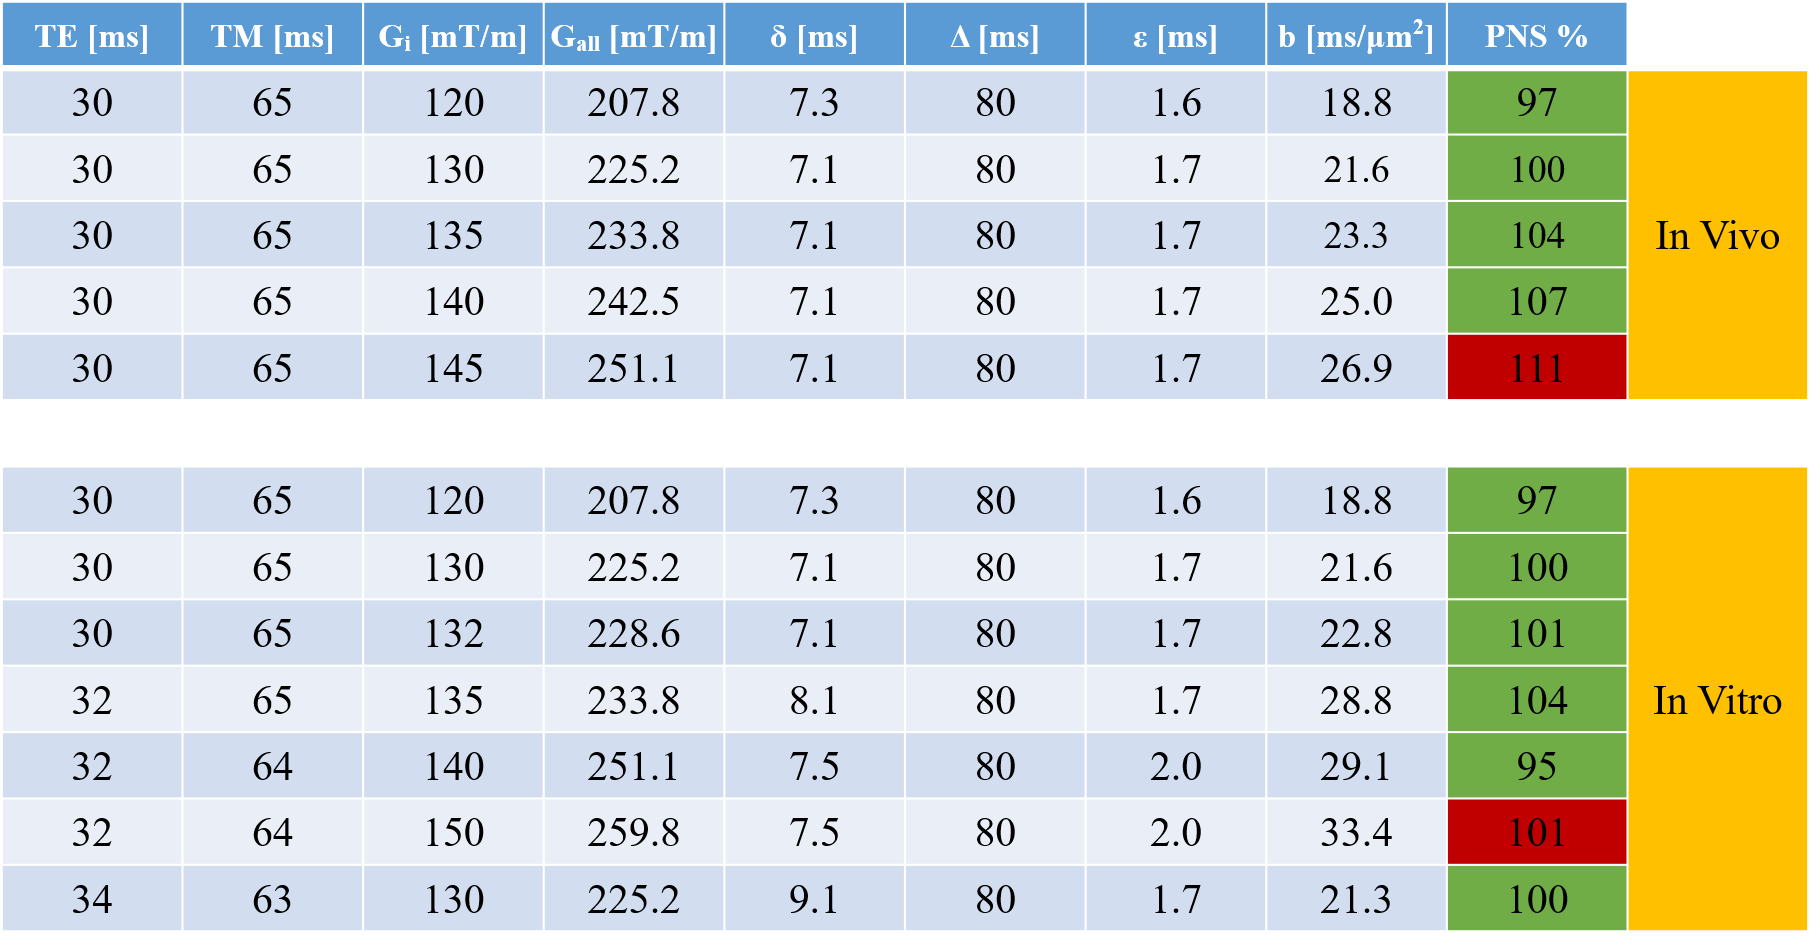
Acquisition: Siemens 3T Connectom system (300 mT/m maximum gradient strength); 32-channel headcoil. DW spectra acquired with the metabolite-cycling STEAM localization sequence described in Ref.5 using peripheral pulse triggering at TRs of 3-4 cardiac cycles (effective TRs recorded for T1-saturation correction) at relatively short TE (30 ms) and TM (35 or 65 ms, leading to diffusion times $$$\Delta$$$ of 50 or 80 ms, respectively). Diffusion gradients were applied simultaneously along all 3 axes. Maximum gradient strengths for specific acquisition conditions ($$$\Delta$$$: gradient spacing, $$$\delta$$$: gradient duration, $$$\epsilon$$$: ramptime) that are not limited by PNS were probed in phantoms and confirmed in humans Fig 1. In vivo data from occipito-parietal cortex of 6 human subjects (VOI size 13-30 cm3) is presented.Data processing and fitting: Spectra processed in jmrui6, matlab and python. The co-acquired water signal was used for eddy-current, frequency and phase referencing and MoCom5. A TR correction for water was applied to maintain proper MoCom also with varying TR. Aligned datasets were averaged over all subjects to determine the MM spectrum with high SNR. Simultaneous fitting of all b-values was performed in FiTAID4 restricting spectral parameters and enforcing a mono-exponential decay for MM signals (and some metabolites with small signal contributions) but not the major metabolites. Mono-exponential, bi- exponential and kurtosis signal decay models were used to fit the diffusion behavior of metabolites and water.
Results & Discussion
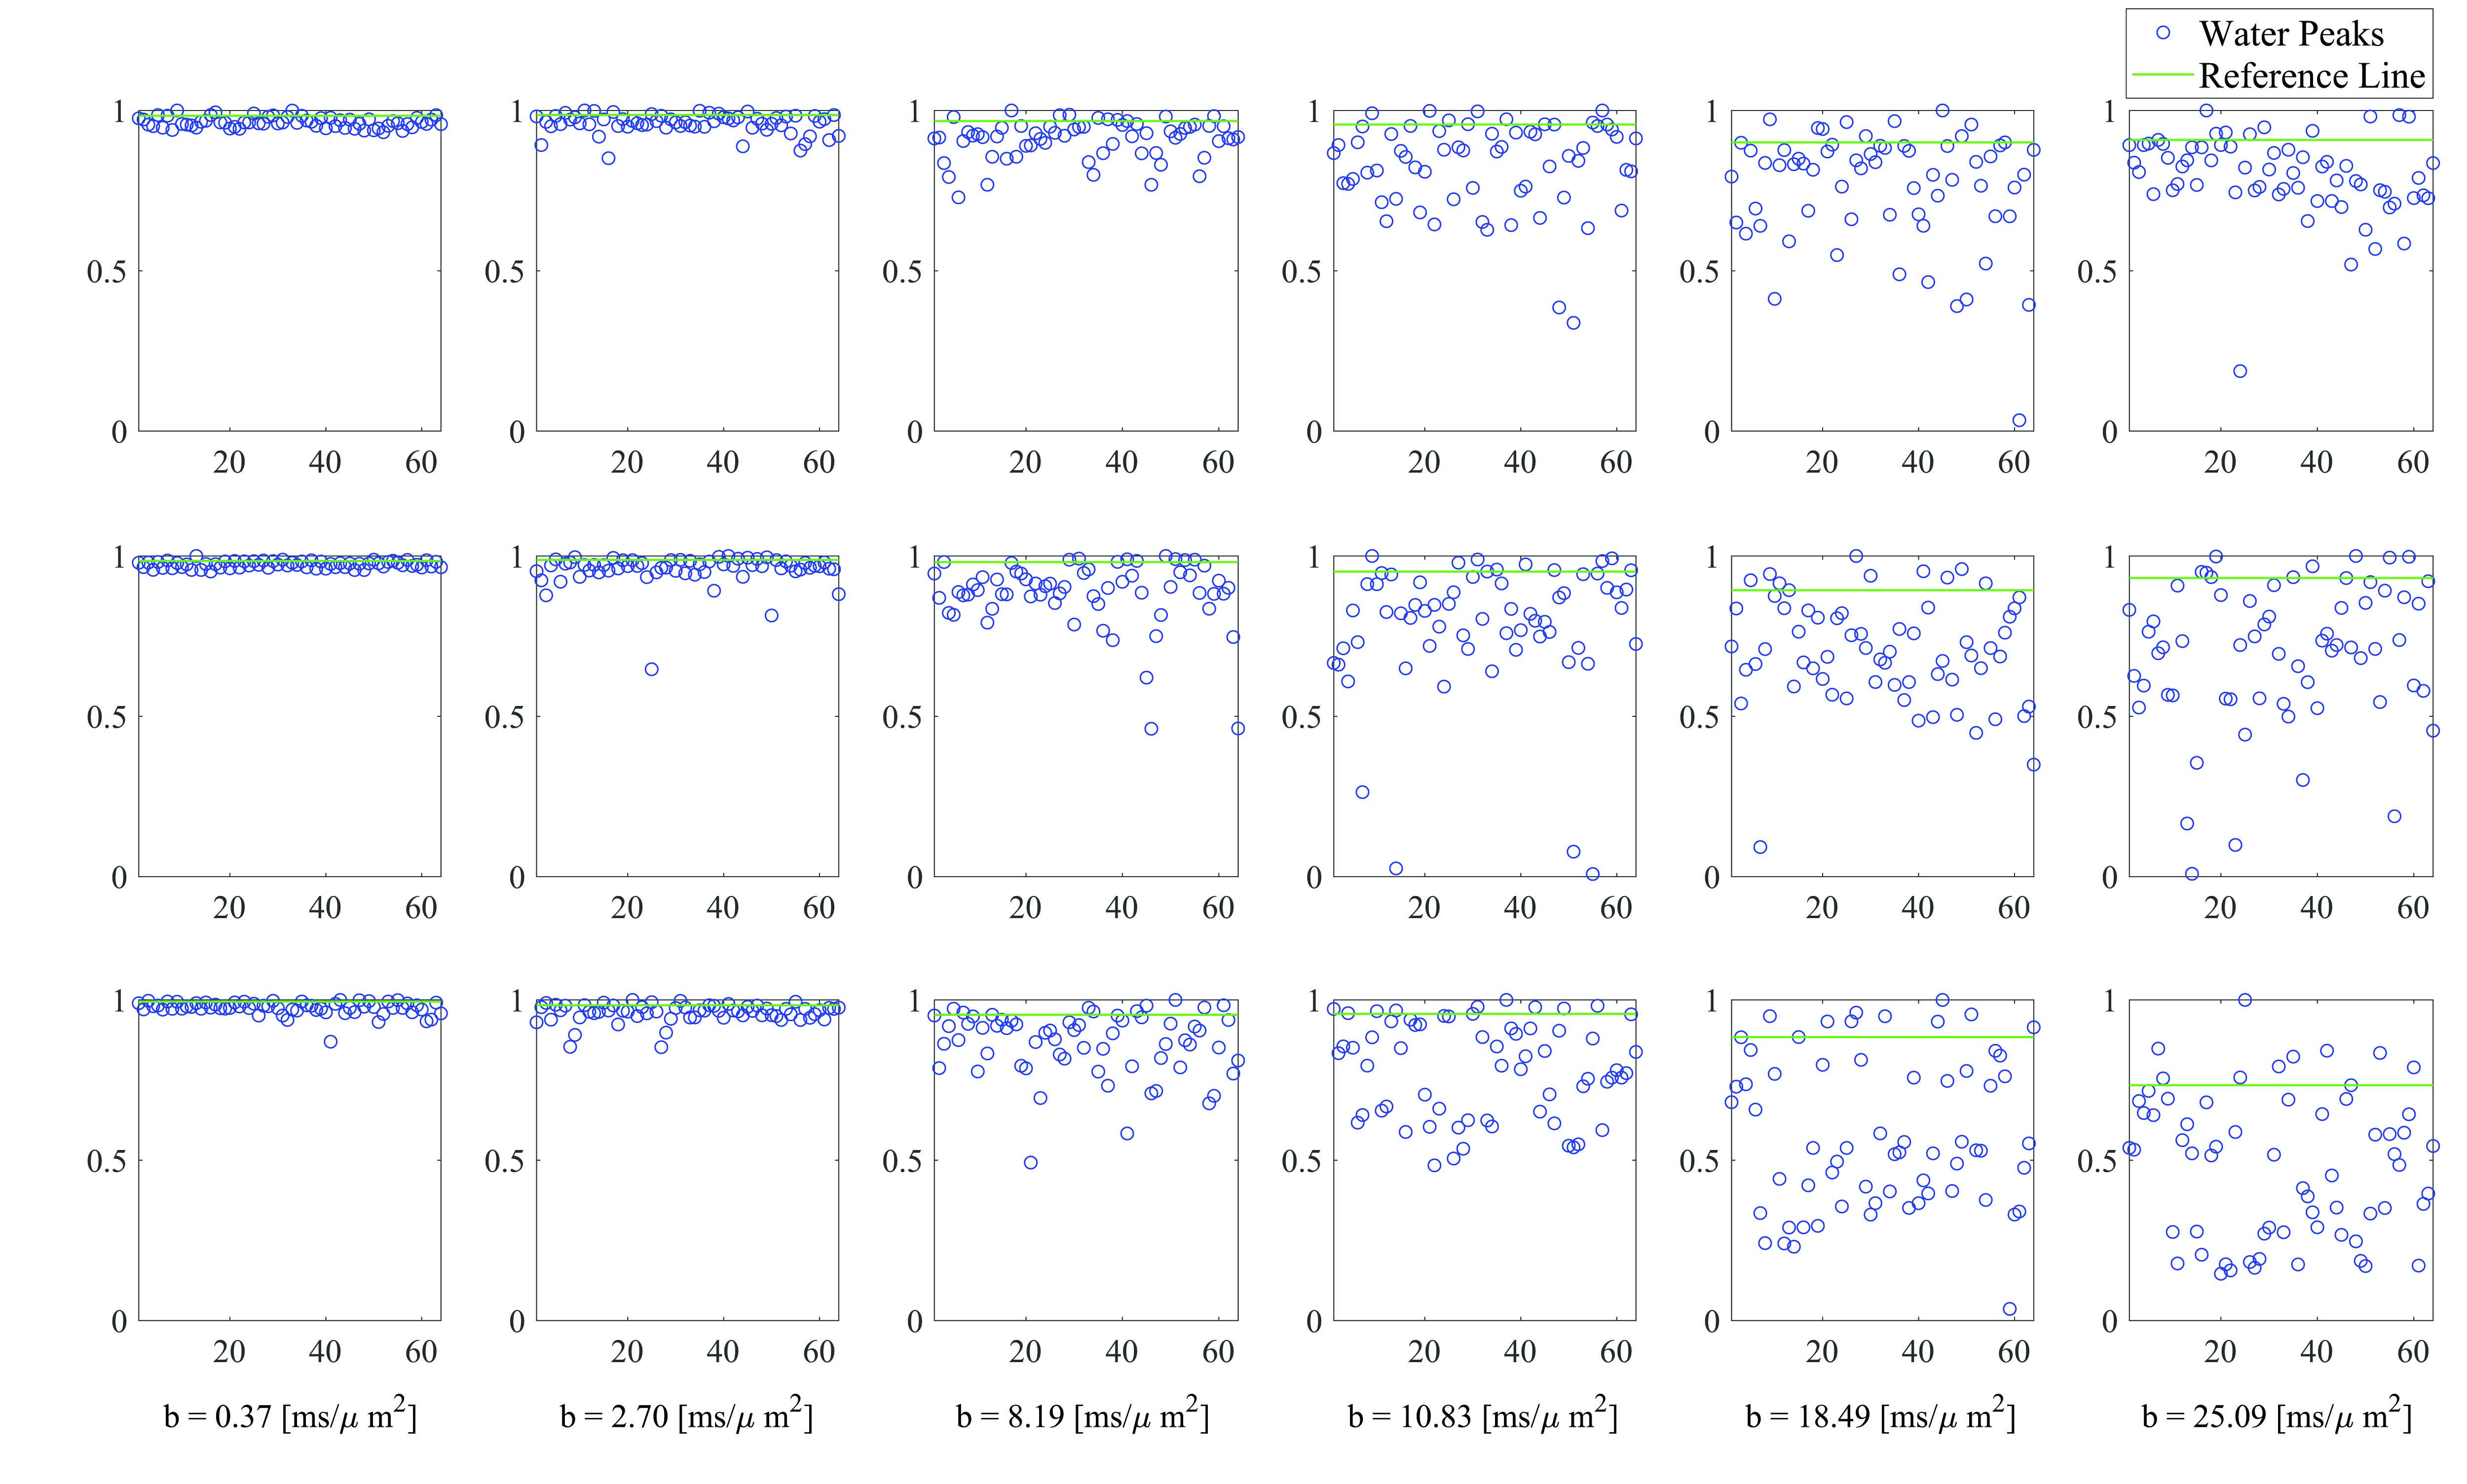
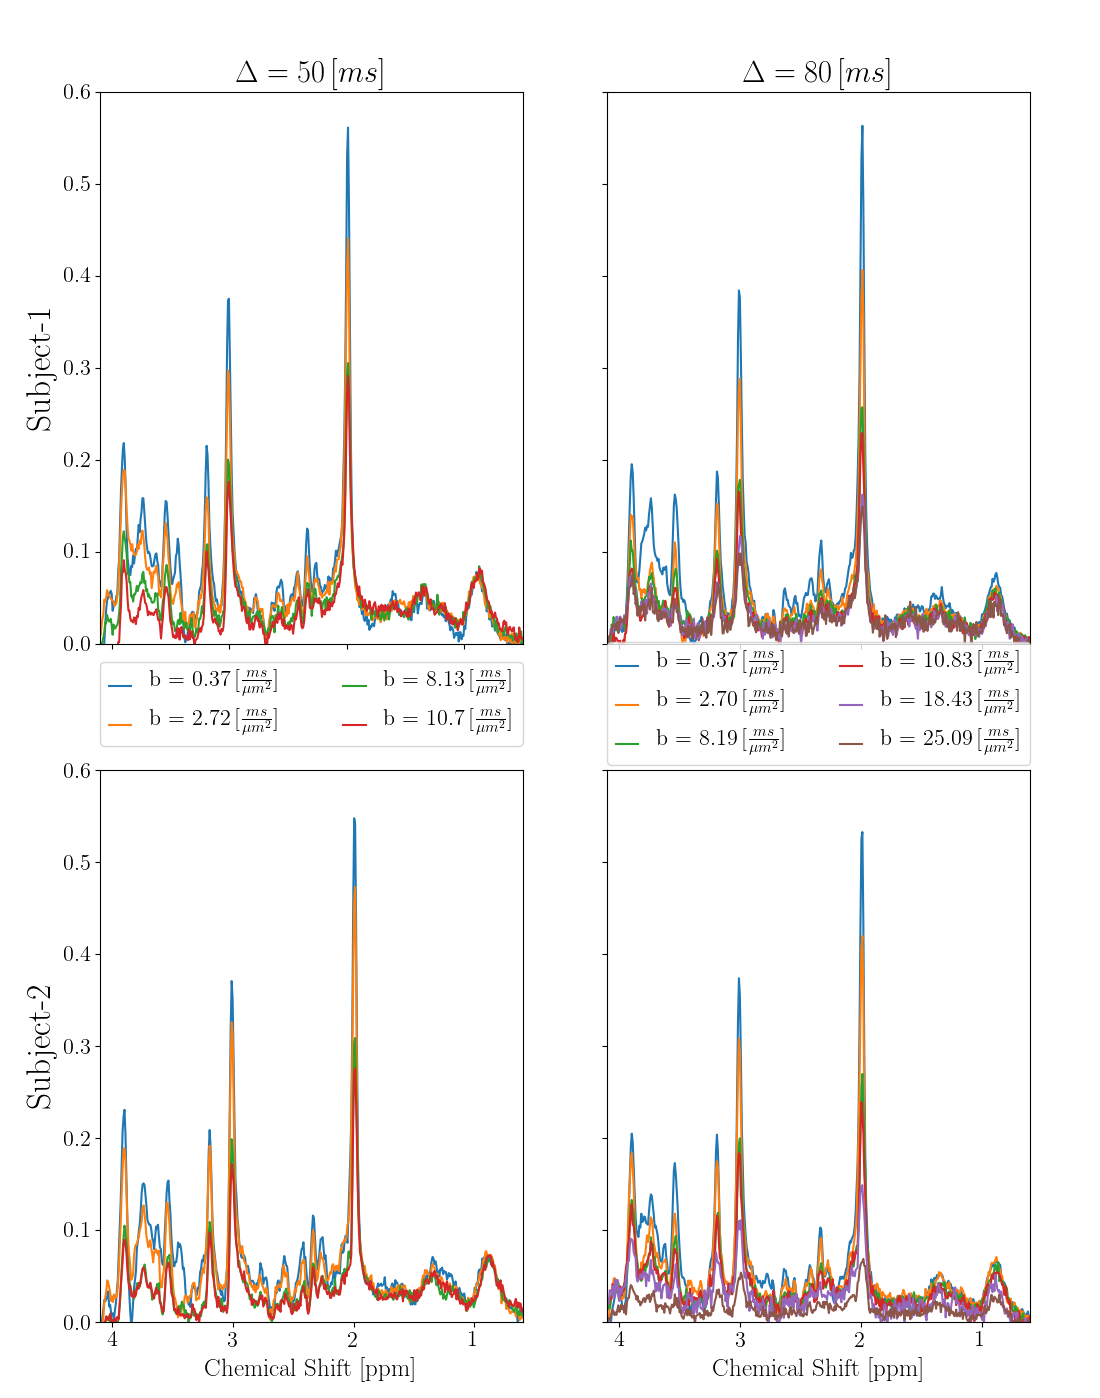
In vitro and in vivo testing clearly showed that with this sequence the reachable b-value range on the Connectom system is limited by PNS, not gradient strength. Determined maximum allowed b-values for short TE are listed in Fig 1. Fig 2 presents water intensity data from single acquisitions as function of acquisition parameters that were used to judge whether the MoCom scheme could be based on valid undistorted amplitude data, where a substantial fraction of all acquisitions should define the level of the non-distorted reference amplitude. This was judged feasible in almost all cases (for one exception, as judged from the MM peak intensity at 0.9 ppm, see Fig 3).Fig 3 illustrates the spectral quality achieved by sample spectra recorded at b-values between 0.37 and 25 ms/$$$\mu$$$m2. In subject 1 the MM peak at 0.9 ppm shows very little signal decay (probably true diffusion), while for subject 2 it includes motion-related signal loss for highest b-values.
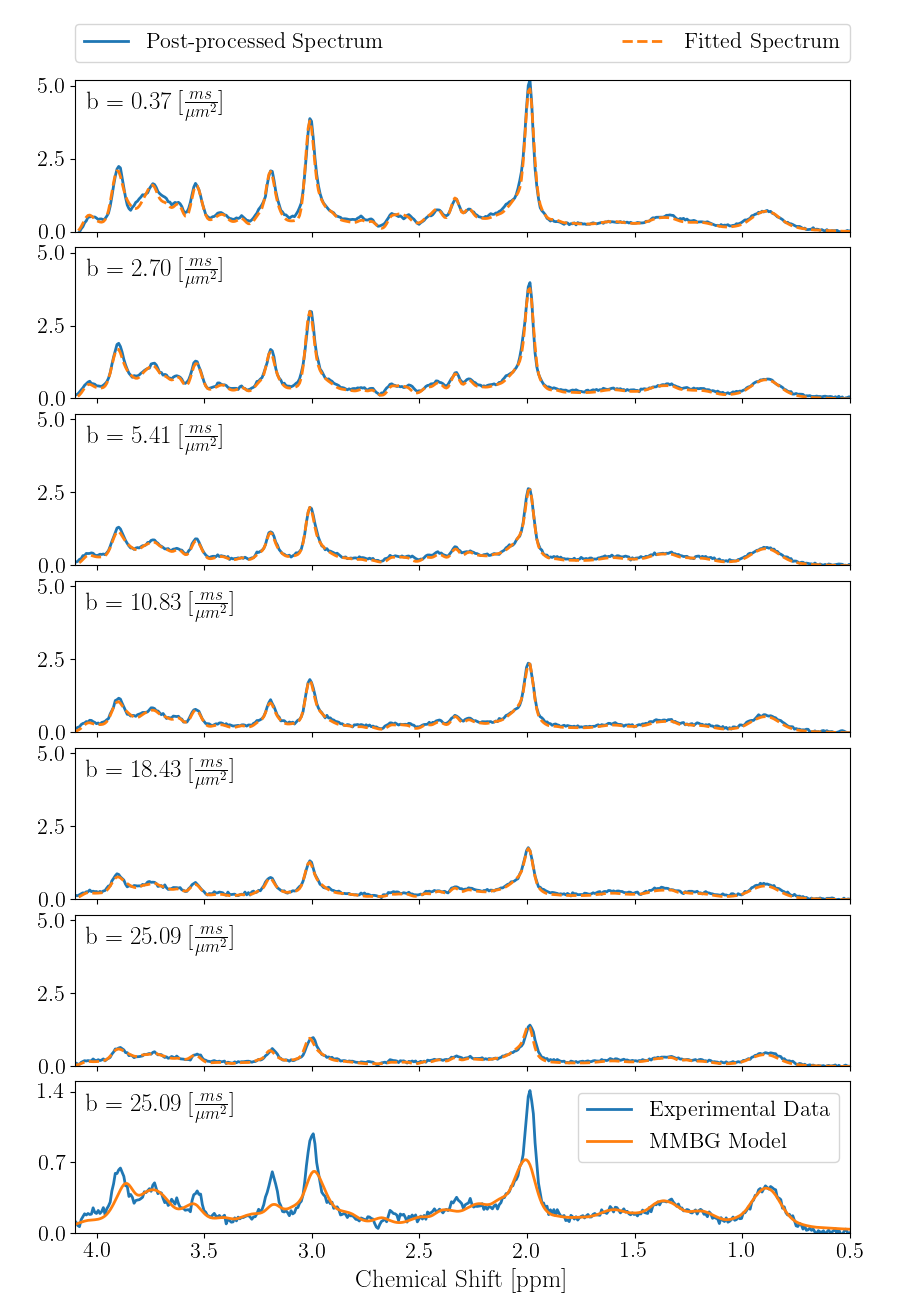
Fig 4 includes the cohort averaged spectra and documents the good spectral fits. Furthermore, the MM spectrum resulting from the mono-exponential decay model is shown, also illustrating how much metabolite signal is left at the highest b-value.
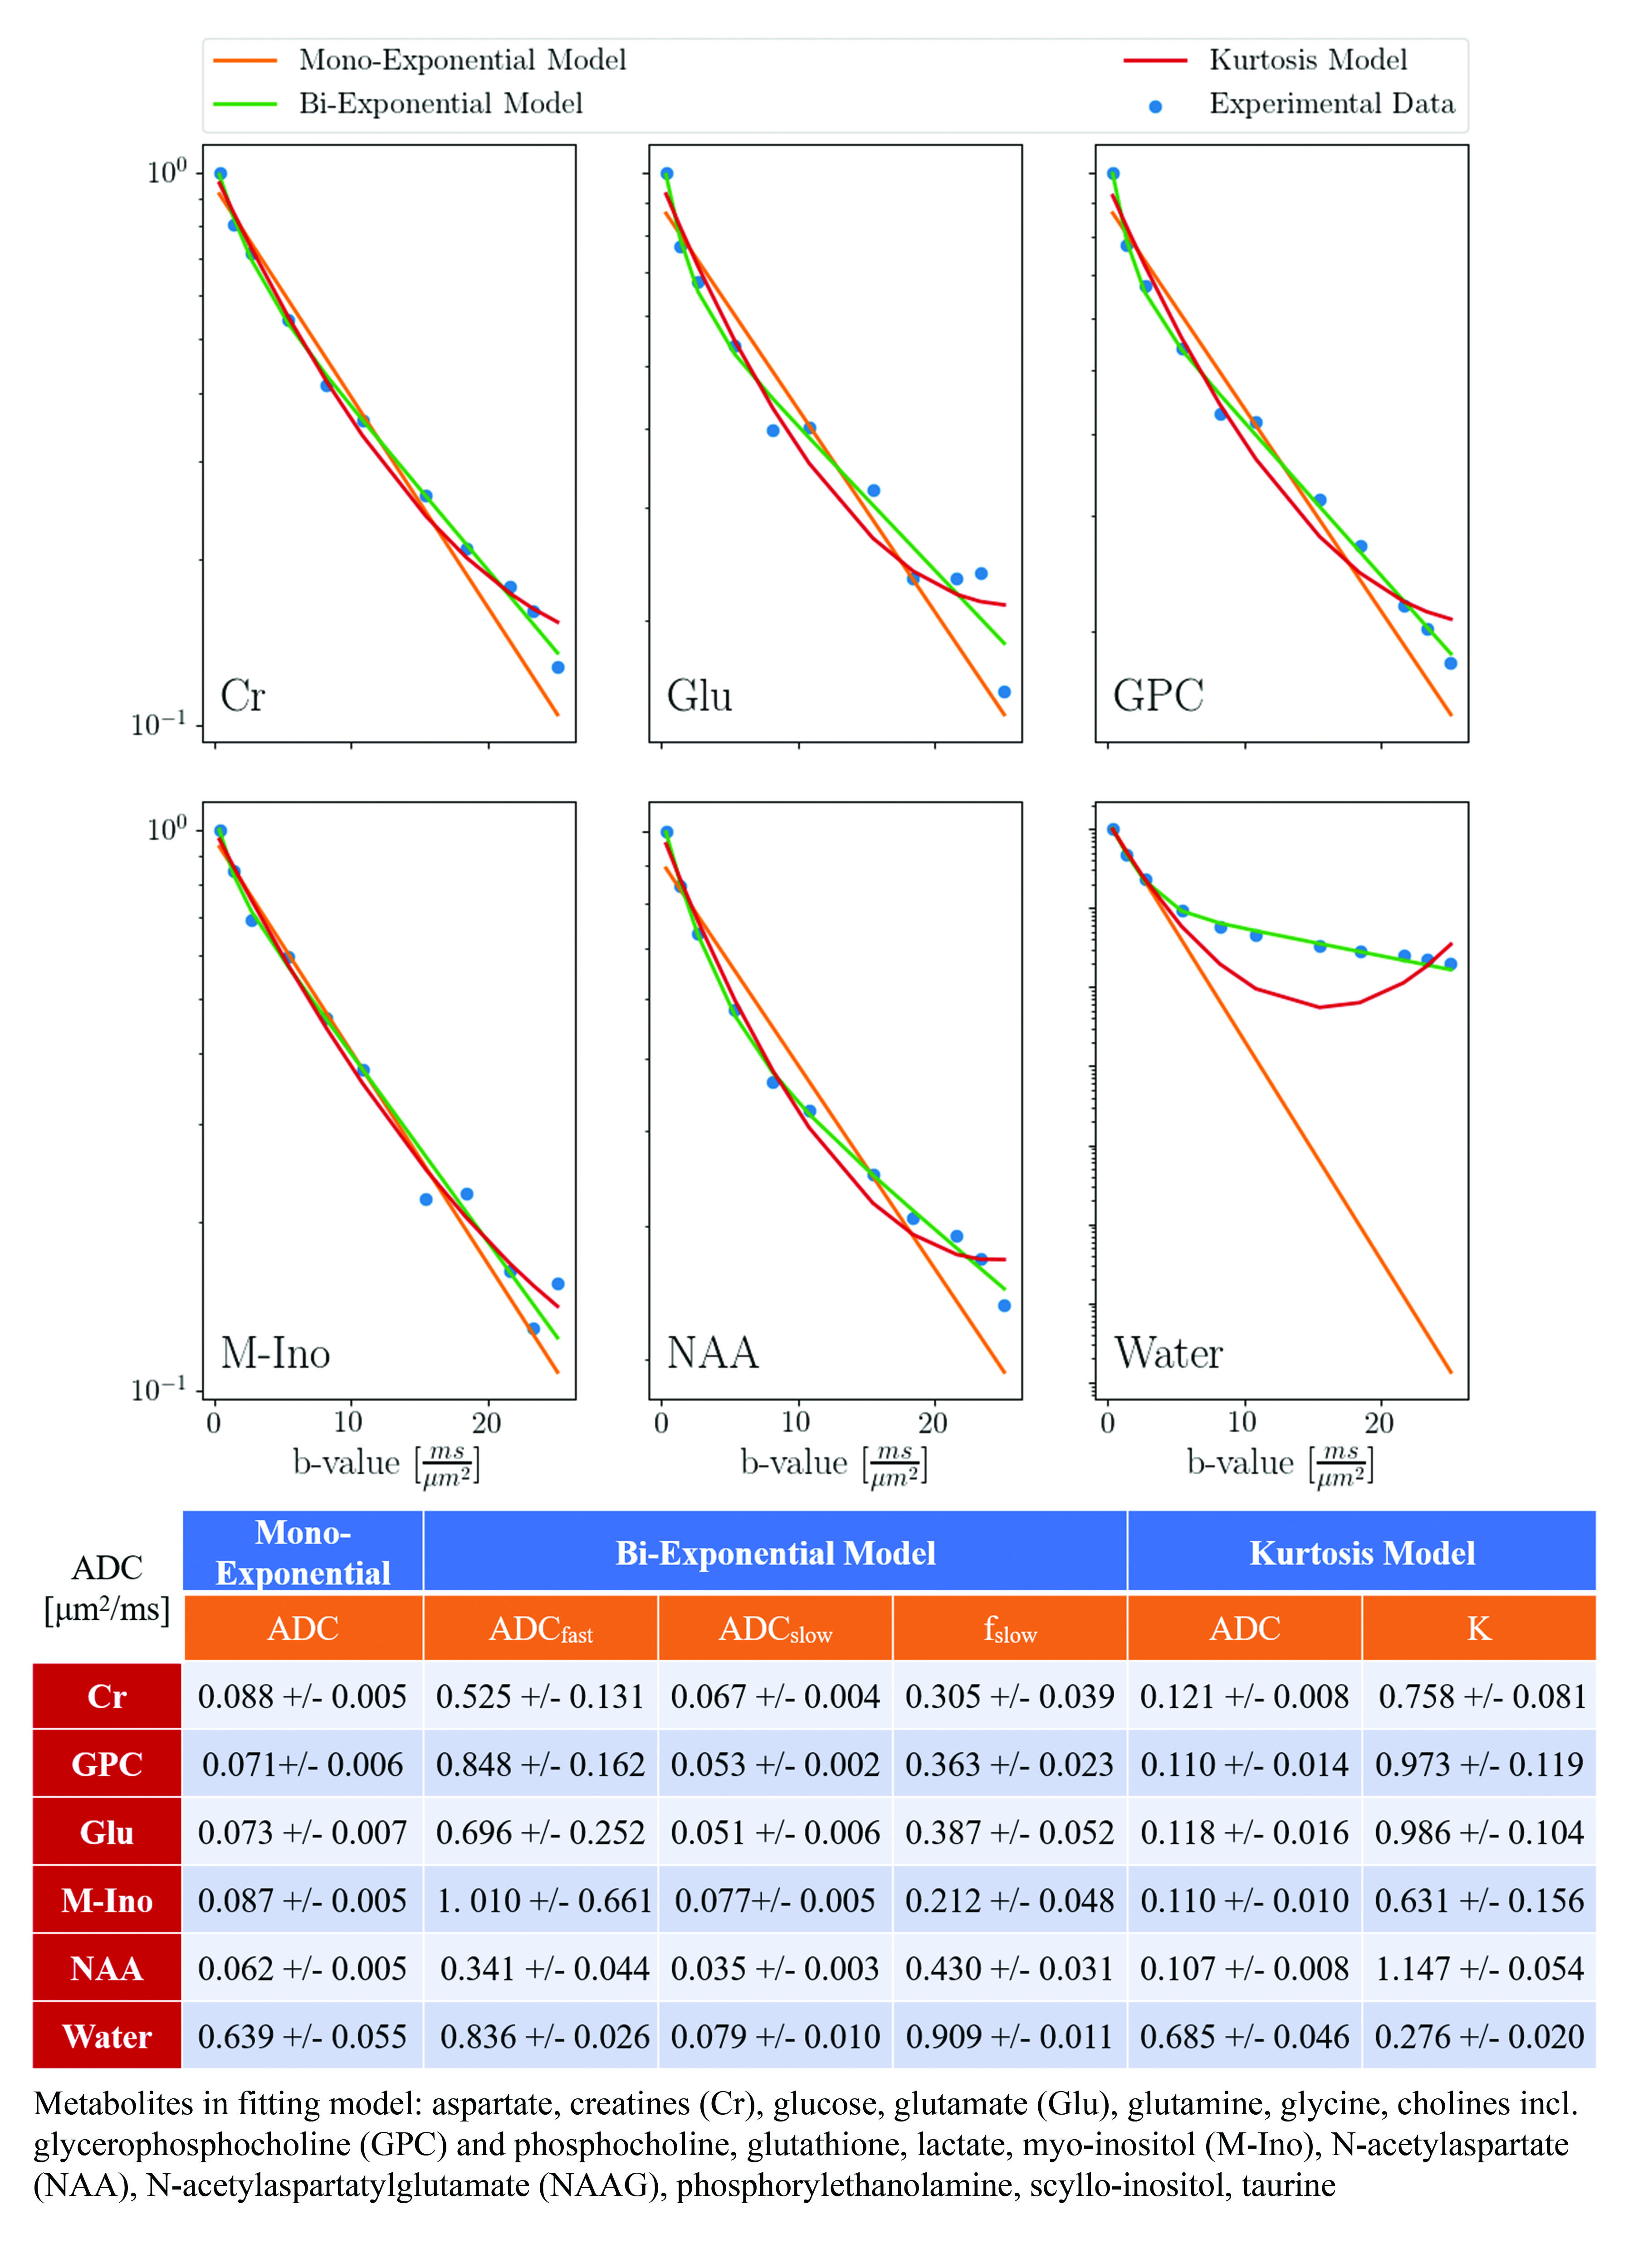
Finally, Fig 5 contains the diffusion decays for some of the fitted metabolites and water where it becomes very clear that metabolite diffusion decay is not mono-exponential for most metabolites but can be described well by bi-exponential modeling or a kurtosis representation with preliminary fitted parameters tabulated in the same Figure.
Conclusion
- DW MRS was successfully implemented on a 3T Connectom system reaching b-values of 25 ms/$$$\mu$$$m2 at a short TE of 30 ms and a moderate TM of 65 ms.
- MoCom was mostly successful even at the largest b-values, but can be supplemented by scaling to the MM peak intensity at 0.9 ppm. ·
- Non-Gaussian diffusion behavior for multiple metabolites was detected in overall agreement with rodent2 and long TE human7 data. It was modeled with bi-exponential and kurtosis representations. ·
- A MM spectrum can be determined by diffusion weighting and simultaneous modeling. It can be used for quantification in clinical short TE MRS, but will need further investigation to exclude metabolite contributions from diffusion-hindered metabolites.
Acknowledgements
This work is supported by the Swiss National Science Foundation (SNSF #320030‐175984).References
1. Palombo, M., Shemesh, N., Ronen, I. & Valette, J. Insights into brain microstructure from in vivo DW-MRS. Neuroimage 182, 97–116 (2018).
2. Ligneul, C., Palombo, M. & Valette, J. Metabolite Diffusion up to Very High b in the Mouse Brain In Vivo : Revisiting the Potential Correlation Between Relaxation and Diffusion Properties Cl. Magn. Reson. Med. 77, 1390–1398 (2017). DOI: 10.1002/mrm.26217
3. Döring, A., Adalid, V., Boesch, C. & Kreis, R. On the exploitation of slow macromolecular diffusion for baseline estimation in MR spectroscopy using 2D simultaneous fitting. ISMRM (2018). #1315
4. Adalid, V., Döring, A. & Kyathanahally, S. P. Fitting interrelated datasets : metabolite diffusion and general lineshapes. Magn Reson Mater Phy 30, 429–448 (2017). DOI:10.1007/s10334-017-0618-z
5. Döring, A., Adalid, V., Boesch, C. & Kreis, R. Diffusion-weighted magnetic resonance spectroscopy boosted by simultaneously acquired water reference signals. Magn Reson Med. 2018; 80, 2326-2338 doi:10.1002/mrm.27222
6. Stefan, D., Cesare, F. Di, Andrasescu, A., Popa, E. & Lazariev, A. Quantitation of magnetic resonance spectroscopy signals : the jMRUI software. Meas. Sci. Technol. 20,104035 (2009). doi:10.1088/0957-0233/20/10/104035
7. Ingo, C., Brink, W., Ercan, E.,
Webb, A. G. & Ronen, I. Studying neurons and glia non-invasively via
anomalous subdiffusion of intracellular metabolites. Brain Struct. Funct.
223, 3841–3854 (2018).
8. Hebrank, F. X. & Gebhardt, M. SAFE-Model - A New Method for Predicting Peripheral Nerve Stimulations in MRI. ISMRM (2000).
9. Szczepankiewicz, F., Westin, C. & Nilsson, M. Maxwell-compensated design of asymmetric gradient waveforms for tensor-valued diffusion encoding. Magn. Reson. Med. 82, 1424–1437 (2019). https://doi.org/10.1002/mrm.27828
Figures