0360
Sub-regional Quantification of Tissue-Specific Hydration State in Patellar Tendinopathy with 3D Ultrashort Echo Time MRI1Radiology & Nuclear Medicine, Erasmus University Medical Center, Rotterdam, Netherlands, 2Orthopedics & Sports Medicine, Erasmus University Medical Center, Rotterdam, Netherlands
Synopsis
Patellar tendinopathy (PT) is an overuse injury of the patellar tendon in athletes, often resulting from jumping activities such as playing basketball or volleyball. MR imaging with ultrashort echo times (3D-UTE MRI) is used to image the typical degenerative process of the proximal patellar tendon in PT. However, image analysis can be challenging within the heterogeneous patellar tendon affected by tendinopathy. Therefore, we propose a novel method for image analysis, in which voxels are sub-selected based on a parameter from bi-exponential fitting. This resulted in the identification of T2* biomarkers, specific for distinct tissue-compartments within the patellar tendon.
INTRODUCTION
Patellar tendinopathy is a painful activity-related injury of the patellar tendon, frequently occurring in jumping athletes, such as basketball and volleyball players. (1) Regional differences in tendon morphology and composition of the extracellular matrix in patellar tendinopathy results in local differences regarding the patellar tendon hydration state. (2) Routine MRI of the patellar tendon is limited by the fast free induction decay of the highly organized collagen in tendon, resulting from strong spin-spin interactions. (3) Ultra-short echo time (UTE) MRI enables voxel-wise quantification of signal from tissues with short T2*.(4) Quantitative analysis of these images is typically performed by using relatively large regions of interest, covering the outer margins of the patellar tendon. (5,6) However, this may compromise the precision to detect subtle changes over time, due to the heterogeneity of the patellar tendon and the uneven distribution of degenerative changes associated with tendinopathy. (7) Therefore, we aimed to compare a conventional method for quantitative image analysis in patellar tendinopathy with a novel sub-regional approach, in order to identify specific diagnostic T2* biomarkers.METHODS
MRI was performed on the symptomatic knee of jumping athletes, aged 18-35 years, with clinically diagnosed patellar tendinopathy. Imaging was performed on a 3.0T system (GE Discovery MR750), using a 16 channel flexible surface coil (NeoCoil). Four 3D-UTE multi-echo acquisitions with 16 echoes in interleaved order were acquired in the axial oblique plane, perpendicular to the patellar tendon. Prior to T2* fitting, rigid and elastic image registration were performed to correct for motion (Elastix). (8) After image registration, T2* maps were generated using mono- and bi-exponential fitting and fractional order fitting methods. Fractional order fitting, using a fractional order extension of the Bloch equation, has been proposed to improve characterization of heterogeneous tissues. (9) Masks delineating the outer margins of the patellar tendon were drawn on 10 consecutive slices starting from the inferior patellar border. Image analysis was performed using two different methods. The first method included all voxels in the mask covering the proximal patellar tendon. With the second method, voxels within the mask were sub-selected, based on the percentage of short T2* components resulting from the bi-exponential model. For this, we used thresholds (0-30% for long T2*, 30-60% for mixed T2* and 60-100% for (ultra)short T2*) to calculate median T2* values per subject. Mean T2* values were calculated over all subjects. RMSD between scans on subsequent days was calculated in one patient to assess repeatability.RESULTS
In total, 50 athletes with patellar tendinopathy (36 men; mean age 24.5 years ± 3.9) were included. Figure 1 illustrates the T2* maps generated with mono-, bi-exponential and fractional order fitting and the results of the voxel sub-selection method. Using all voxels within the mask, T2* (mean ±SD) was 6.1ms ±2.5 according to mono-exponential fitting and 4.5ms ±2.0 according to fractional order fitting. The overall percentage of short T2* components was 53.6% ±20.0. Sub-regional T2* quantification resulted in a mean of 3.1ms ±0.9 (mono-exponential) and 2.2ms ±0.7 (fractional order) for the voxels selected based on 60-100% short T2* components. The voxels selected based on 0-30% short T2* resulted in a mean T2* of 12.5ms ±2.7 (mono-exponential) and 10.6 ±2.6 (fractional order). Sub-selected voxels consistently corresponded visually to distinct tissue compartments within the patellar tendon in patellar tendinopathy; collagen was represented by voxels selected with 60-100% short T2* and degenerative tissue was represented by voxels selected with 0-30% short T2*. RMSD of mono-exponential T2* ranged from 1.11-2.42ms in one subject.DISCUSSION
Patellar tendinopathy represents a heterogenic condition of the proximal patellar tendon, where collagen is characterized mostly by ultrashort T2* and degenerative tissue by mostly long T2* components. We found that our novel sub-regional analysis approach provides specific T2* quantification in these distinct tissue compartments. The voxels within the mask that delineated the outer margins of the proximal patellar tendon, contained both collagen, and degenerative tissue, which is specific for tendinopathy. These tissue compartments exhibit different T2* relaxation times. To monitor the effect of therapeutic interventions, sub-regional analysis has potential to detect subtle changes within a specific tissue-compartment, that probably would have been averaged out when using a large region of interest containing very different T2*relaxation properties.CONCLUSION
Sub-regional quantitative analysis of 3D-UTE MRI of the patellar tendon is possible using thresholds based on bi-exponential fitting, and leads to the identification of tissue-specific T2* biomarkers within the heterogeneous patellar tendon affected by tendinopathy.Acknowledgements
No acknowledgement found.References
1. Zwerver J, Bredeweg SW, Van Den Akker-Scheek I. Prevalence of jumper’s knee among nonelite athletes from different sports: A cross-sectional survey. Am J Sports Med. 2011;39(9):1984–1988.
2. Parkinson J, Samiric T, Ilic MZ, Cook J, Feller JA, Handley CJ. Change in proteoglycan metabolism is a characteristic of human patellar tendinopathy. Arthritis Rheum. 2010;62(10):3028–3035.
3. Koff MF, Pownder SL, Shah PH, Yang LW, Potter HG. Ultrashort echo imaging of cyclically loaded rabbit patellar tendon. J Biomech. Elsevier; 2014;47(13):3428–3432.
4. Chang EY, Du J, Chung CB. UTE imaging in the musculoskeletal system. J Magn Reson Imaging. 2015;41(4):870–883.
5. Chang EY, Du J, Statum S, Pauli C, Chung CB. Quantitative bi-component T2* analysis of histologically normal Achilles tendons. Muscles Ligaments Tendons J. 2015;5(2):58–62.
6. Kijowski R, Wilson JJ, Liu F. Bicomponent ultrashort echo time T2* analysis for assessment of patients with patellar tendinopathy. J Magn Reson Imaging. 2017;46(5):1441–1447.
7. Khan KM, Cook JL, Bonar F, Harcourt P, Astrom M. Histopathology of common tendinopathies. Update and implications for clinical management. Sports Med. 1999;27(6):393–408.
8. Klein S, Staring M, Murphy K, Viergever MA, Pluim JPW. elastix: a toolbox for intensity-based medical image registration. IEEE Trans Med Imaging. 2010;29(1):196–205.
9. Magin RL, Li W, Pilar Velasco M, et al. Anomalous NMR relaxation in cartilage matrix components and native cartilage: fractional-order models. J Magn Reson. 2011;210(2):184–191.
Figures
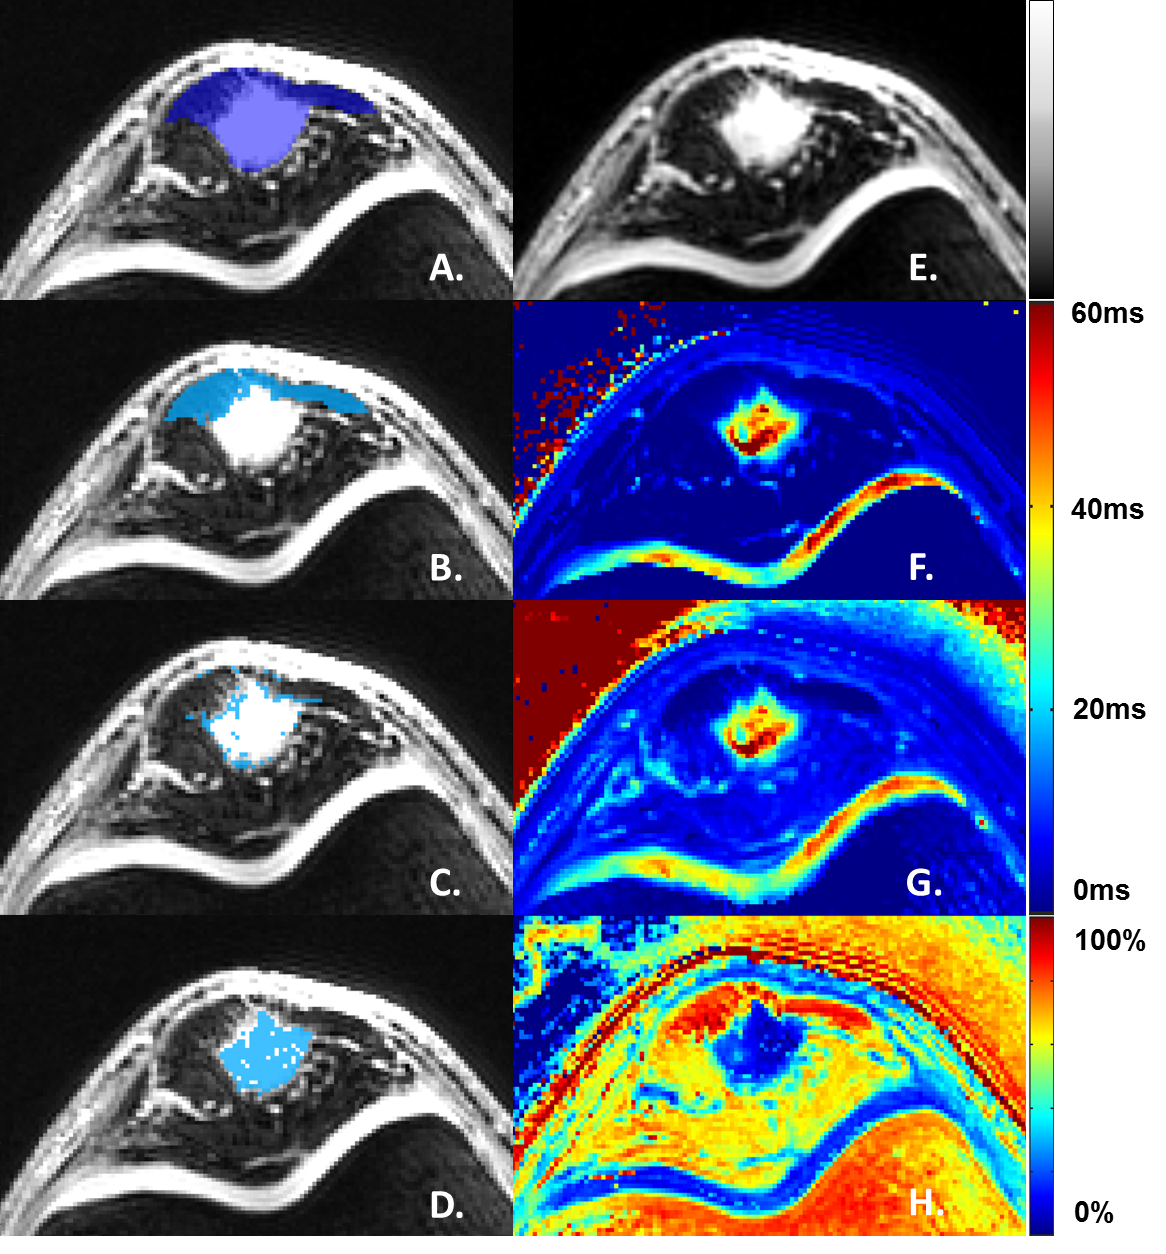
Figure 1: Axial MRI-images of the proximal patellar tendon in patellar tendinopathy
A. Mask delineating the outer margins of the patellar tendon.
B-D. Sub-selected voxels corresponding with (B) 60-100% short T2* components, (C) 30-60% short T2* and (D) 0-30% short T2*.
E. Exemplary image of the 3D-UTE acquisition (TE 4.9ms), depicting hypointense collagen and hyperintense degenerative tissue.
F. T2* map (fractional order fitting).
G. T2* map (mono-exponential fitting).
H. T2* map (bi-exponential fitting), depicting the percentage of short T2* components.