0359
3D UTE Cones Double Echo Steady State Imaging – a New Approach for High Resolution Morphological and Quantitative Evaluation of Short T2 Tissues1University of California, San Diego, San Diego, CA, United States, 2GE Healthcare, La Jolla, CA, United States, 3VA San Diego Healthcare System, San Diego, CA, United States
Synopsis
Double echo steady state (DESS) imaging allows acquisition of two MR images with different contrasts from FID and echo images. In this study, we explored the feasibility and efficacy of 3D UTE Cones-based DESS (3D UTE-Cones-DESS) imaging of short T2 tissues in the knee joint. In ex vivo study of four cadaveric knees and in vivo study of three healthy volunteers, the UTE-Cones-DESS sequence provided high contrast imaging of the osteochondral junction (OCJ), the menisci, and other short T2 tissues, as well as T2 maps, under a total scan time of three minutes.
Introduction
Double echo steady state (DESS) sequence has been utilized in knee imaging due to its excellent image contrast between cartilage and synovial fluid1. DESS allows acquisition of two MR images with different signal contrasts obtained from FID and echo images. Furthermore, quantitative DESS imaging has been investigated to estimate T2 and diffusivity2,3. More recently, it has been shown that ultrashort echo time (UTE) DESS imaging is feasible4. In this study, we show the feasibility and efficacy of 3D UTE-Cones-based DESS (3D UTE-Cones-DESS) in imaging of short T2 tissues in the knee joint.Methods
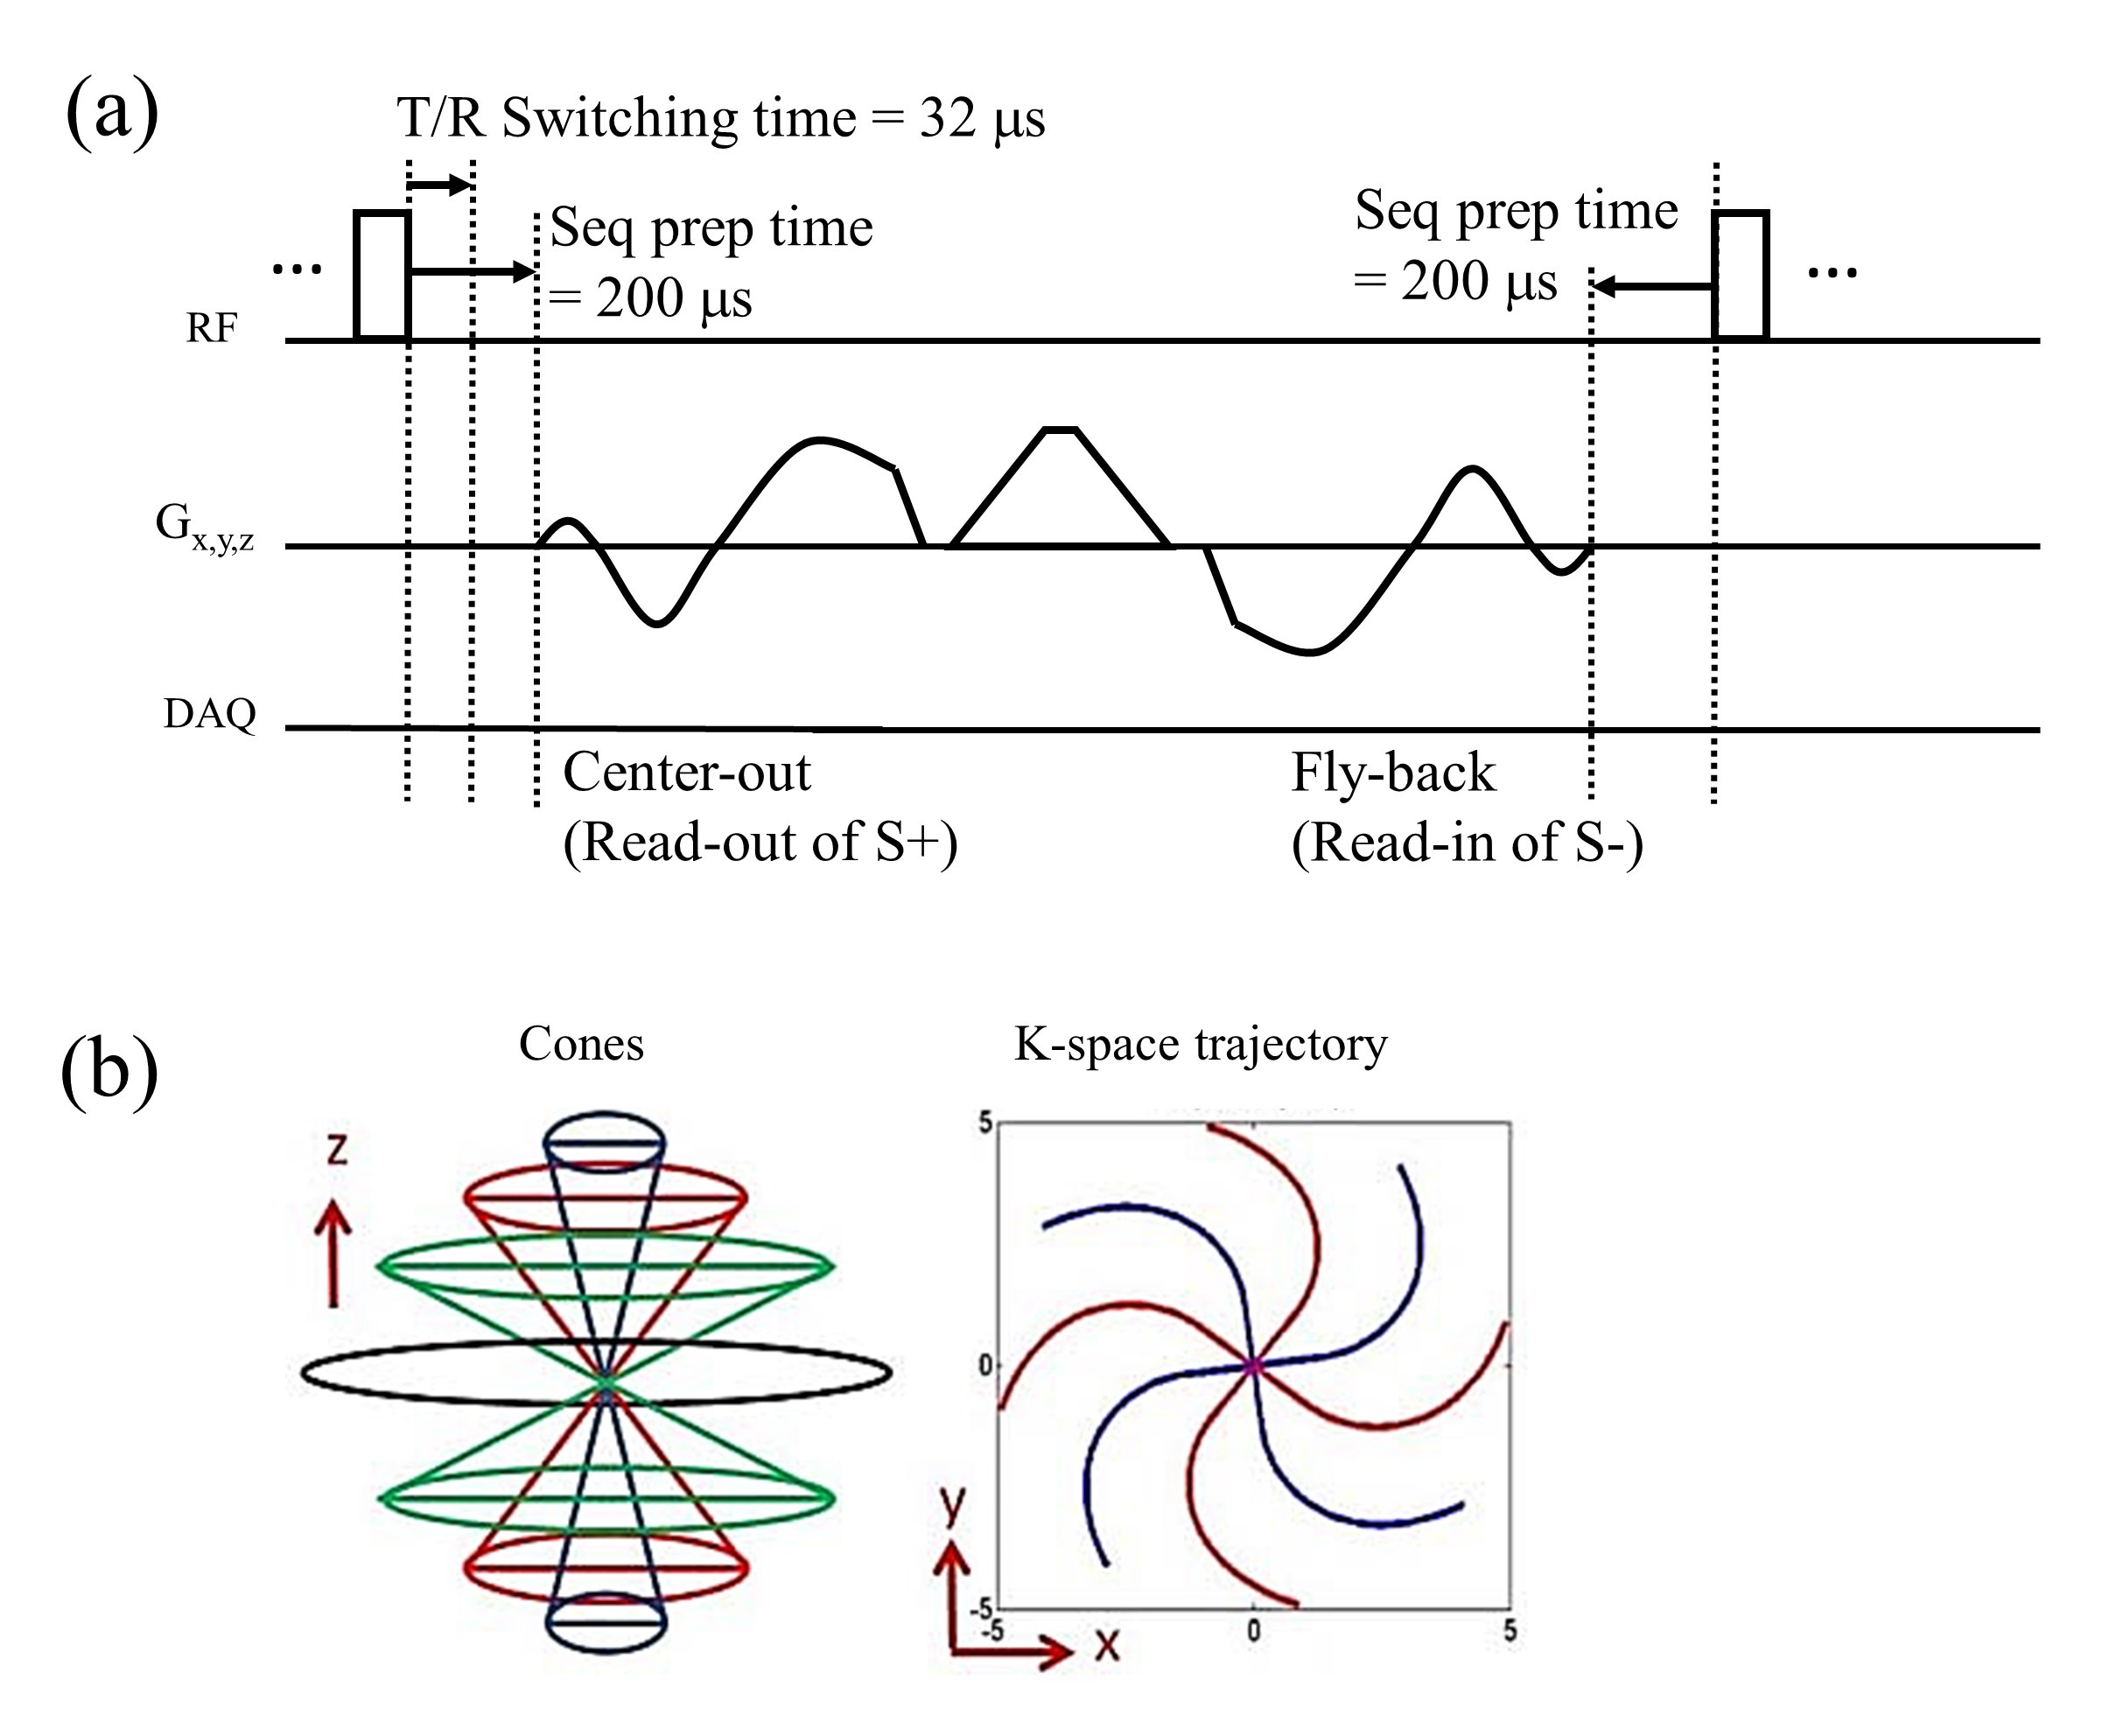
In 3D UTE-Cones imaging, the center-out radial spokes are twisted for more time-efficient encoding5. Figure 1-a shows the pulse sequence diagram of 3D UTE-Cones-DESS. After the repetitive RF pulses (64 hard pulses in this study), steady state of the transverse magnetization is achieved6. Then, 3D UTE-Cones-DESS imaging is performed to encode k-spaces in two different compositions of MR signal: S+ (FID from the current RF) and S- (echo from the previous RF). The S+ signal is encoded with a center-out Cones read-out gradient placed after the RF pulse, while S- is encoded with a fly-back Cones read-in gradient placed before the next RF pulse. TE for the second echo (S-) can be calculated by: TE2=2TR-TE1, where TE1 is the TE in UTE. T2 can be estimated using a simple equation based on the signal ratio2: (TE2-TE1)/ln(S1/S2), where S1 and S2 are the pixelwise signal intensities at TE1 and TE2, respectively.The 3D UTE-Cones-DESS sequence was implemented on a 3T clinical MR system (MR750, GE Healthcare, Waukesha, WI, USA), and tested in four cadaveric knees and three healthy volunteers in accordance with IRB. The knee samples and two volunteers underwent knee joint imaging, while one volunteer underwent tibia imaging. An 8-channel transmit/receive knee coil (GE Healthcare) was used with the following imaging parameters: 1) 3D UTE-Cone-DESS for knee joint imaging: sagittal plane, flip angle (FA) = 5, 10, or 20o for ex vivo imaging and 10o for in vivo imaging, TR/TE1/TE2 = 5/0.2/9.8 ms, readout bandwidth=250 kHz, FOV=150x150x96 mm3, matrix=256x256x48, and scan time=3 min; 2) 3D UTE-Cone-DESS for tibia imaging: all parameters matched to the knee joint imaging except for axial plane, TR/TE1/TE2=6/0.2/11.8 ms, readout bandwidth=125 kHz, and scan time=3min 24sec; 3) CPMG (added in ex vivo imaging): sagittal plan, FA=90o, TR=2000 ms, TE=6.2, 12.3, 18.5, 24.6, 30.8, 37.0, 43.1, 49.3, 55.4, 61.6, 67.8, 73.9 ms, readout bandwidth=125 kHz, FOV=150x150 mm2, matrix=256x256, number of slices=44, slice thickness=2 mm, and scan time=19min 30sec.
Results
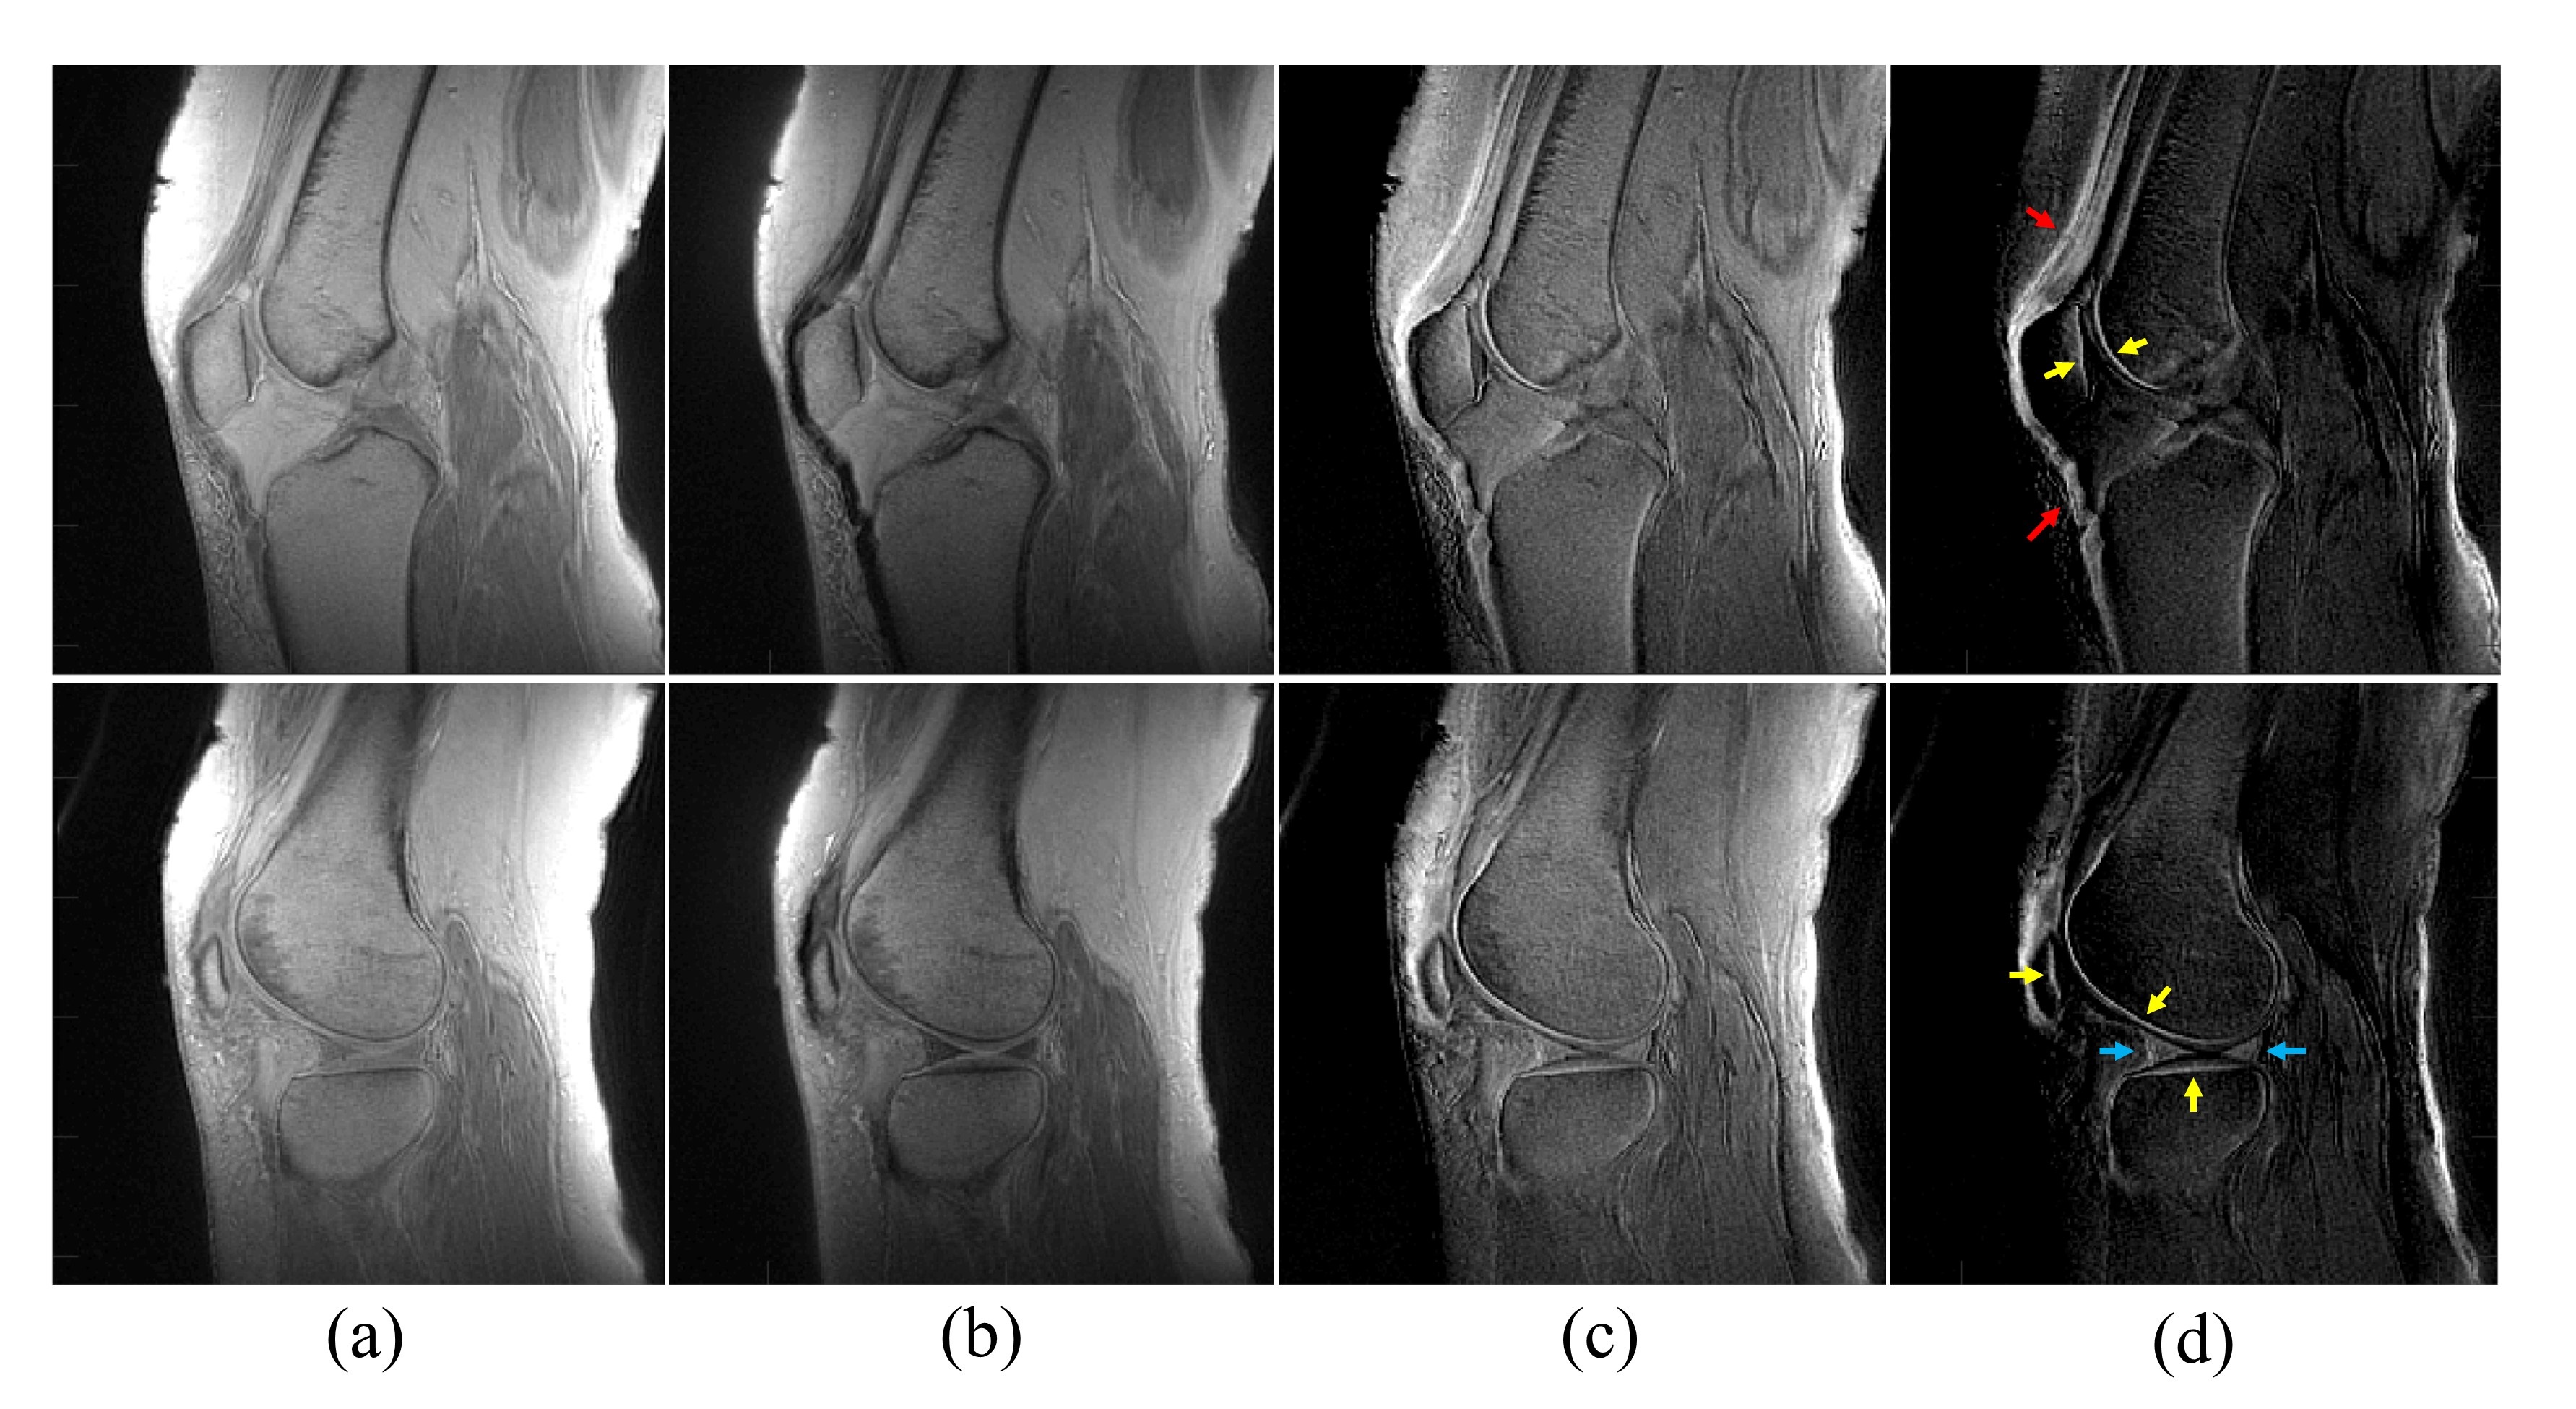
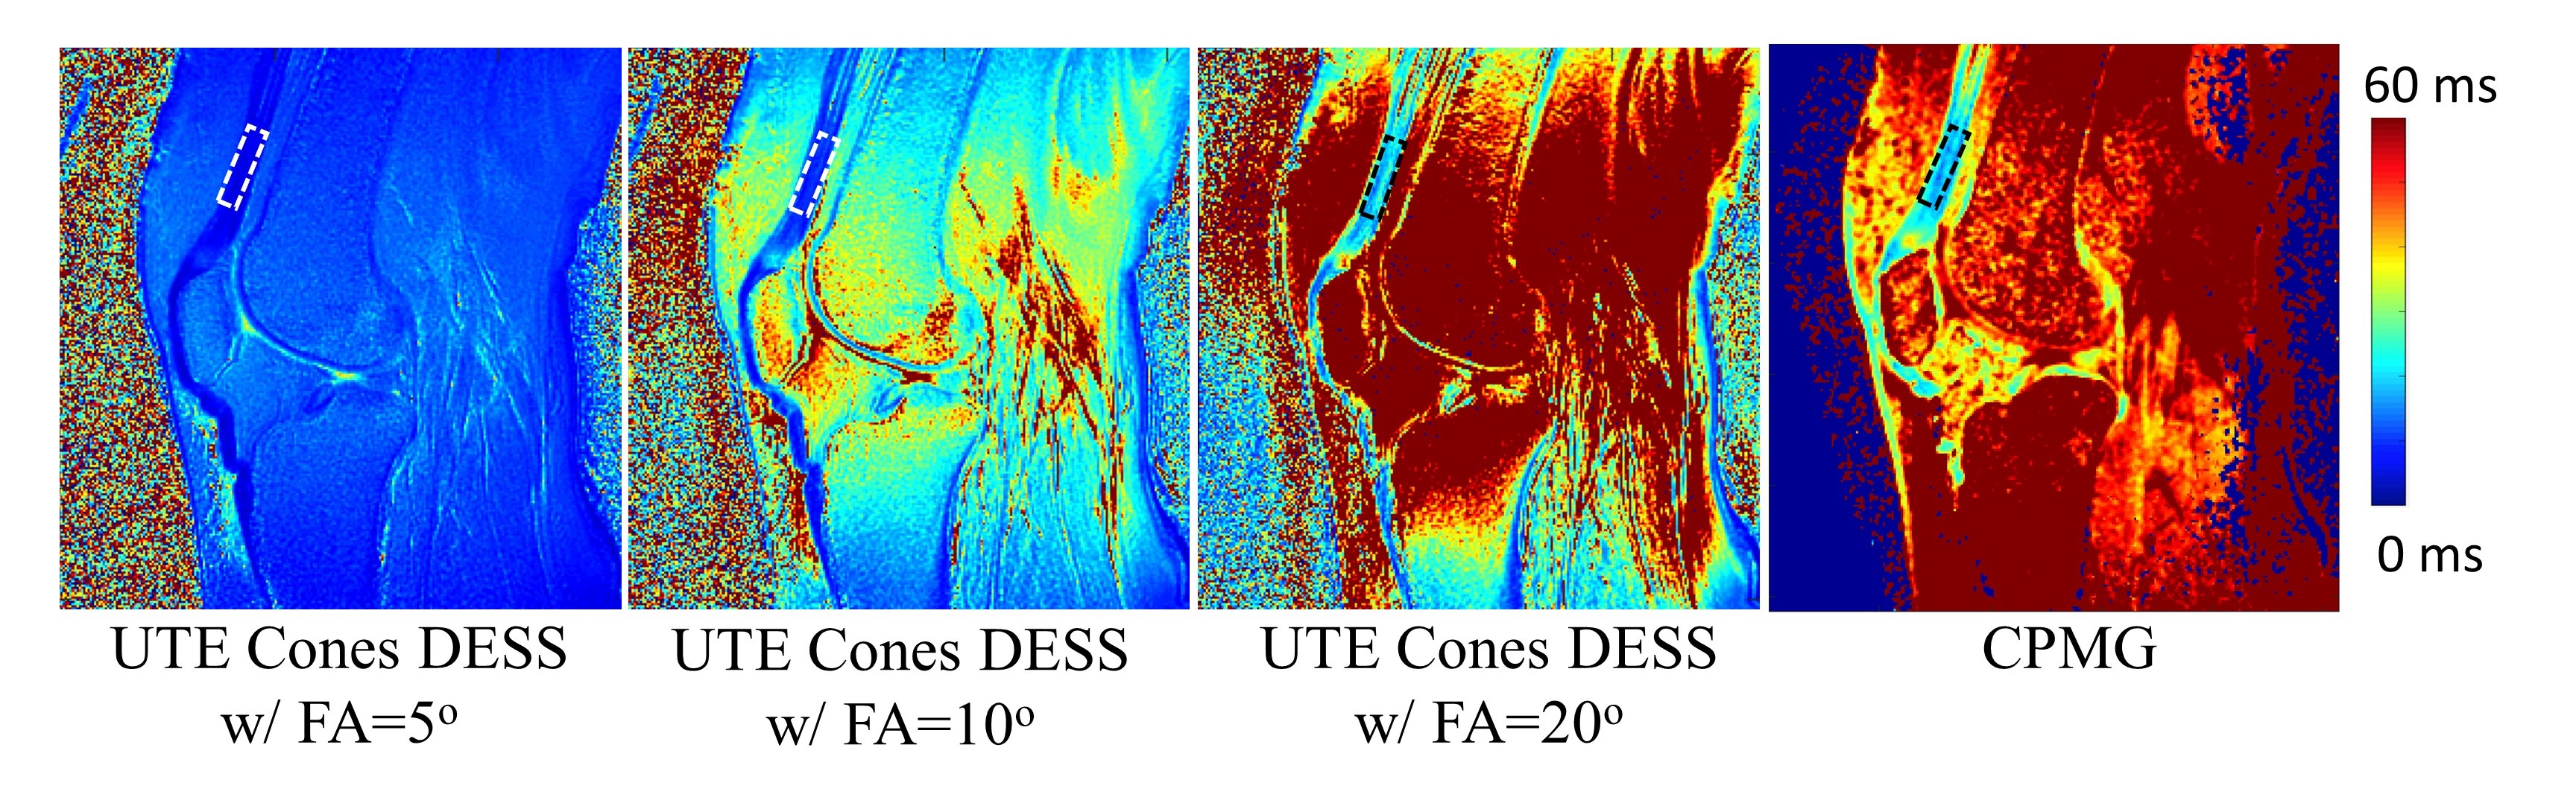
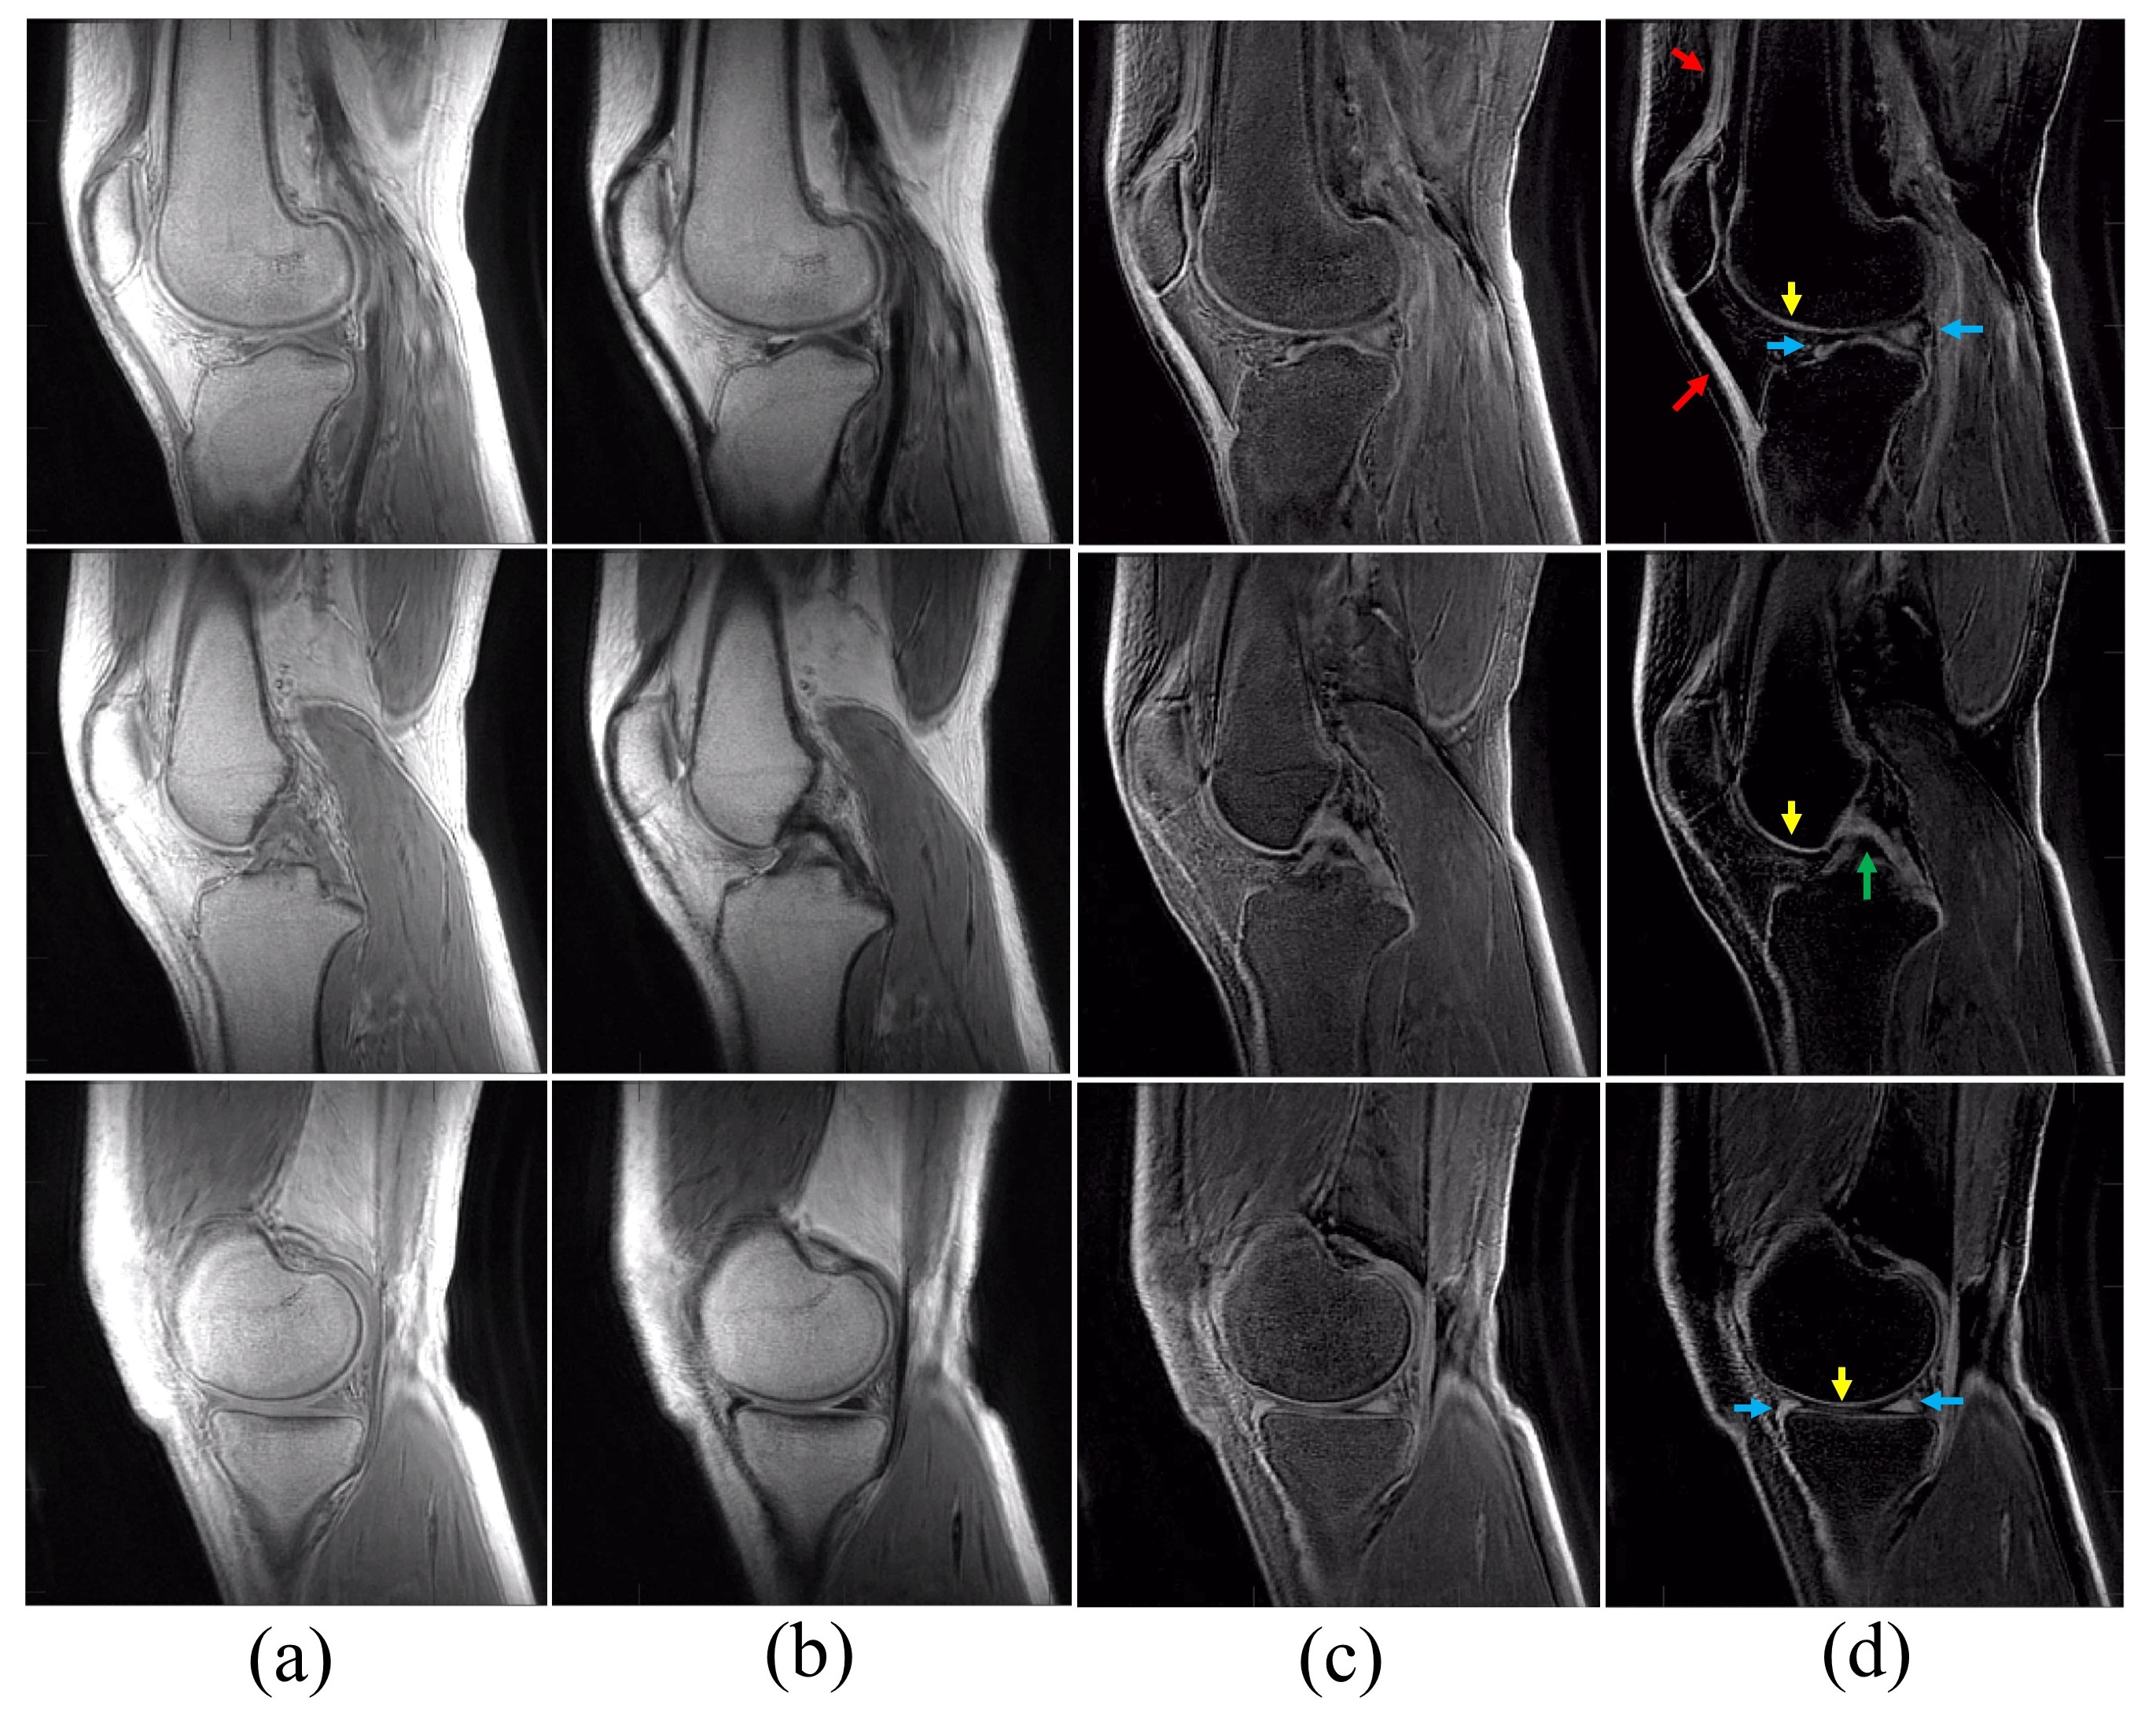
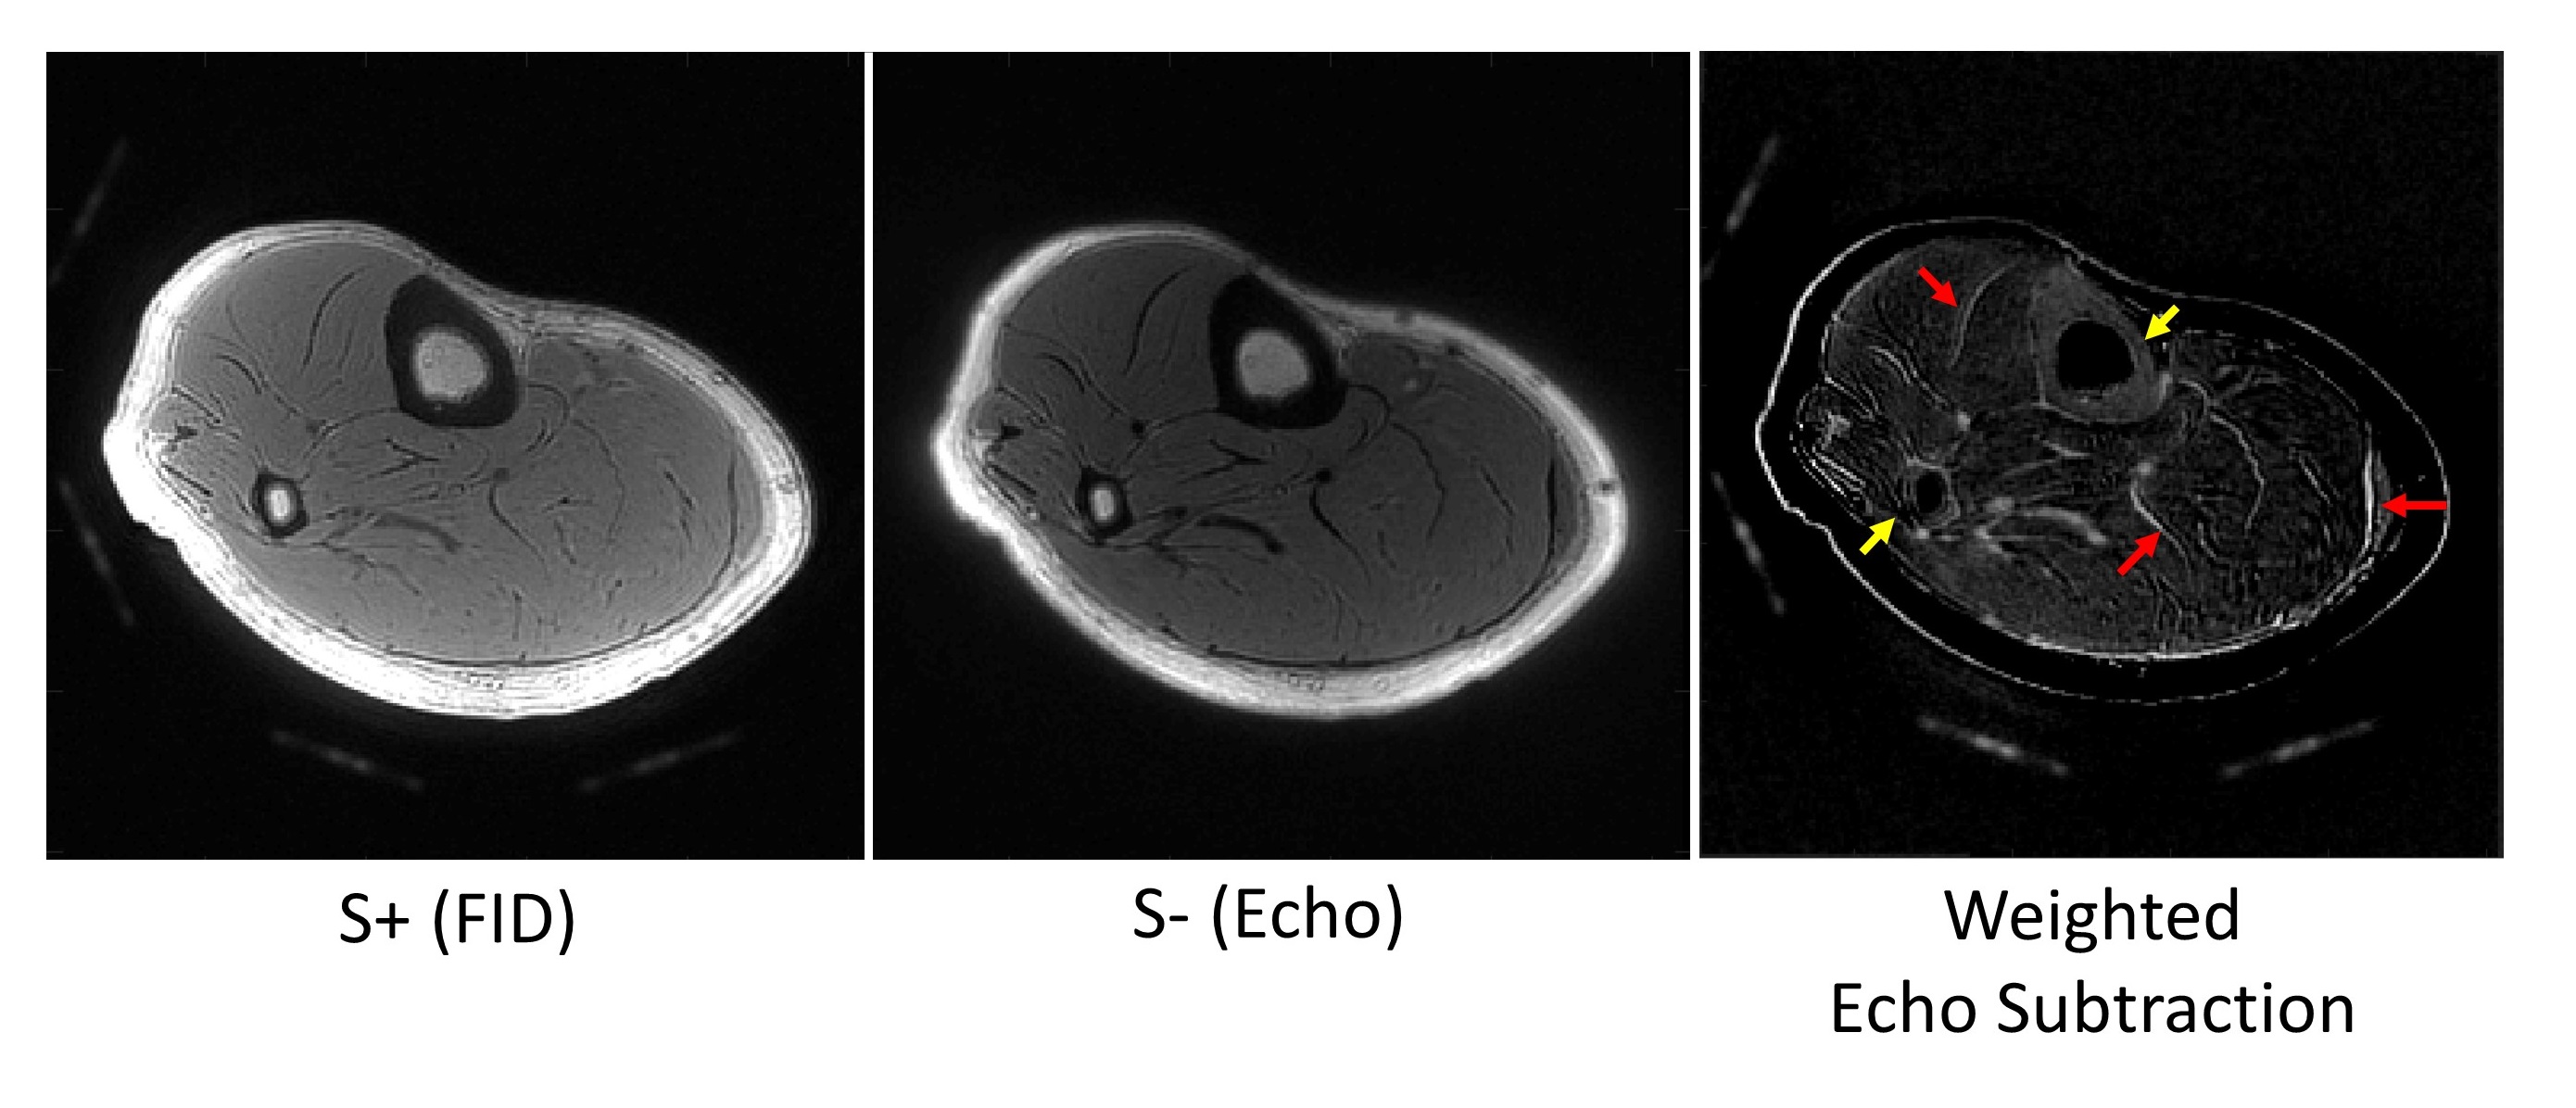
For all ex vivo and in vivo subjects, the 3D UTE-Cones-DESS sequence achieved high quality UTE images (S+) and T2-weighted spin-echo images (S-). Figure 2 shows results from a representative cadaveric knee joint (28-year-old female donor). S- images (Figure 2-b) are more T2-weighted than S+ UTE images (Figure 2-a). Echo-subtracted images (Figure 2-c) show short T2 contrast, where short T2 components exhibit higher intensity. The weighted echo subtraction (Figure 2-d) further suppresses fat and improves the short T2 contrast as indicated by arrows (red: tendon; yellow: deep/calcified cartilage, blue: meniscus). Figure 3 shows the T2 maps estimated with 3D UTE-Cones-DESS or CPMG imaging. The estimated T2 in the region of interest (ROI) for quadriceps tendon indicated by dashed rectangles in Figure 3 is 5.7 ± 0.6 ms with an FA of 5o, 9.7 ± 1.1 ms with an FA of 10o, and 19.8 ± 3.7ms with an FA of 20o in 3D UTE-Cones-DESS, and 19.0 ± 2.6ms in CPMG. 3D UTE-Cones-DESS with a higher flip angle shows T2 values more similar to that in CPMG as a reference2. The spatial variation in T2 map is presumably due to B1 inhomogeneity. Figure 4 shows results from a healthy volunteer (29-year-old female), with improved contrast for short T2 tissues including tendons (red arrows), the OCJ (yellow arrows), menisci (blue arrows), and ligaments (green arrow). Figure 5 shows results from another healthy volunteer (32-year-old male). The weighted echo subtraction provided high contrast imaging of short T2 tissues such as cortical bone (yellow arrows) and aponeurosis (red arrows).Discussion and conclusion
We successfully implemented a 3D UTE-Cones-DESS sequence on a clinical 3T scanner and showed the feasibility and efficacy of high contrast morphological and quantitative imaging of short T2 tissues in the knee. It was shown that T2 estimation depended on FA, where a higher FA yielded more accurate estimation, which was also noted in the literature2. This is because a simple signal model was used based on two images, which can be improved by incorporating more accurate signal model with additional acquisitions with different FAs. Tissue diffusivity can also be estimated by using different spoiling gradients3. Unlike the conventional DESS where S+ and S- signals are combined, we presented echo subtraction with the 3D UTE-Cones-DESS to achieve high contrast imaging of short T2 tissues. The echo subtraction in spin echo is less affected by chemical shift effect than in gradient echo-based dual echo UTE imaging7. 3D UTE-Cones-DESS can be applied to various musculoskeletal and neurological applications owing to the capability of fast high resolution morphological and quantitative imaging of both short and long T2 tissues.Acknowledgements
The authors acknowledge grant support from NIH (R01AR075825, 2R01AR062581, 1R01 AR068987), Veterans Affairs (Merit Awards 1I01RX002604), and GE Healthcare.References
1. Moriya S, Miki Y, Yokobayashi T, Ishikawa M. Three-Dimensional Double-Echo Steady-State (3D-DESS) magnetic resonance imaging of the knee: Contrast optimization by adjusting flip angle. Acta radiol. 2009;50:507–511.
2. Welsch GH, Scheffler K, Mamisch TC, et al. Rapid estimation of cartilage T2 based on double echo at steady state (DESS) with 3 Tesla. Magn. Reson. Med. 2009;62:544–549.
3. Bieri O, Ganter C, Scheffler K. Quantitative in vivo diffusion imaging of cartilage using double echo steady-state free precession. Magn. Reson. Med. 2012;68:720–729.
4. Chaudhari AS, Sveinsson B, Moran CJ, et al. Imaging and T2 relaxometry of short-T2 connective tissues in the knee using ultrashort echo-time double-echo steady-state (UTEDESS). Magn. Reson. Med. 2017;78:2136–2148.
5. Ma Y-J, Lu X, Carl M, et al. Accurate T1 mapping of short T2 tissues using a three-dimensional ultrashort echo time cones actual flip angle imaging-variable repetition time (3D UTE-Cones AFI-VTR) method. Magn. Reson. Med. 2018;80:598–608.
6. Zur Y, Stokar S, Bendel P. An analysis of fast imaging sequences with steady‐state transverse magnetization refocusing. Magn. Reson. Med. 1988;6:175–193.
7. Chang EY, Du J, Chung CB. UTE imaging in the musculoskeletal system. J. Magn. Reson. Imaging 2015;41:870–883.
Figures