0357
UTE-based biomarkers are selectively sensitive to enzymatic proteoglycan and collagen degradation in human articular cartilage1Department of Radiology, UC San Diego, San Diego, CA, United States, 2Department of Radiology, Shanghai Tenth People's Hospital, Shanghai, China, 3Division of Histology and Embryology, Jinan University, Guangzhou, China, 4Radiology Service, VA San Diego Healthcare System, San Diego, CA, United States, 5Orthopaedic Surgery Service, VA San Diego Healthcare System, San Diego, CA, United States
Synopsis
A panel of quantitative UTE techniques have been developed to assess articular cartilage. Osteoarthritis (OA) is a multifactorial disease characterized primarily by degeneration and loss of hyaline articular cartilage. This study investigated whether quantitative 3D UTE-Cones-based biomarkers are sensitive to proteoglycan (PG) loss and collagen degradation induced by enzyme in human cartilage, and also to determine the specificity of these biomarkers in quantitative cartilage imaging.
Introduction:
The onset of OA is associated mainly with cartilaginous biochemical alterations, with PG loss having been hypothesized as an initiating factor 1,2. As collagen volume has not been shown to be severely affected at the earliest stages of OA 1,3, non-invasive detection of PG loss and collagen degradation by imaging would be very useful for early stage diagnosis 4,5, facilitating timely treatment of the disease while it may be clinically reversible. The purpose of our study was to investigate whether quantitative 3D UTE-Cones-based biomarkers are sensitive to PG loss and collagen degradation induced by enzyme in human cartilage, and also to quantitatively evaluate the correlation between UTE biomarkers with biochemical components, including PG and collagen, in order to determine the specificity of these biomarkers in cartilage imaging.Methods:
Sample preparation: 60 osteochondral cores were harvested from five donors (46.2±11.2 years old); pure cartilage wafers were obtained by removing the subchondral bone. The cartilage samples were soaked in phosphate-buffered saline (PBS) and inhibitor solutions, including AEBSF, and Ilomastat/GM6001 for two hours to rehydrate the samples and prevent autolysis.MRI sequences: All cartilage samples underwent MR scanning before and after enzyme digestion on a 3T clinical MRI scanner (MR750; GE Healthcare Technologies, Milwaukee, WI) using a homemade 30-ml birdcage coil. Cartilage wafers were placed in a 10-ml syringe filled with perfluoropolyether in a particular order, and the order was maintained across different scans. Furthermore, each cartilage sample was marked with a small notch so as to maintain orientation across scans. The following four imaging protocols were performed: A) 3D UTE-Cones magnetization transfer (3D UTE-Cones-MT) with three saturation pulse powers (q=400°/600°/800°) and five frequency offsets (Df=2/5/10/20/50 kHz) 6; B) 3D UTE-Cones with actual flip angle imaging and variable flip angles (3D UTE-Cones AFI-VFA) with flip angles (FA) of 5°/10°/20°/30°, and a TR of 20 ms 7; C) 3D UTE-Cones with adiabatic T1ρ preparation (3D UTE-Cones-AdiabT1ρ) with spin-locking times (TSLs) of 0/12/24/36/48/72/96 ms 8; D) 3D UTE-T2* with TEs of 0.032/4.1/8.1/12.1/16.1/32 ms. Other imaging parameters included: FOV=5 cm, matrix=160×160, slice thickness=0.5mm, 60 slices. The total scan time was 78 min.
Enzymatic digestion and biochemical test: 30 samples were incubated in a 3-ml trypsin -in-PBS (1mg/ml) solution for three hours, while the other 30 samples were incubated in PBS at 37℃ for three hours. After scanning, samples were rinsed in PBS for one hour. 30 samples, of which 15 were incubated in PBS and the other 15 were incubated in trypsin during the previous step, were incubated in 30U/ml collagenase with Tris buffer solution. The other 30 samples were incubated in only Tris buffer at 37℃ for 24 hours. In summary, samples were equally divided into four different groups: PBS+Tris , PBS+30U collagenase, trypsin+30U collagenase, and trypsin+Tris . The glycosaminoglycan (GAG) concentration in the digestion solutions was determined by the dimethyl-methylene blue (DMMB) method 9. The collagen content was measured using the standards of a hydroxyproline assay.
Data analysis: Three consecutive slices at the center of each wafer were used for global region of interest (ROI) analysis. T1, AdiabT1ρ, MMF, MTR, and T2* values were calculated for all cartilage samples. Pearson correlation coefficients were used to evaluate the relationship between UTE biomarkers with PG concentration. ANOVA (analysis of variance) and LSD (least significant difference) tests were used to compare the differences of the abovementioned MRI biomarkers among four groups.
Results and Discussion:
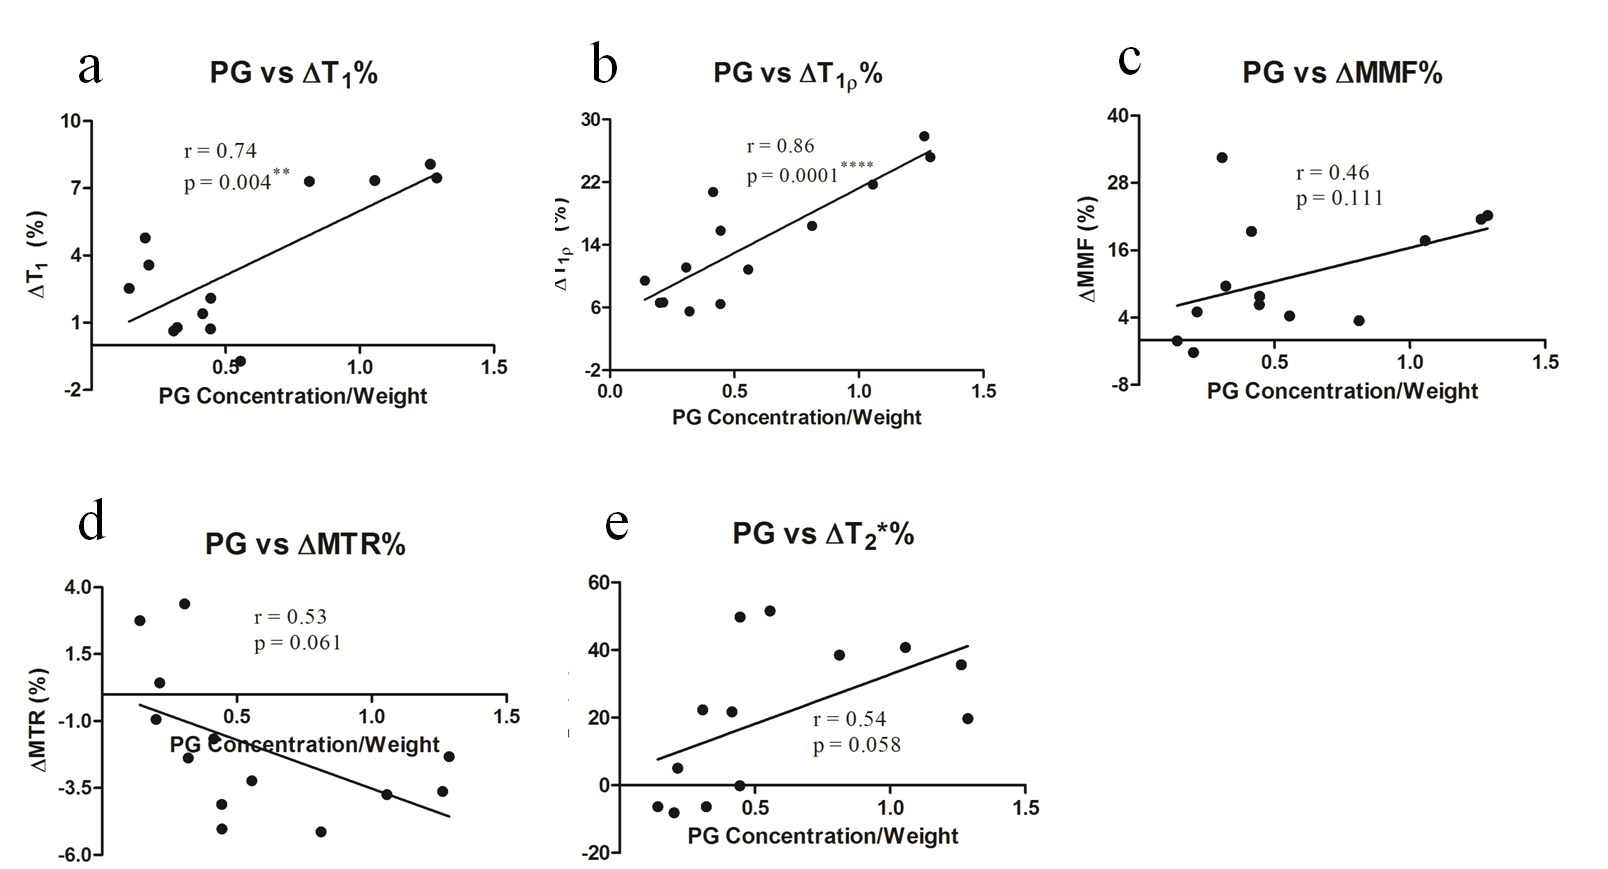
Figure 1 shows the changes of quantitative UTE-based biomarkers, including T1, T1ρ, MMF, MTR, and T2*, after the sequential processing in four different groups. For T1 and T1ρ, there was no significant difference between the PBS+Tris and PBS+30U collagenase groups, while T1 and T1ρ values were significantly increased in tryp+Tris and tryp+30U collagenase groups, with the latter group being more obvious. For MMF and MTR, the values of PBS+30 U collagenase and tryp+Tris groups were not significantly different from the values of the PBS+Tris group, which was regarded as a control. However, the MMF and MTR values decreased significantly in the tryp+30U collagenase groups. There were no significant differences observed among groups in T2* values.Figure 2 presents the correlations of the change ratio of quantitative UTE biomarkers after digestion with the PG concentration in the digestion solutions. The change ratios of T1 and T1ρ were positively correlated with PG concentration (p<0.0001) and the correlation coefficients were 0.74 and 0.86, respectively. No signficant correlations were found between the change ratio of MMF, MTR, and T2* with PG concentration, as p-values were all >0.05.
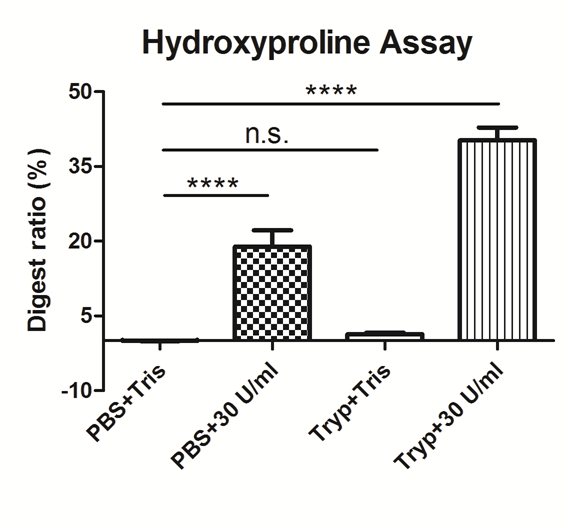
The differences between digestion ratios of collagen in the four groups can be seen clearly in Figure 3.
Conclusion:
PG loss and collagen degradation in cartilage was observed after enzyme digestion, with a corresponding increase in UTE T1 and T1ρ values and a decrease in MMF and MTR, respectively. T1ρ relaxation, as measured with the 3D UTE-Cones-AdiabT1ρ sequence, and T1, as measured by the 3D UTE-Cones AFI-VFA sequence, have potential for detecting PG loss, while MMF and MTR, as measured with the 3D UTE-Cones magnetization transfer sequence, are promising biomarkers for detection of collagen degradation in articular cartilage, thereby facilitating the non-invasive diagnosis of OA at its early stages.Acknowledgements
The authors acknowledge grant support from the NIH (R01AR075825, R01AR062581, and 1R01AR068987) and the VA (I01CX001388 and I01RX002604).References
1. Bashir A, Gray ML, Burstein D. Gd-DTPA2- as a measure of cartilage degradation. Magnetic resonance in medicine. 1996;36(5):665-673.
2. Taylor C, Carballido-Gamio J, Majumdar S, Li X. Comparison of quantitative imaging of cartilage for osteoarthritis: T2, T1rho, dGEMRIC and contrast-enhanced computed tomography. Magn Reson Imaging. 2009;27(6):779-784.
3. Akella SV, Regatte RR, Gougoutas AJ, et al. Proteoglycan-induced changes in T1rho-relaxation of articular cartilage at 4T. Magnetic resonance in medicine. 2001;46(3):419-423.
4. Chu CR, Williams AA, Coyle CH, Bowers ME. Early diagnosis to enable early treatment of pre-osteoarthritis. Arthritis research & therapy. 2012;14(3):212.
5. Duvvuri U, Reddy R, Patel SD, Kaufman JH, Kneeland JB, Leigh JS. T1rho-relaxation in articular cartilage: effects of enzymatic degradation. Magnetic resonance in medicine. 1997;38(6):863-867. 6. Springer F, Martirosian P, Machann J, Schwenzer NF, Claussen CD, Schick F. Magnetization transfer contrast imaging in bovine and human cortical bone applying an ultrashort echo time sequence at 3 Tesla. Magnetic resonance in medicine. 2009;61(5):1040-1048.
7. Ma YJ, Lu X, Carl M, et al. Accurate T1 mapping of short T2 tissues using a three-dimensional ultrashort echo time cones actual flip angle imaging-variable repetition time (3D UTE-Cones AFI-VTR) method. Magnetic resonance in medicine. 2018;80(2):598-608.
8. Ma YJ, Carl M, Shao H, Tadros AS, Chang EY, Du J. Three-dimensional ultrashort echo time cones T1rho (3D UTE-cones-T1rho ) imaging. 2017;30(6).
9. Enobakhare BO, Bader DL, Lee DA. Quantification of sulfated glycosaminoglycans in chondrocyte/alginate cultures, by use of 1,9-dimethylmethylene blue. Analytical biochemistry. 1996;243(1):189-191.
Figures