0356
Ex Vivo Evaluation of Sodium Relaxation Times in Pediatric Articular-Epiphyseal Cartilage on a Whole-body 10.5T MR System – Initial Results1Center for Magnetic Resonance Research, University of Minnesota, Minneapolis, MN, United States, 2Department of Radiology, University of Minnesota, Minneapolis, MN, United States, 3Department of Bioengineering, Stanford University, Stanford, CA, United States, 4Department of Veterinary Clinical Sciences, University of Minnesota, St. Paul, MN, United States, 5Department of Orthopaedic Surgery, University of Minnesota, Minneapolis, MN, United States, 6Department of Orthopaedic Surgery, Stanford Children's Hospital, Palo Alto, CA, United States, 7Department of Radiology, Stanford University, Stanford, CA, United States, 8Institute of Radiology, University Hospital Erlangen, Friedrich-Alexander-Universität Erlangen-Nürnberg, Erlangen, Germany
Synopsis
Sodium imaging is quantitative technique sensitive to changes in cartilage glycosaminoglycan content. Changes in cartilage matrix, due to maturation or degeneration, may influence sodium relaxation times which can lead to incorrect sodium concentration estimates when not addressed. This ex vivo study employs pediatric knee specimens to evaluate the relationship between sodium relaxation parameters and compositional changes in the developing cartilage matrix. Our preliminary evaluation suggests that cartilage maturation is accompanied by a decrease in sodium T1 and the short T2* component. Sodium concentrations in studies comparing healthy, diseased or immature cartilage should be corrected for possible changes in relaxation times.
INTRODUCTION:
The health and functional properties of articular cartilage are related to its glycosaminoglycan (GAG) concentration, which can be evaluated with sodium MRI.1,2 Most studies calculate sodium concentrations assuming the same sodium relaxation times in healthy and degenerated or osteoarthritic cartilage. However, previous results suggest relaxation times may increase in degenerated cartilage 3 and thus lead to the incorrect sodium concentration measurements when not addressed. Pediatric cartilage at different developmental stages offers a natural, non-enzymatic model to study the relationship between sodium relaxation parameters and compositional changes in developing cartilage matrix. The aims of this ex vivo 10.5T study were to: (i) evaluate sodium relaxation times in the articular-epiphyseal cartilage complex of pediatric knee specimens, (ii) calculate hydration, collagen content and GAG content in cartilage biopsies from these same specimens, (iii) evaluate associations between specimen age, biochemical composition, and sodium relaxation parameters.METHODS:
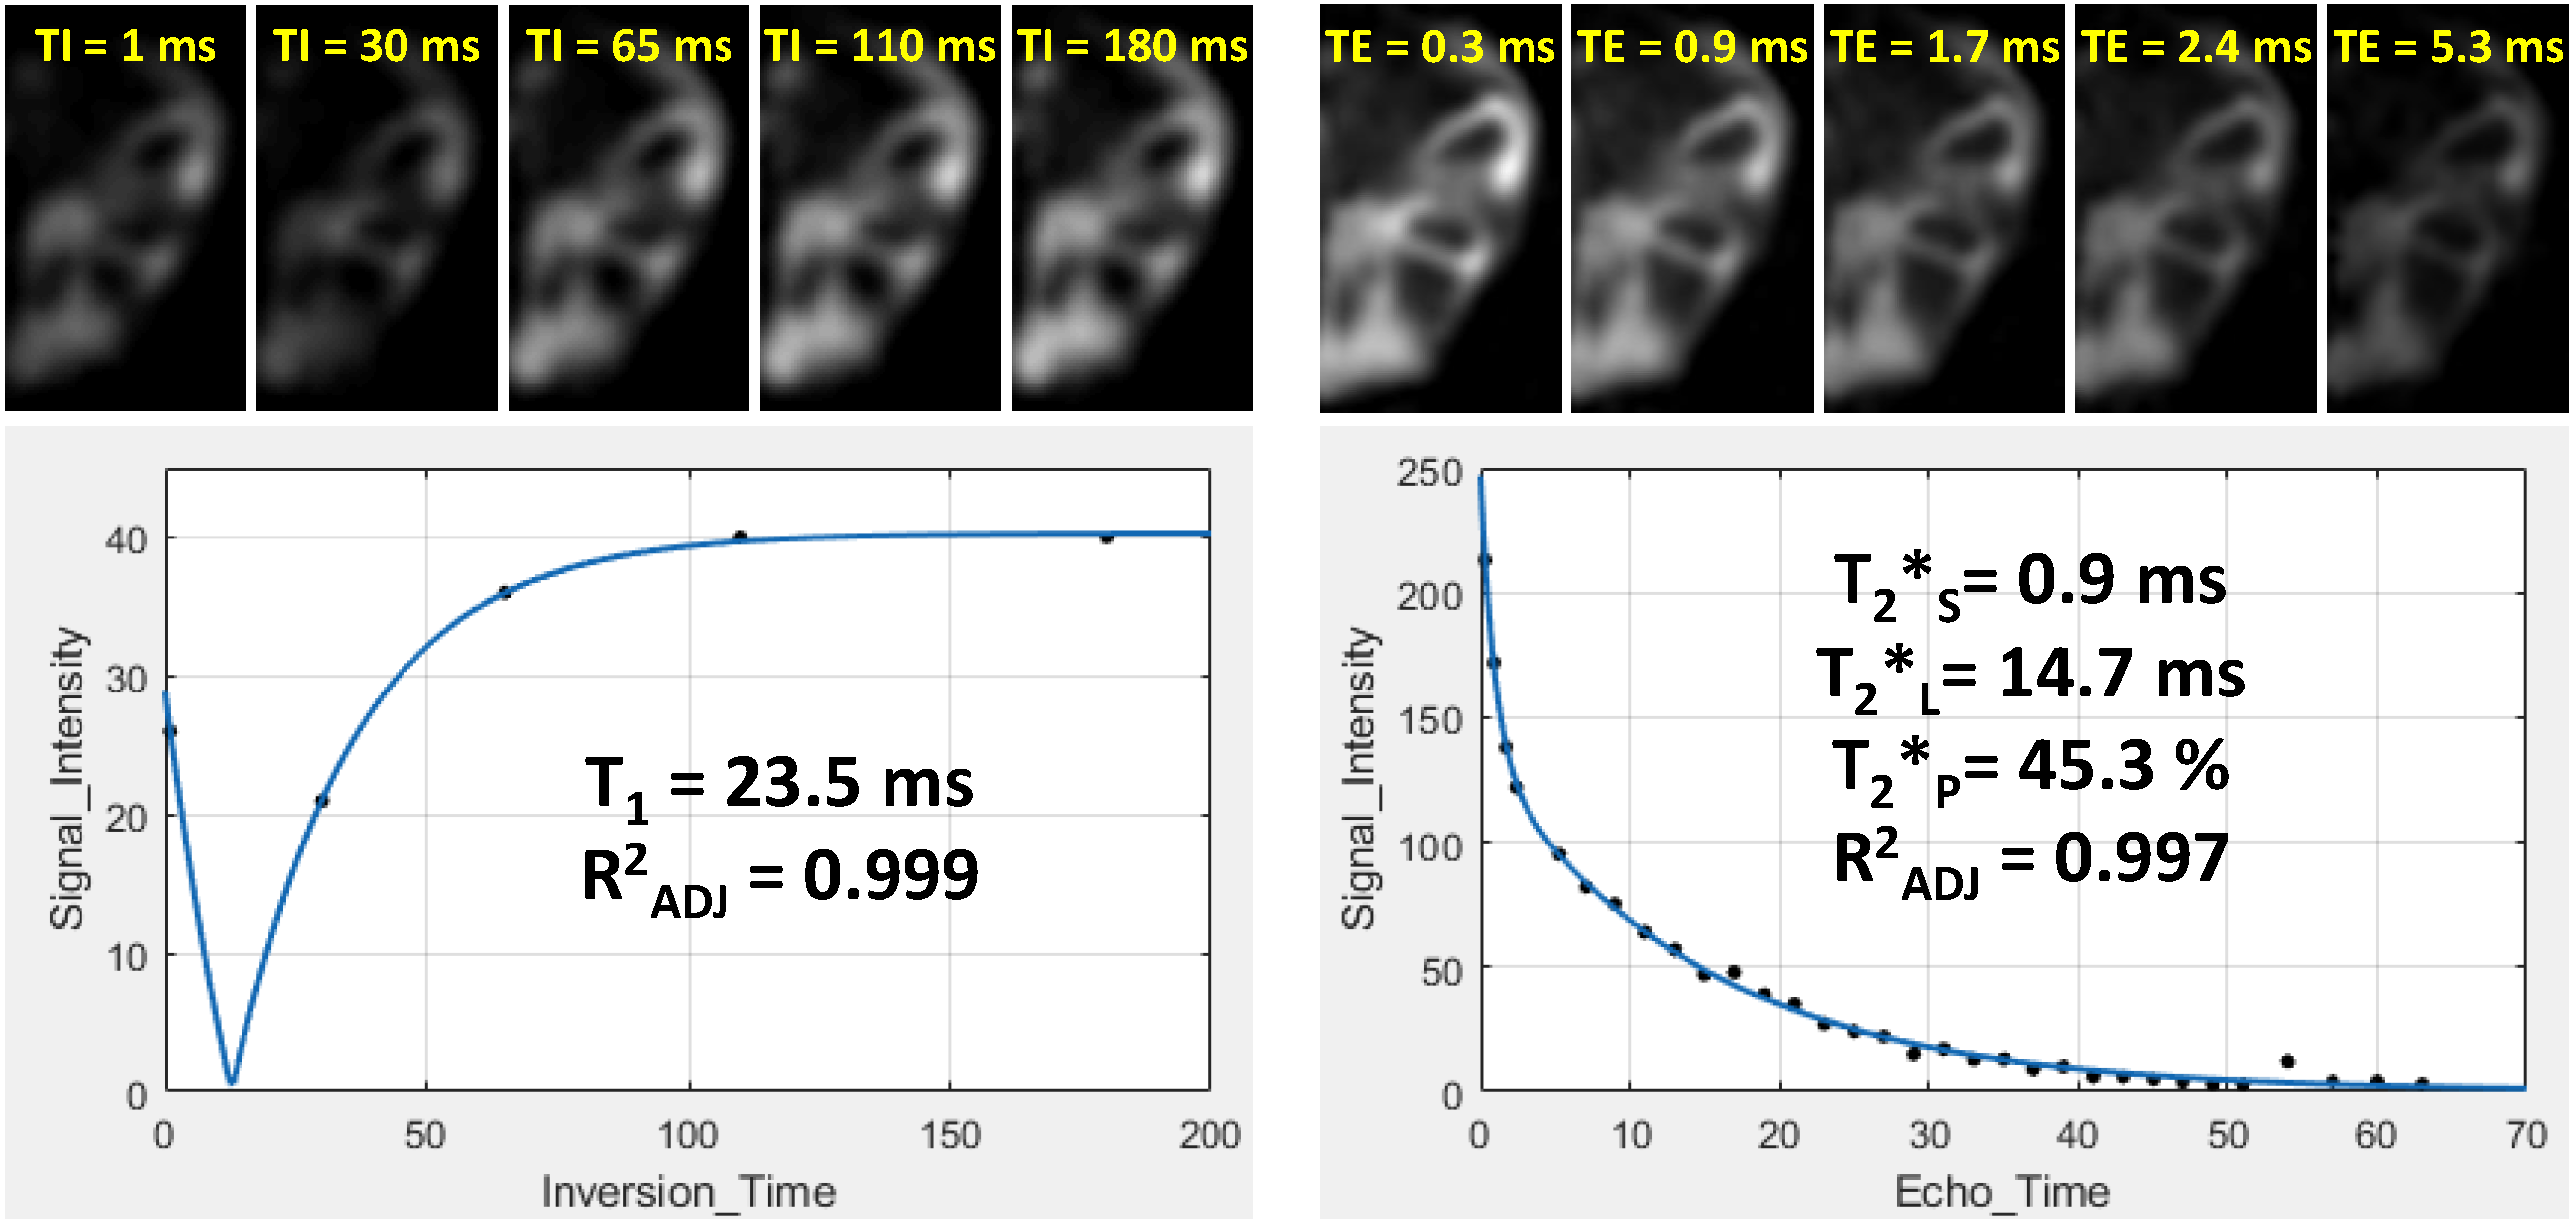
Six intact knee joint specimens from pediatric donors (4 females, 2 males; all left knees; age, 3-51 months) were received frozen from Allosource Inc. (Centennial, CO). All specimens were thawed, immersed in perfluoropolyether, and measured at room temperature using a whole-body 10.5T MRI system (Siemens Magnetom, Erlangen, Germany).4 Immediately after MRI, osteochondral core biopsies (diameter, 6 mm) from trochlear ridge were acquired, wrapped in saline-soaked gauze and frozen at -20°C.For sodium imaging, a 3T birdcage knee coil (Siemens) was modified and re-tuned to the 10.5T sodium frequency (118.25 MHz). B0 shimming and proton imaging were performed using a pair of fractionated proton dipole antennas 4 driven with equal RF power and phase, and positioned inside the sodium knee coil. Water-selective 3D DESS images (TR/TE: 15/5ms, FA: 50°, isotropic resolution: 0.4mm, TA: 14-22 min) were acquired for the segmentation of the articular-epiphyseal cartilage complex. All sodium images were acquired using a density 3D radial projection sequence (DA-RP).5 Sodium B1+ maps were calculated using a dual-angle method. Five sets of inversion recovery prepared DA-RP sequences were acquired for T1 mapping (TR: TI+130ms, TE: 0.3ms, TI: 1-180ms, FA: 90°, 4500 projections, readout: 10ms, nominal isotropic resolution: 3.0mm, TA: 10-23 min/sequence). Four sets of multi-echo DA-RP sequences (32 TEs) were acquired for bi-exponential T2* mapping (TR: 70ms, TEs: 0.3, 0.9, 1.7,…, 63 ms, FA: 70°, 9500 projections, readout: 4ms, nominal isotropic resolution: 4.0mm, TA: 11 min/sequence).
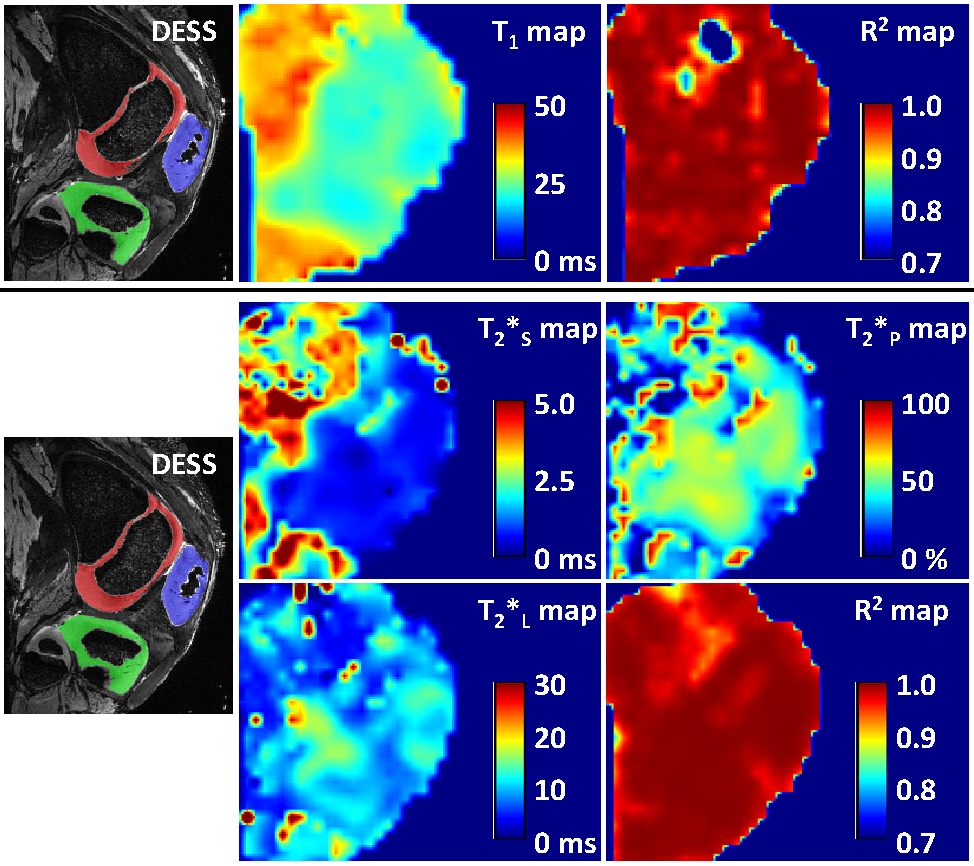
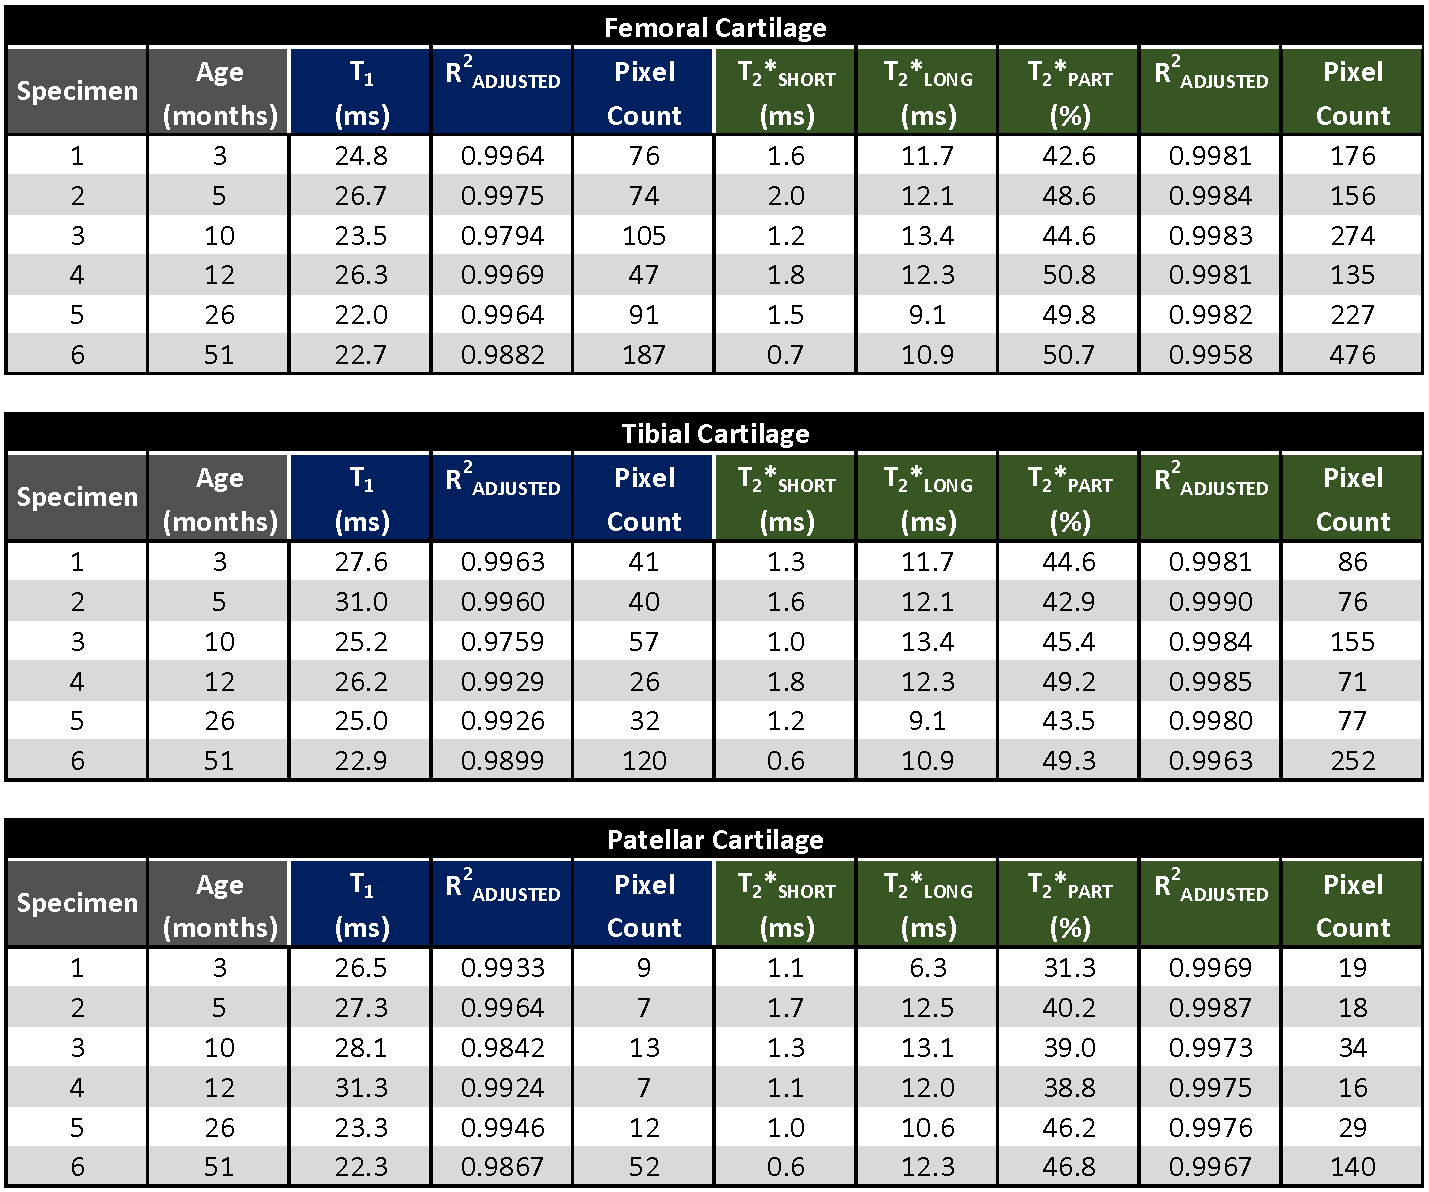
All sodium images were reconstructed in Matlab (Mathworks, Natick, MA) using a non-uniform fast Fourier transform method and Hann filter. T1 and T2* maps were calculated pixel-by-pixel using three-parametric mono-exponential and five-parametric bi-exponential least square fitting of sodium signal in Matlab, respectively (Fig.1). T1, short (T2*SHORT) and long (T2*LONG) components of T2* relaxation, signal fraction of short T2* component (T2*PART), and corresponding adjusted coefficient of determination (R2) maps were calculated for all specimens (Fig.2). Semi-automated segmentation of femoral, tibial and patellar cartilage in DESS images was performed in ITK-SNAP (Fig.2). Segmentation masks were down-sampled to the resolution of sodium relaxation maps and the mean values for each articular-epiphyseal cartilage compartment were obtained from each knee specimen in Matlab (Fig.3).
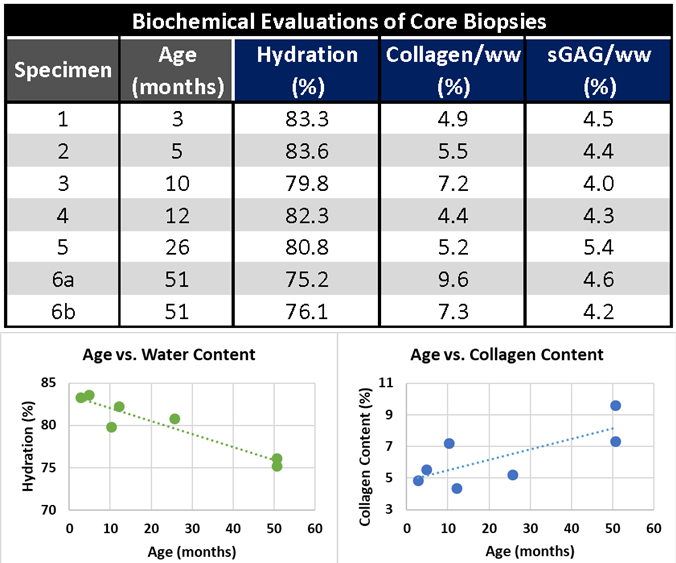
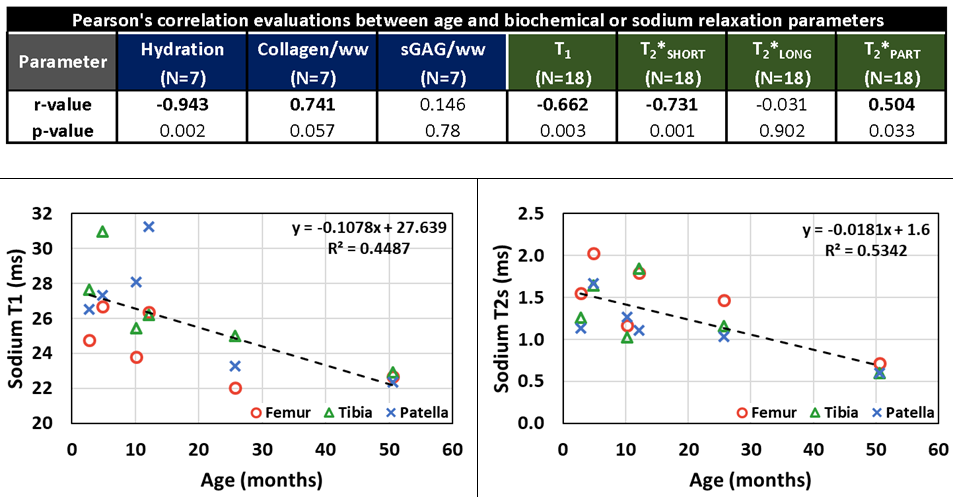
For biochemical evaluation, osteochondral biopsies were thawed and, after removing bone tissue, cartilage cores were divided into cross-sectional discs. Sample wet and dry weights were recorded before further cartilage treatment. Proteoglycan and collagen content were assessed from spectrophotometric evaluations of the 1,9-dimethylmethylene blue and the O-hydroxyproline biochemical assays, respectively. The mean hydration, collagen, and sulfated glycosaminoglycan content (sGAG) were calculated for each core biopsy (Fig.4). Pearson’s correlation coefficients (r) were calculated to evaluate association between specimen age and biochemical and sodium relaxation parameters.
RESULTS:
The ranges of mean sodium relaxation times in all evaluated specimens were: T1= 22-31 ms, T2*SHORT= 0.6-1.8 ms, T2*LONG= 6.3-13.4 ms, T2*PART= 39-51% (Fig.3). High adjusted R2 values suggest excellent performance of fitting models (Fig.3). Specimen age was strongly correlated with cartilage hydration (r= -0.943) and collagen content (r= 0.741), but not with sGAG content (Figs.4,5). Specimen age also showed strong correlation to T2*SHORT (r= -0.731), medium correlation to T1 (r= -0.670) and T2*PART (r= 0.504), and no correlation to T2*LONG (Fig.5).DISCUSSION:
The preliminary results of the present pediatric articular cartilage study suggest a decrease in sodium T1 and T2*SHORT relaxation times and an increase in T2*PART with increasing age and skeletal maturation. Presented sodium T1 times are longer than previously reported T1 values in adult cartilage ranging from 18 to 21 ms.6 Observed changes are consistent with a physiologic increase in collagen content and organization, and a decrease in water content and GAG content during cartilage maturation.7,8 Our initial biochemical results from biopsies also suggest a trend towards a decrease in cartilage hydration and an increase in collagen content with increasing specimen age.CONCLUSION:
Sodium relaxation times may change as a result of compositional and structural changes in the cartilage matrix caused by tissue maturation or degeneration. Assuming T2* parameters form the youngest and oldest specimen in the study, the difference between sodium concentrations calculated with and without correction for T2* was more than 11% for TE of 0.3 ms and more than 17% for more frequently used TE of 0.5 ms. Studies comparing results from healthy and degenerated or immature cartilage should account for changes in sodium relaxation parameters when evaluating sodium concentrations.Acknowledgements
This study was supported by the NIH grants R01 AR070020, P41 EB027061, and S10 RR029672.References
1. Zbyn S, Mlynarik V, Juras V, et al., Evaluation of cartilage repair and osteoarthritis with sodium MRI. NMR Biomed. 2016; 29: 206-215.
2. Madelin G, Xia D, Brown R, et al., Longitudinal study of sodium MRI of articular cartilage in patients with knee osteoarthritis: initial experience with 16-month follow-up. Eur Radiol. 2018; 28: 133-142.
3. Insko EK, Kaufman JH, Leigh JS, et al., Sodium NMR evaluation of articular cartilage degradation. Magn Reson Med. 1999; 41: 30–34.
4. Ertürk MA, Wu X, Eryaman Y, et al., Toward imaging the body at 10.5 tesla. Magn Reson Med. 2016; 77: 434-443.
5. Nagel AM, Laun FB, Weber MA, et al., Sodium MRI using a density-adapted 3D radial acquisition technique. Magn Reson Med. 2009; 62: 1565-1573.
6. Madelin G, Jerschow A, Regatte RR, Sodium relaxation times in the knee joint in vivo at 7T. NMR Biomed. 2012; 25: 530-537.
7. van Turnhout MC, Kranenbarg S, van Leeuwen JL. Contribution of postnatal collagen reorientation to depth-dependent mechanical properties of articular cartilage. Biomech Model Mechanobiol. 2011; 10: 269-279.
8. Vaughan-Thomas A, Dudhia J, Bayliss MT, et al., Modification of the composition of articular cartilage collagen fibrils with increasing age. Connect Tissue Res. 2008; 49: 374–382.
Figures