0355
Correlation Between Single-Component and Bi-Component T2 Parameters and Proteoglycan Content and Mechanical Properties of Cartilage1Mechanical Engineering, University of Wisconsin-Madison, Madison, WI, United States, 2Radiology, University of Wisconsin-Madison, Madison, WI, United States, 3Orthopedic Surgery, University of Wisconsin-Madison, Madison, WI, United States
Synopsis
Multi-component Driven Equilibrium Single Pulse Observation of T1 and T2 (mcDESPOT) was used to measure single-component T2 relaxation time (T2Single) and the fraction of the fast relaxing macromolecular bound water component (FF) of 24 human patellar cartilage samples at 3.0T. The cartilage samples underwent mechanical testing to measure linear modulus and energy dissipation and biochemical analysis to measure proteoglycan content. There were significant (p<0.01) and moderate positive correlations between FF and proteoglycan content, linear modulus, and energy dissipation of cartilage. There were non-significant (p=0.06-0.21) and low negative correlations between T2Single and proteoglycan content, linear modulus, and energy dissipation of cartilage.
Introduction
Multi-component Driven Equilibrium Single Pulse Observation of T1 and T2 (mcDESPOT) is a rapid method for bi-component T2 mapping of the articular cartilage of the human knee joint at 3.0T, which can measure single-component T2 relaxation time (T2Single), the T2 relaxation times of the fast relaxing macromolecular bound (T2F) and slow relaxing bulk (T2S) water components, and the fraction of the fast relaxing macromolecular bound water component (FF).1,2,3 Previous studies have shown that FF is the bi-component T2 parameter with the highest sensitivity for detecting cartilage degeneration within the human knee joint.2,3 This study was performed to determine whether T2Single and FF measured using mcDESPOT at 3.0T could provide information regarding the proteoglycan content and mechanical properties of human patellar cartilage.Methods
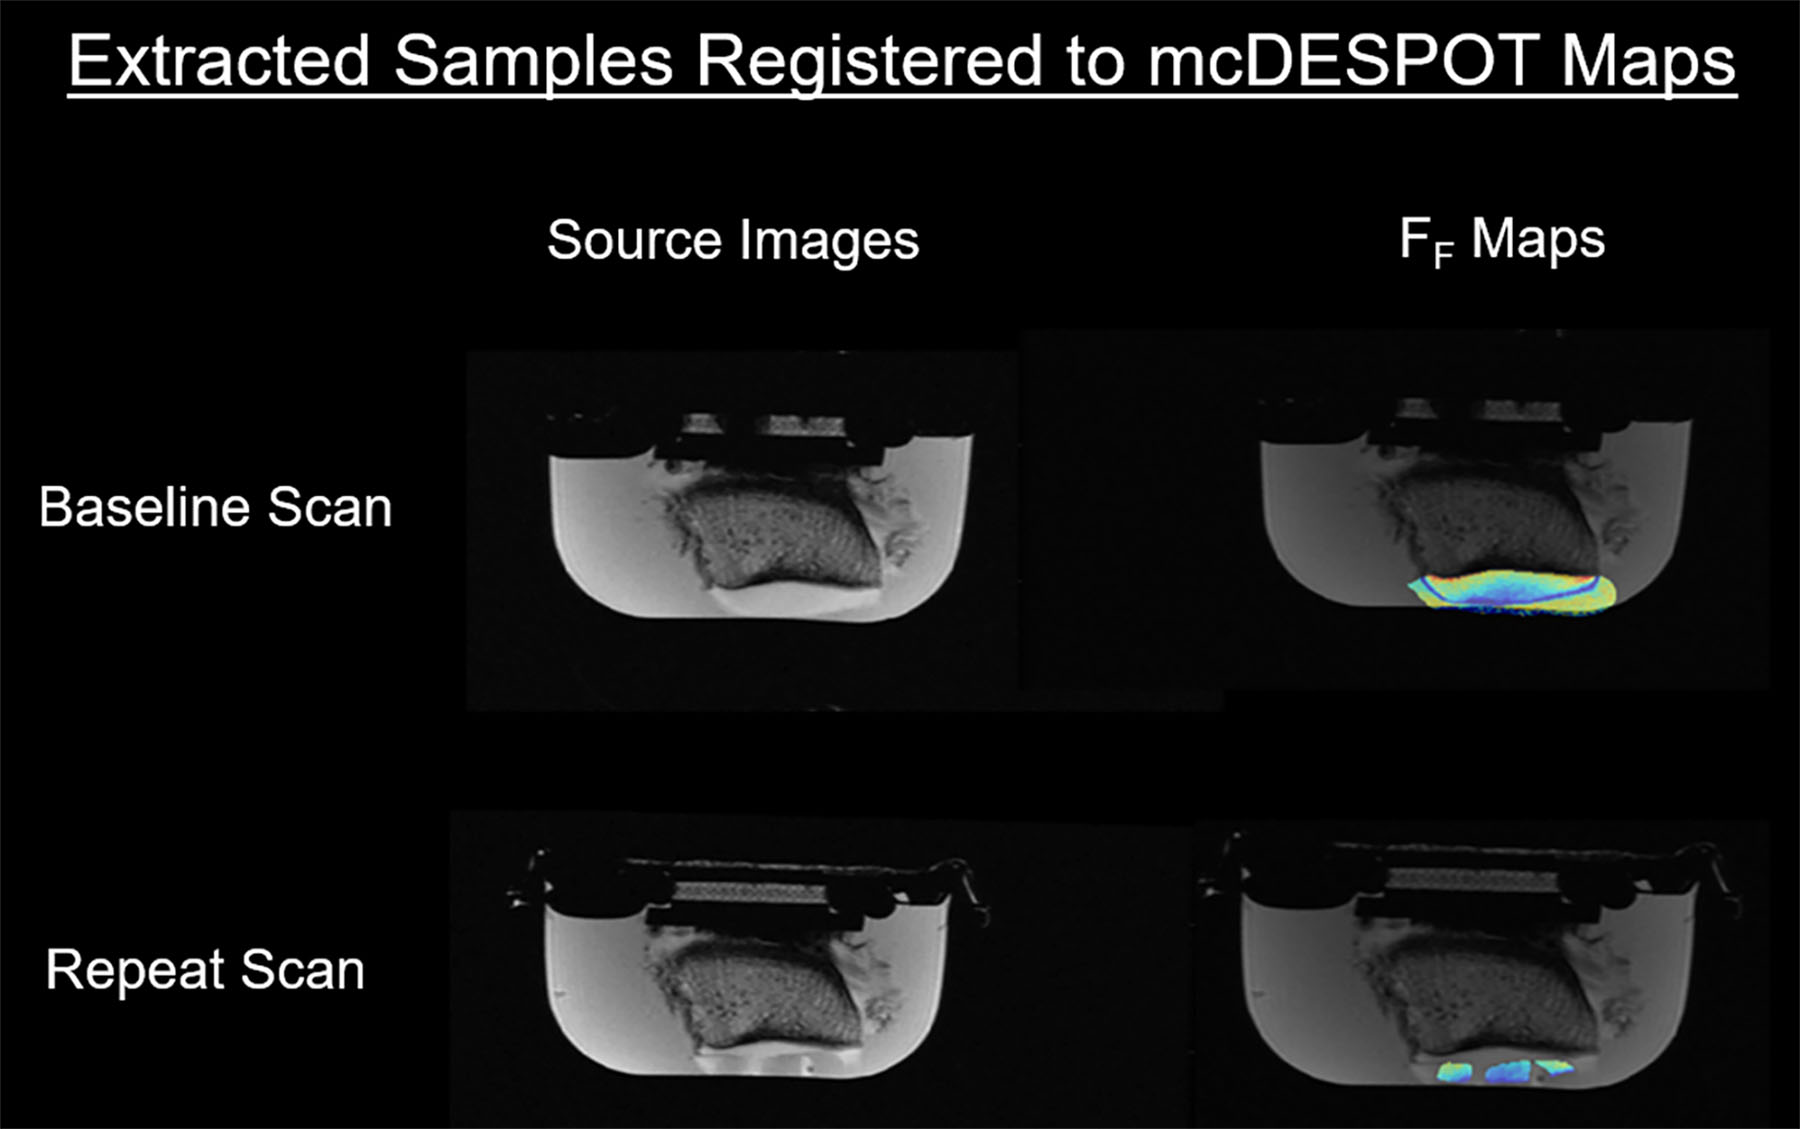
Five patellar specimens were harvested from fresh frozen human cadaveric knees. The specimens were placed in a container filled with phosphate-buffered solution and imaged on a 3.0T scanner (Discovery MR750, GE Healthcare; Waukesha, WI) using a single-channel wrist coil (Mayo Clinic, Rochester, MN). Spoiled gradient echo (SPGR) scans were acquired with TR/TE=7.2/2.9ms over a range of flip angles (α =3, 4, 5, 6, 7, 9, 13, 18°). Two fully-balanced steady-state free precession (bSSFP) scans with radiofrequency phase cycling on and off were acquired with TR/TE=6.6/3.2ms over a range of flip angles (α=2, 5, 10, 15, 20, 30, 40, 50°). An inversion recovery IR-SPGR scan with TR/TE=7.2/2.9ms, TI=450ms, and α=5° was also acquired. All scans were performed in the sagittal plane with a 14cm field of view, 700 x 240 matrix, 2mm slice thickness, and one excitation. Patellar cartilage T2Single and FF maps were reconstructed in MATLAB (MathWorks, Natick, MA) using the mcDESPOT model.1,2 Mean cartilage T2Single and FF was measured in the exact same locations on the patellar specimens where 24 cartilage samples were extracted (Figure 1). The 24 cartilage samples underwent unconfined compression under cyclic displacement to 10% strain at 0.01Hz on a test machine (3230-AT, TA Instruments, Eden Prairie, MN) to measure linear modulus and energy dissipation. A subset of 17 cartilage samples underwent biochemical analysis with proteoglycan glycosaminoglycan (GAG) content measured using the AMSBIO Proteoglycan Detection Kit (#280560-N, AMSBIO Biotechnology, Abingdon, UK). Pearson correlation coefficients were used to compare T2Single and FF and the proteoglycan content, linear modulus, and energy dissipation of the cartilage samples.Results
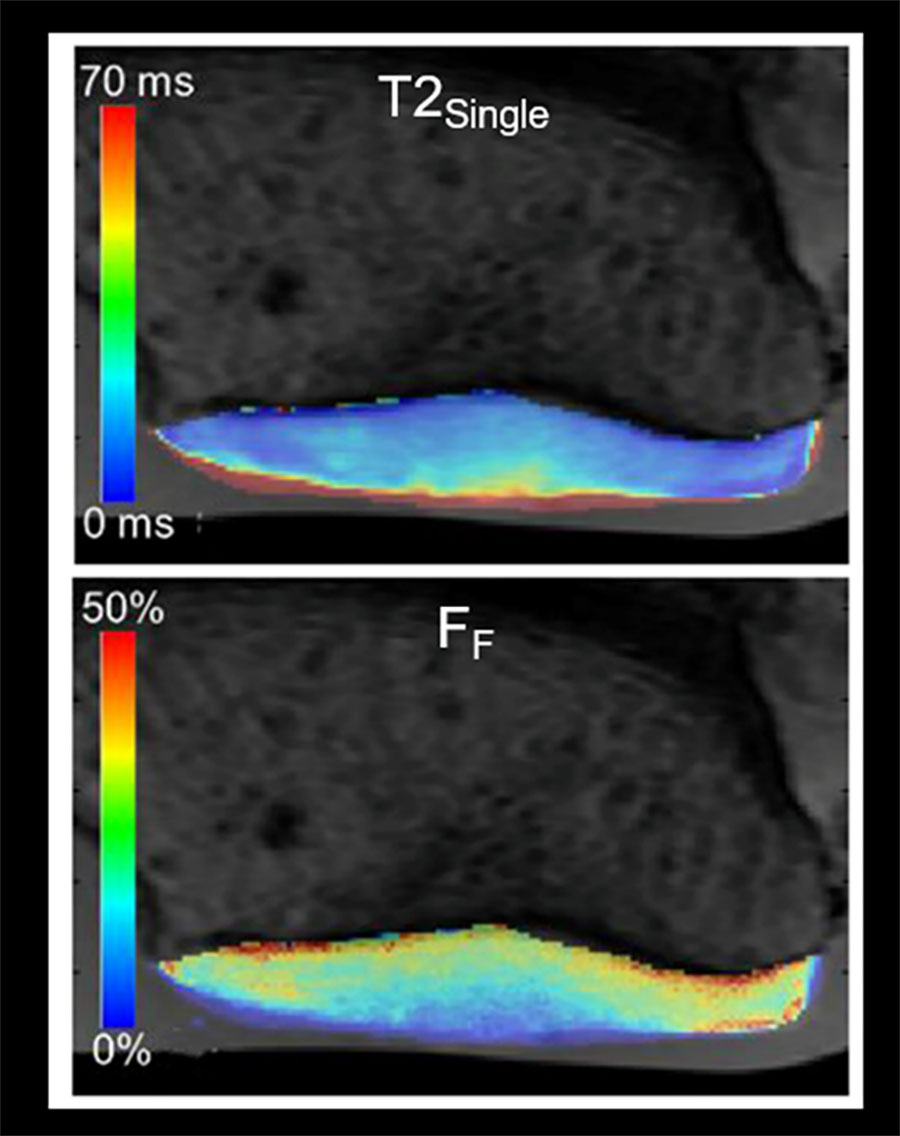
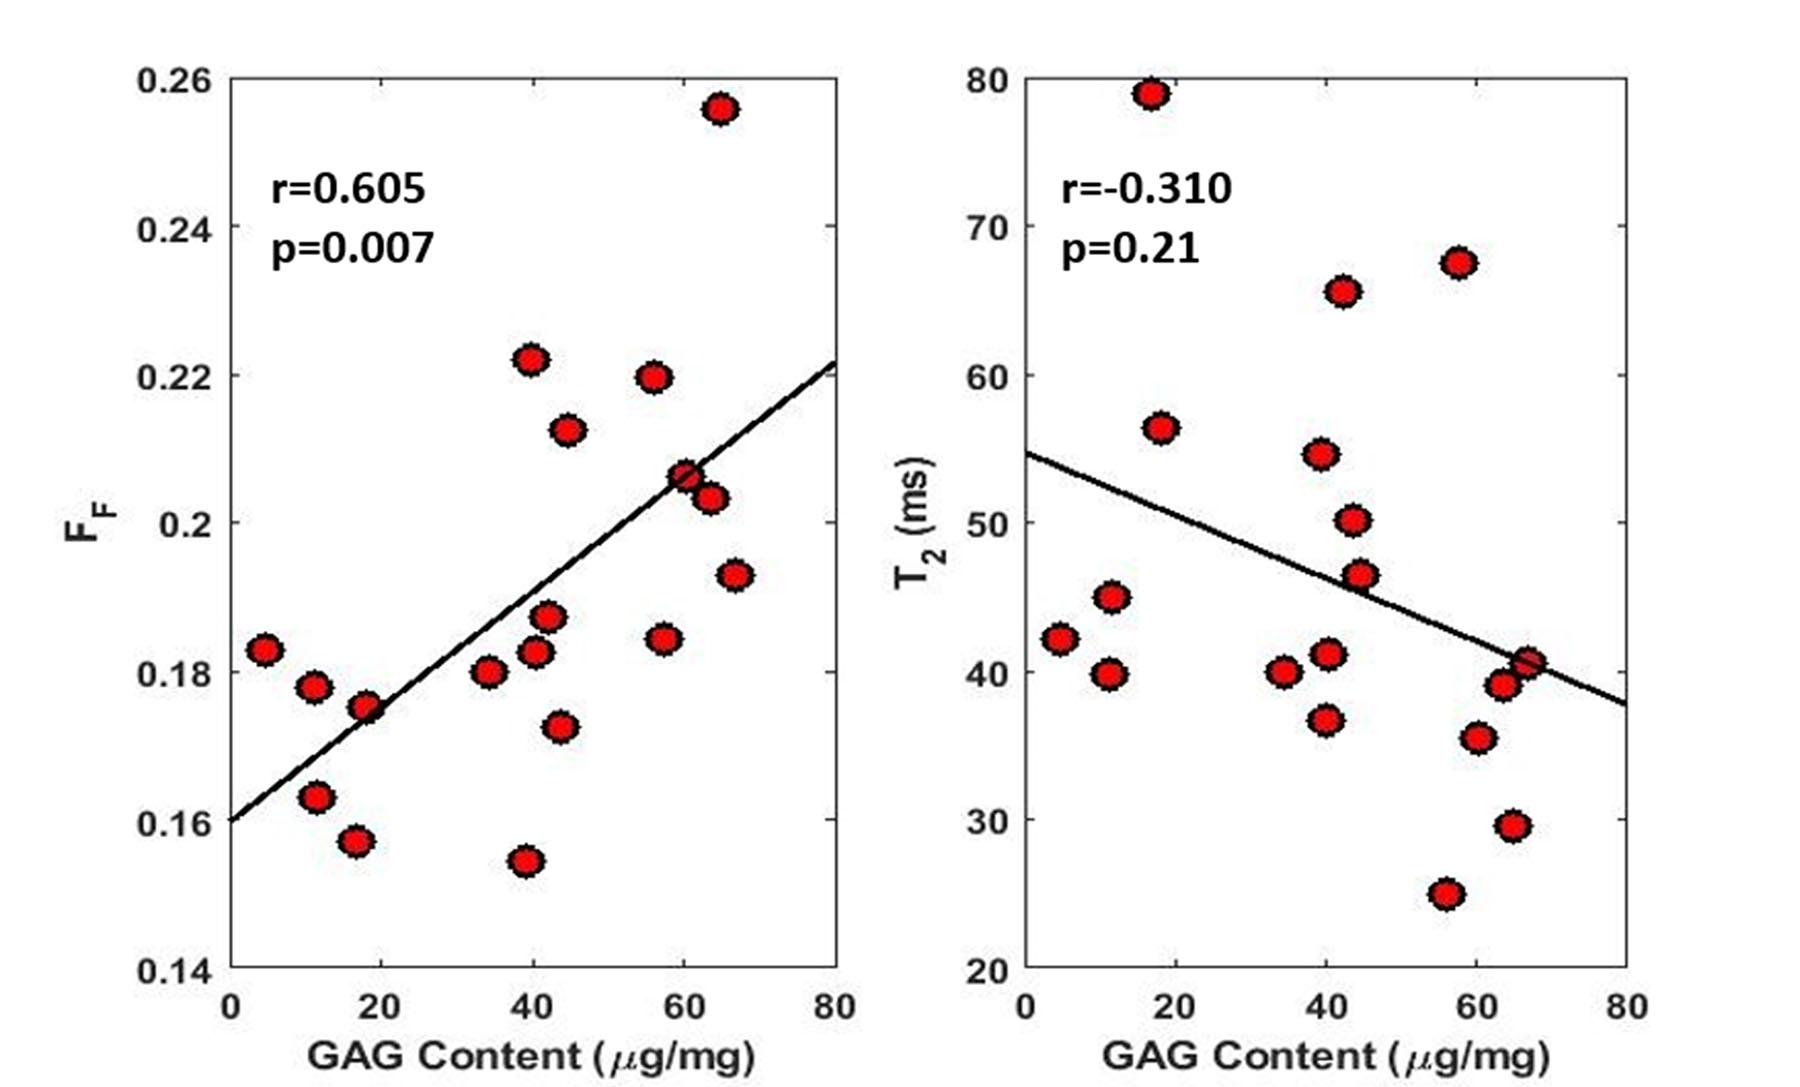
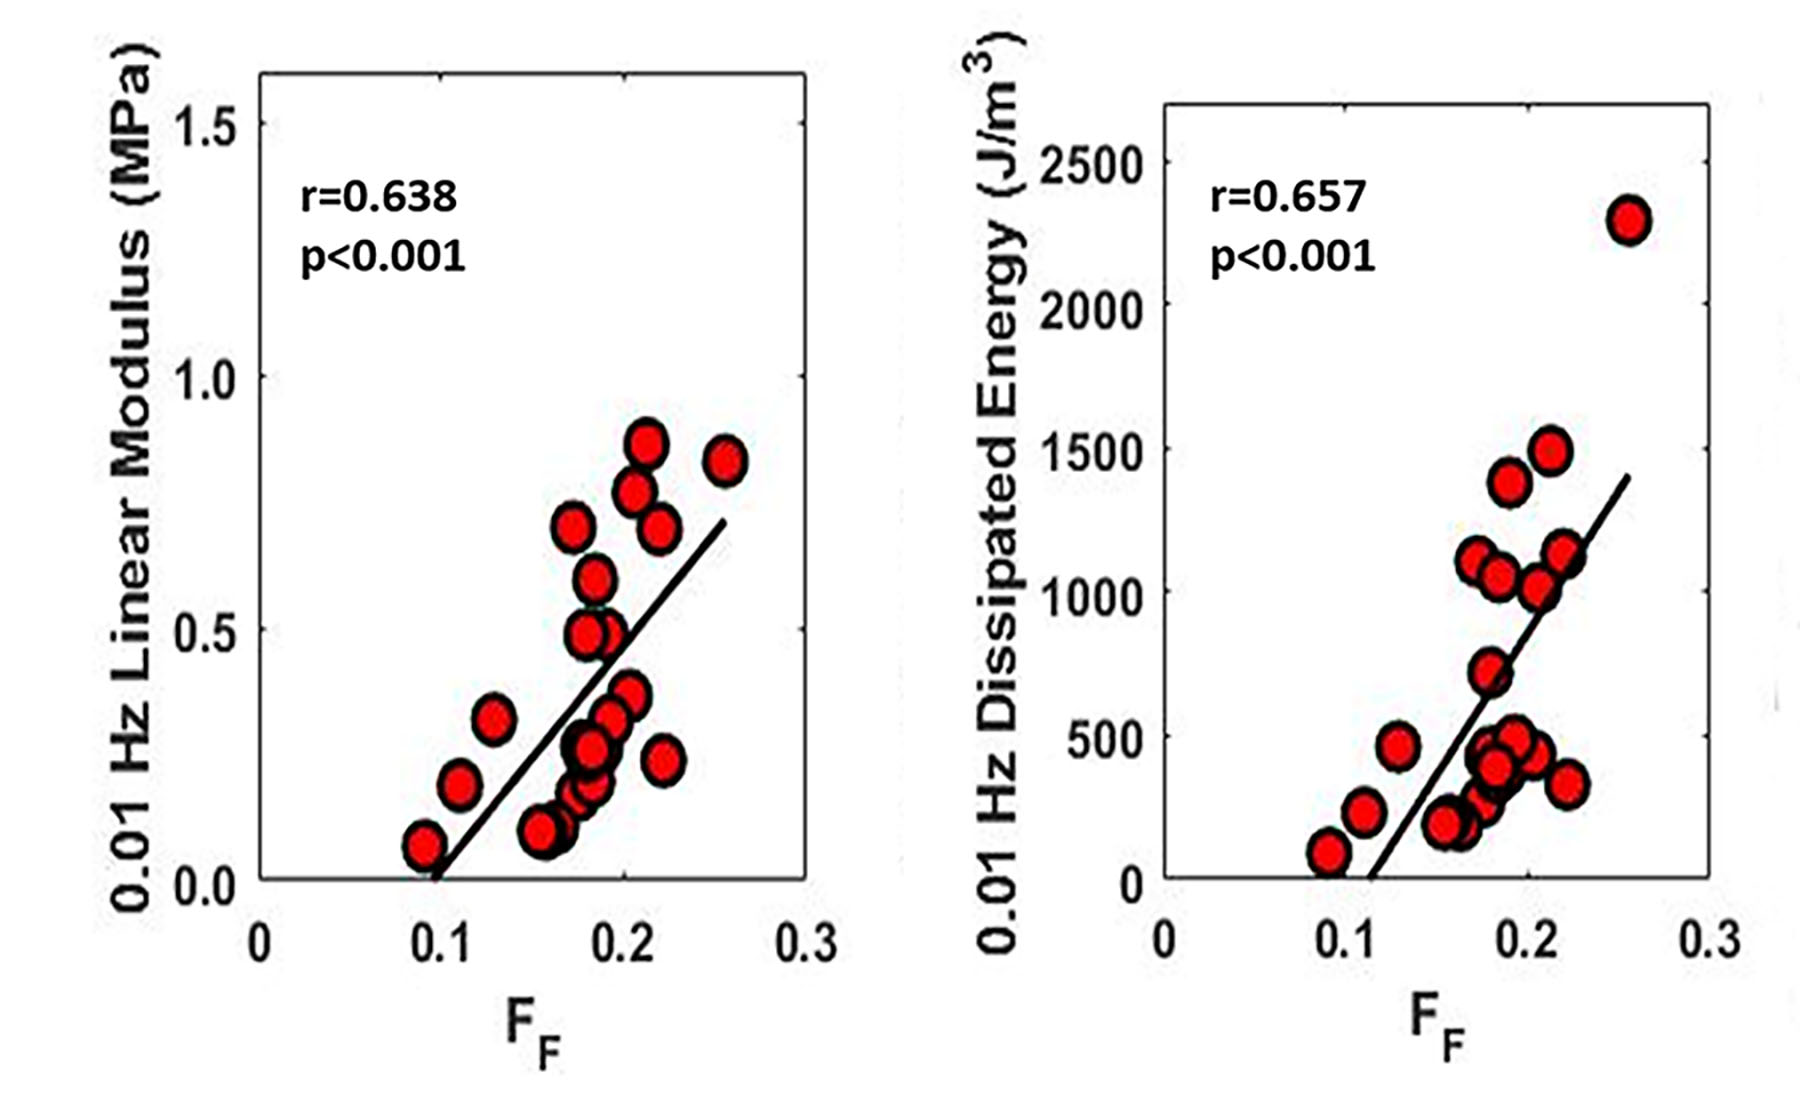
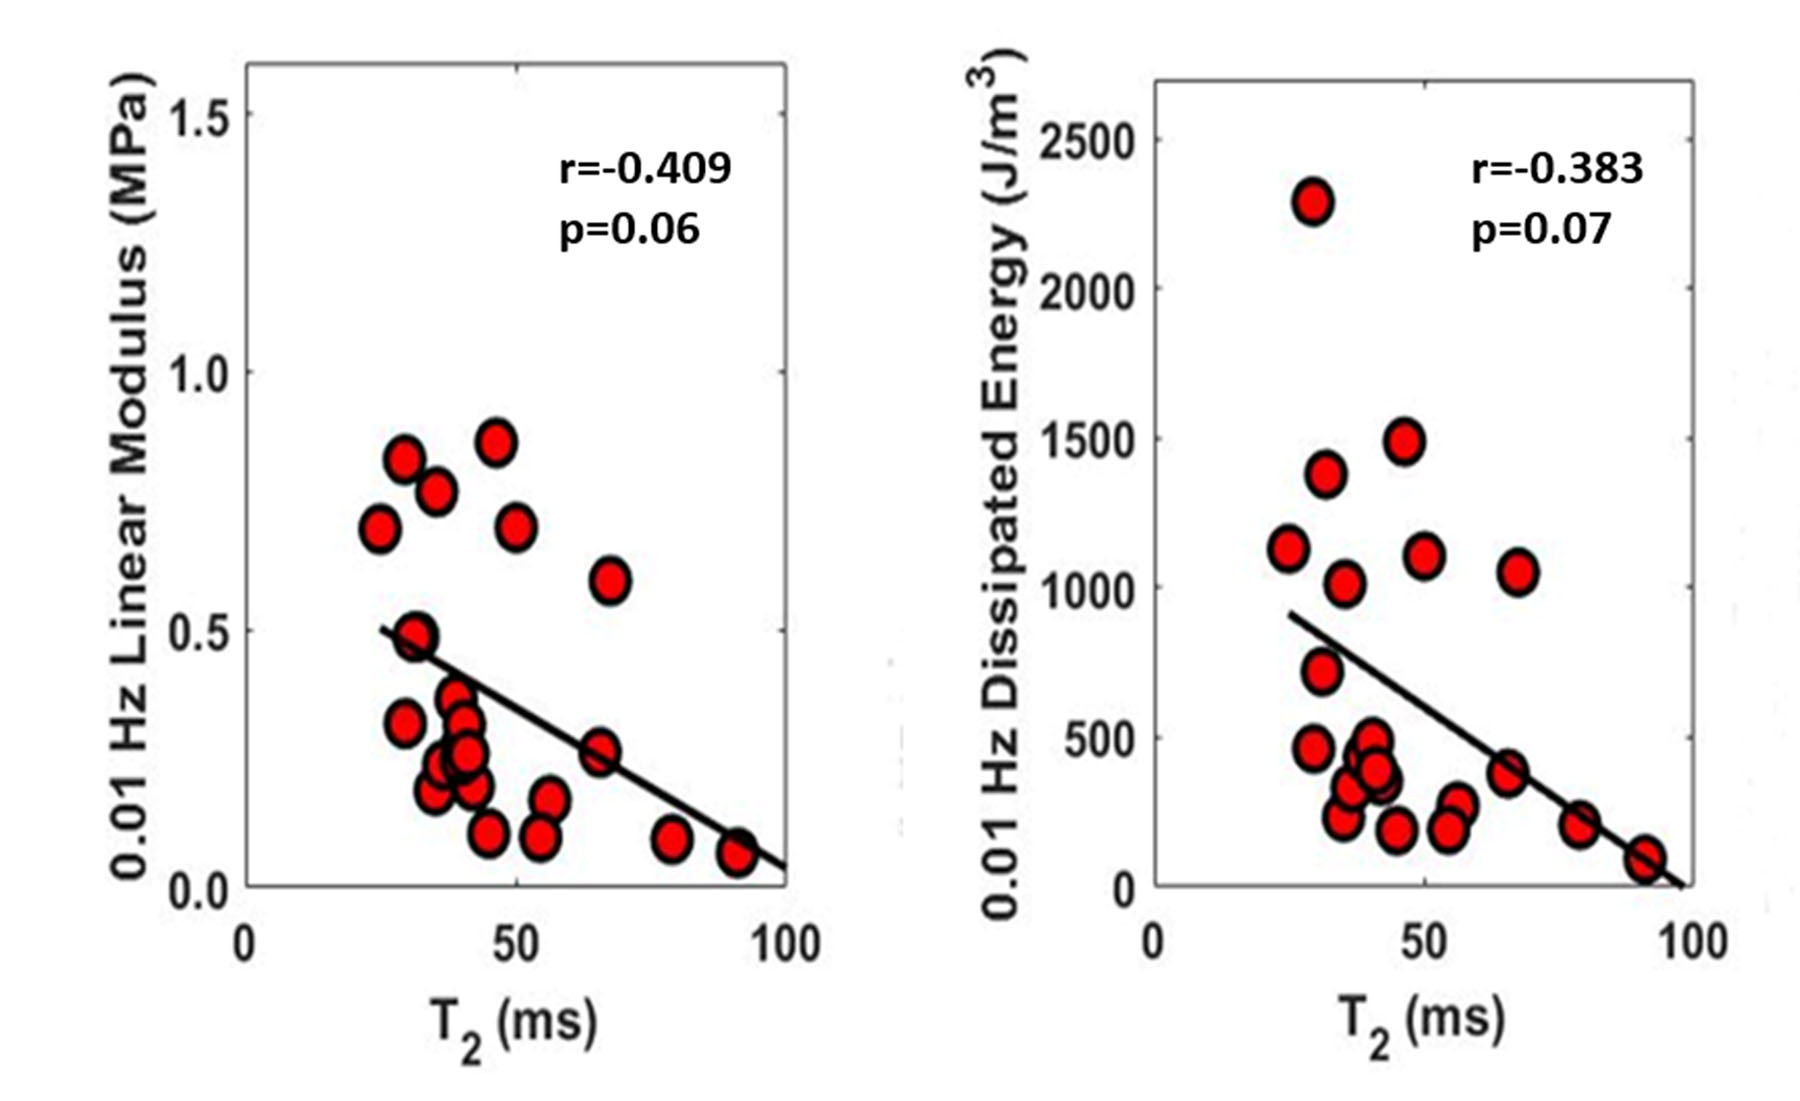
mcDESPOT acquired high-resolution cartilage T2Single and FF maps of the patellar cartilage specimens (Figure 2). There was a significant and moderate positive correlation between FF and proteoglycan content (r=0.605 and p=0.007). There was a low and non-significant negative correlation between T2Single and proteoglycan content (r=-0.310 and p=0.21) (Figure 3). There were moderate and significant positive correlations between FF and linear modulus (r=0.638 and p<0.001) and energy dissipation (r=0.657 and p<0.001) (Figure 4). There were low and non-significant negative correlations between T2Single and linear modulus (r=0.-409 and p=0.06) and energy dissipation (r=-0.383 and p=0.07) (Figure 5).Discussion
Nuclear magnetic resonance (NMR) spectroscopy has identified three water components within cartilage: water tightly bound to collagen, water tightly bound to proteoglycan, and bulk water loosely bound to the macromolecular matrix with T2 relaxation times of 2.3ms, 25.2ms, and 96.3ms respectively.4 The first echo of mcDESPOT is too short to capture signal from collagen bound water. Thus, the fast relaxing macromolecular bound water component of cartilage measured using mcDESPOT, with a T2F ranging between 13.6ms and 22.3ms, likely represents water tightly bound to proteoglycan.1 Our study confirmed this hypothesis and showed a significant (p=0.007) positive correlation between FF measured using mcDESPOT and the proteoglycan content of cartilage. Our study also found significant (p<0.001) positive correlations between FF and the linear modulus and energy dissipation of cartilage, which are mechanical properties primarily influenced by proteoglycan within cartilage. Previous studies using NMR spectroscopy have also documented significant (p<0.05) positive correlations between the fraction of proteoglycan bound water and the proteoglycan content 4,5 and mechanical properties 6 of cartilage. However, these studies have used Carr-Purcell-Meiboom-Gill sequences with extremely long scan times for single slice evaluation of ex-vivo cartilage samples on 9.7T NMR scanners.4,5,6 In contrast, mcDESPOT can perform three-dimensional bi-component T2 mapping of the articular cartilage of the human knee joint at 3.0T with high spatial resolution, large volume coverage, and clinically feasible scan times. Our study found non-significant (p=0.06-0.21) negative correlations between T2Single measured using mcDESPOT and the proteoglycan content, linear modulus, and energy dissipation of cartilage. This is likely due to the fact that T2Single is a composite measure reflecting the T2 relaxation times of all water components of cartilage and thus has limited specificity to any individual water component. A previous study has shown that FF is superior to T2Single for distinguishing between normal and degenerative cartilage within the human knee joint.2 Our study found that FF had stronger correlations with the proteoglycan content, linear modulus, and energy dissipation of cartilage than T2Single, which provides further evidence of the advantages of performing bi-component T2 mapping of cartilage.Conclusions
FF measured using mcDESPOT at 3.0T showed significant (p<0.01) and moderate positive correlations with the proteoglycan content, linear modulus, and energy dissipation of human patellar cartilage and may potentially serve as a new biomarker for proteoglycan within cartilage.Acknowledgements
Research support provided by GE Healthcare, University of Wisconsin Institute of Clinical and Translational Research, and NIAMS grant R01-AR068373.References
(1) Liu F, Chaudhary R, Hurley S, et al. Rapid multicomponent T2 analysis of the articular cartilage of the human knee joint at 3.0T. J Magn Reson Imaging. 2014; 39(5):1191-1197.
(2) Liu F, Choi K, Samsonov A, et al. Articular cartilage of the human knee joint: In vivo multi-component T2 analysis at 3.0 T. Radiology. 2015; 277(2):477-488.
(3) Kaiser J, Vignos MF, Liu F, et al. MRI assessments of cartilage mechanics, morphology and composition following reconstruction of the anterior cruciate ligament. Clin Biomech. 2016; 34:38-44.
(4) Reiter D, Lin P, Fishbein K, et al. Multi-component T2 relaxation analysis in cartilage. Magn Reson Med. 2009; 61(4):803-809.
(5) Reiter D, Roque R, Lin P, et al. Mapping proteoglycan-bound water in cartilage: Improved specificity of matrix assessment using multi-exponential transverse relaxation analysis. Magn Reson Med. 2009; 62(5):1311-1318.
(6) Irrechukwu O, Von Thaer S, Frank E, et al. Prediction of cartilage compressive modulus using multi-component analysis of T2 relaxation data and support vector regression. NMR Biomed. 2014; 27(4):468-477.
Figures