0354
Collagen fiber anisotropy and orientation mapping of articular cartilage via T2 relaxation anisotropy1University of Eastern Finland, Kuopio, Finland, 2University of Oulu, Oulu, Finland
Synopsis
Number of studies have investigated the orientation dependence of T2 relaxation in articular cartilage and, more importantly, connected the orientation dependence to the properties of the collagen fiber network in cartilage. The dependence arises from the non-averaging secular part of the dipolar coupling, which in turn has been attributed to the water-orienting properties of the collagenous network. Using high angular resolution sample rotation, this study aimed to measure the in-plane fiber angle, collagen anisotropy as well as the isotropic and anisotropic components of T2 relaxation in cartilage. Potential for extracting physically meaningful properties of cartilage from multi-orientation measurements was demonstrated.
Introduction
T2 Relaxation anisotropy in highly ordered tissues, such as cartilage have been reported previously 1-4 and ascribed to the residual dipolar coupling. The relaxation anisotropy of T2 can be considered a source of artifact, but it could also be leveraged to obtain relevant information. The isotropic and anisotropic components of the T2 relaxation can be separated 3, given enough data. A measurement that allows separation of the components can also be used to estimate the structural anisotropy of the tissue constituents that give rise to the relaxation anisotropy 1. In articular cartilage, anisotropy is closely reflective of the structure and integrity of the collagenous network. The purpose of this study was to utilize high angular resolution sample rotation measurements to separate the isotropic and anisotropic relaxation components, and to estimate the properties of the collagen fiber network in articular cartilage.Methods
An articular cartilage-bone plug (d = 6mm) was prepared from the patella of a bovine knee joint purchased from a local grocery store. The sample was frozen for 24h at -22°C prior to MRI experiments. A specimen holder allowing re-orientation of the sample from outside the scanner was utilized. The holder was coupled to a motorized Arduino-controlled device that was triggered by the pulse sequence to rotate the specimen by a pre-defined amount of degrees against the B0 direction. The samples were immersed in perflouropolyether (Galden HS 240, Solvay Solexis, Italy) to provide a clean 1H-signal free background. The scanning was conducted at 9.4T using VnmrJ 3.1 Varian/Agilent DirectDrive console (Varian Associates Inc., Pala Alto, CA, USA) and a 19-mm quadrature RF volume transceiver (RAPID Biomedical GmbH, Rimpar, Germany). With the automated rotation device, the sample was scanned at 39 orientations along a single plane, spanning 0-180° with respect to B0. An FSE sequence with 1-mm slice, FOV=17x17mm and matrix (ROxPE)=256x256 was used with CPMG-T2 preparation (TE=4, 8, 16, 32, 64 and 128ms, IPD=1ms, ETL=8, echo spacing=6.14ms and TR=5s) and for MESE-T2 (TE1/DTE/TEn=8.14/8.14/81.4 ms, ETL=1, TR=3s) measurements. Additionally, B0-maps were collected at each orientation. The total scan time was approximately 23 hours. The data obtained at the different orientations were co-registered with the first orientation using Elastix software 5. After co-registration, pixel-wise T2 relaxation time maps and a relaxation anisotropy map was calculated 1. Utilizing the anisotropy map, ROIs were defined for superficial (SZ), transitional (TZ) and radial zones (RZ). Furthermore, depth-wise relaxation time profiles over the cartilage were calculated from the center of the specimen over an approximately 1.4mm wide column. The T2 relaxation rates over the orientations were then fitted pixel-wise with R2 = R2i + R2a*[(3cos^2( theta + c) -1)]^2 3, where R2i is the isotropic component of T2 relaxation rate (=1/T2), R2a is the anisotropic component, theta is the nominal orientation of the specimen taken from the co-registration transform parameters, and c is the phase shift of the angle 3. The fit provides estimates of the components of the T2 relaxation as well as an estimate of the fiber angle with the phase shift.Results
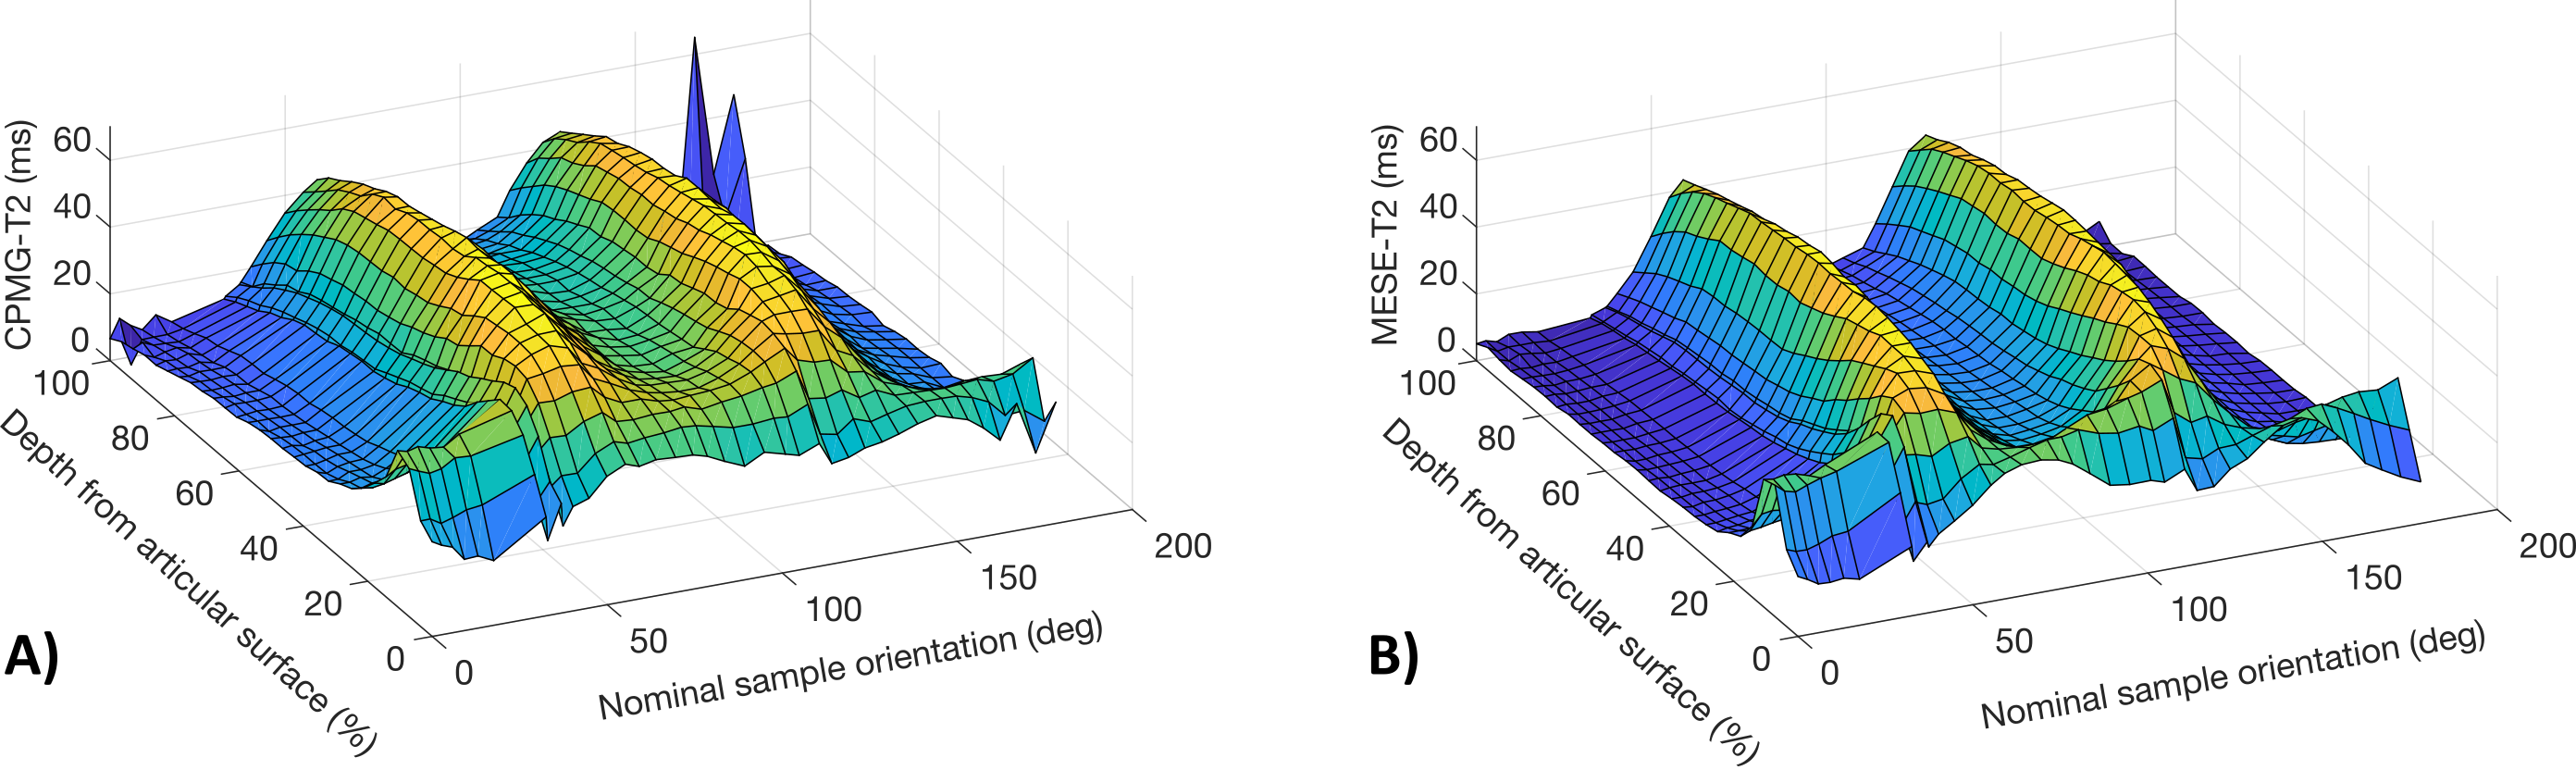
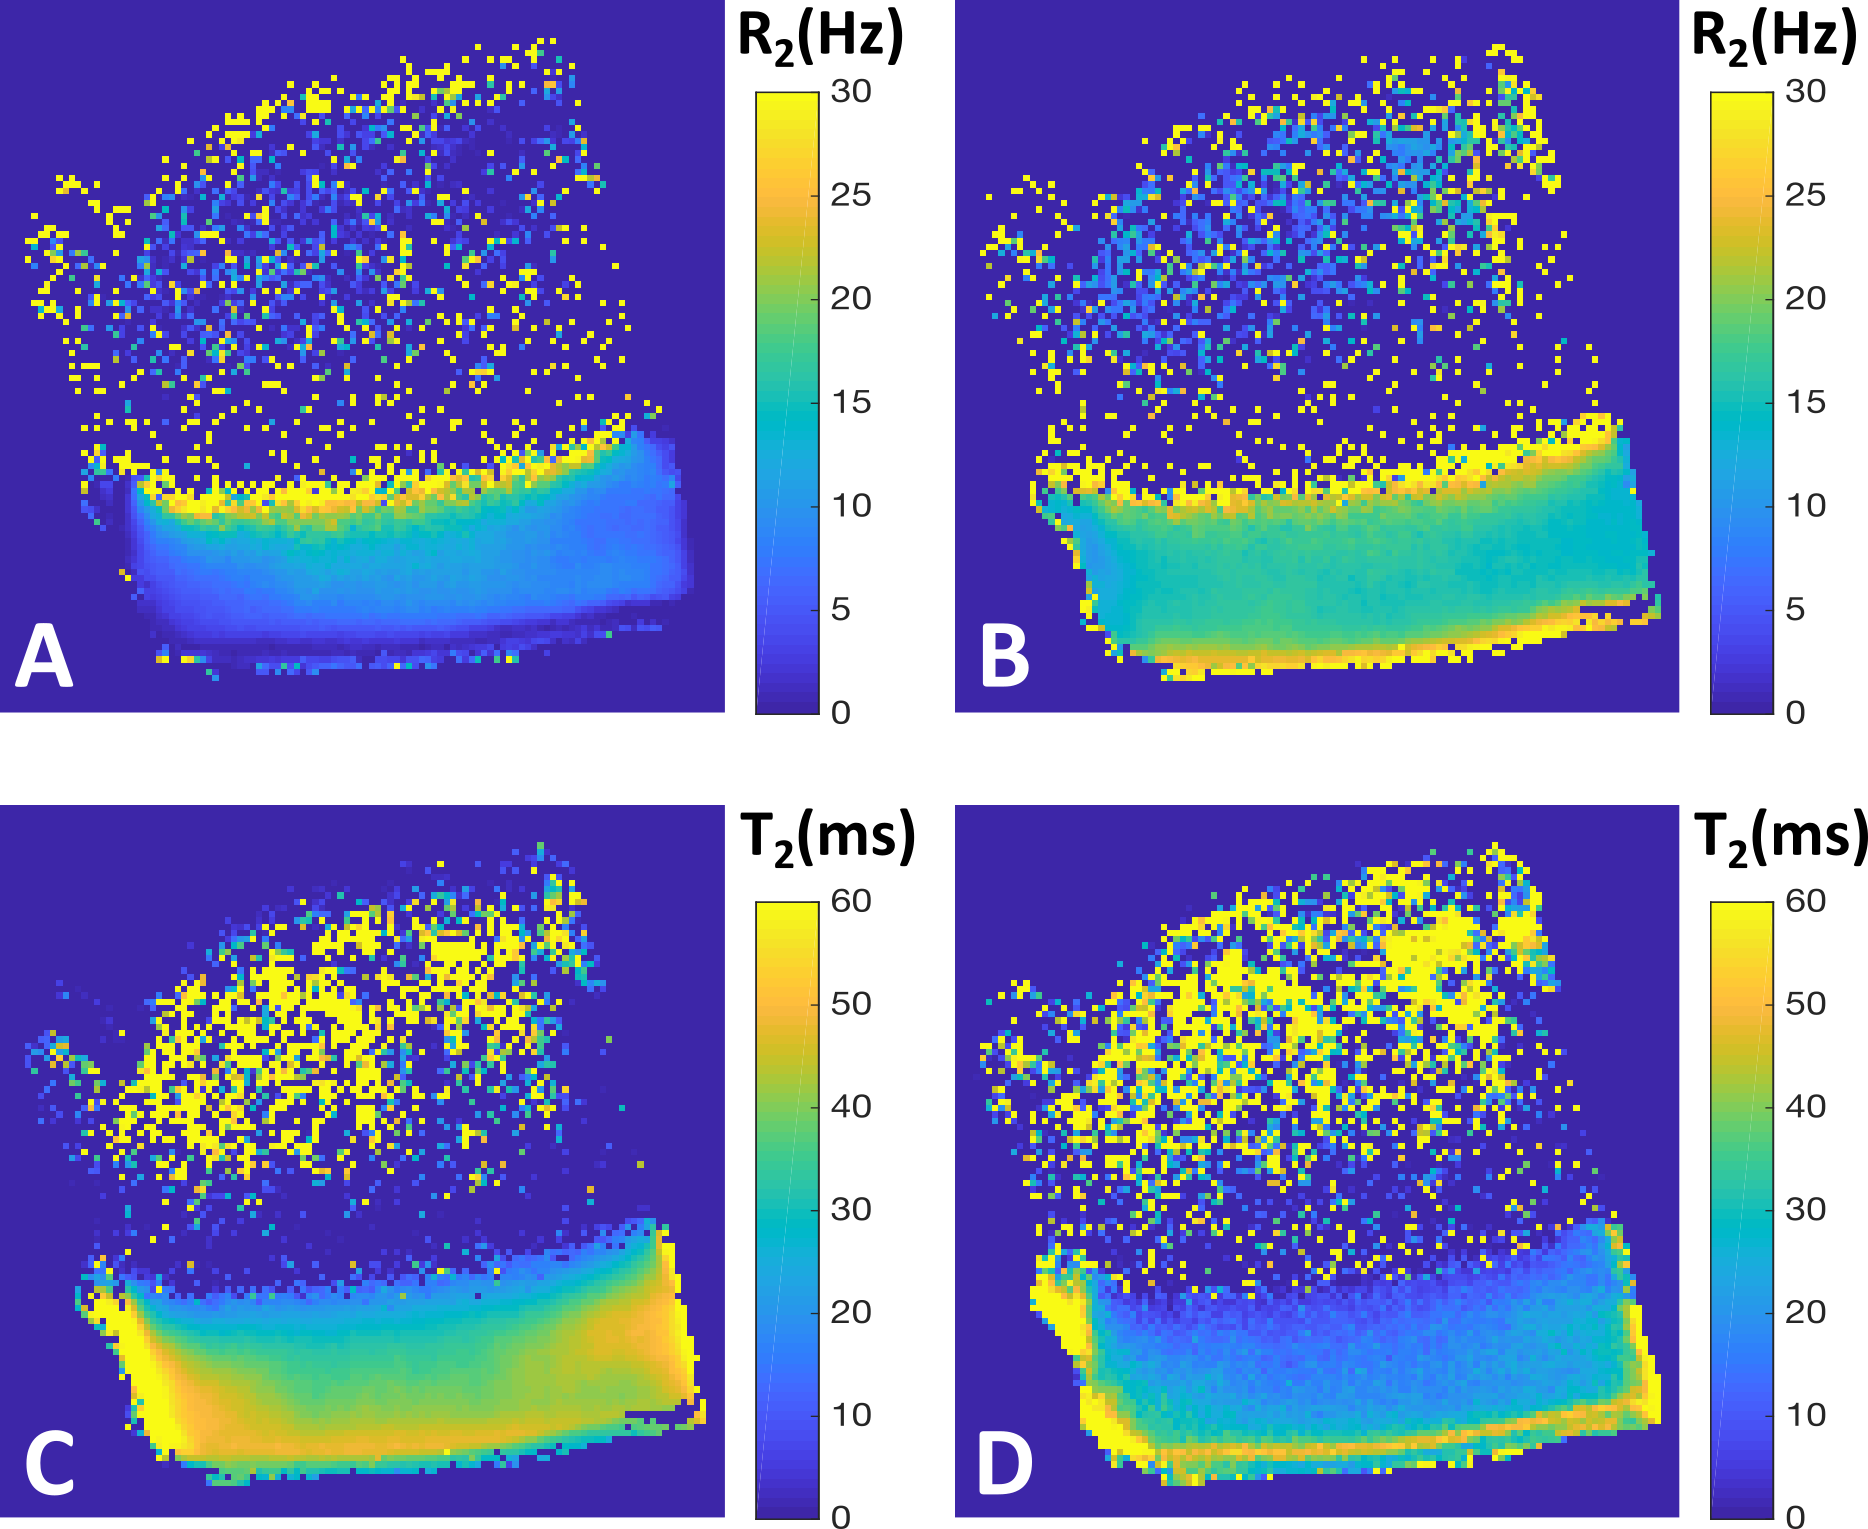
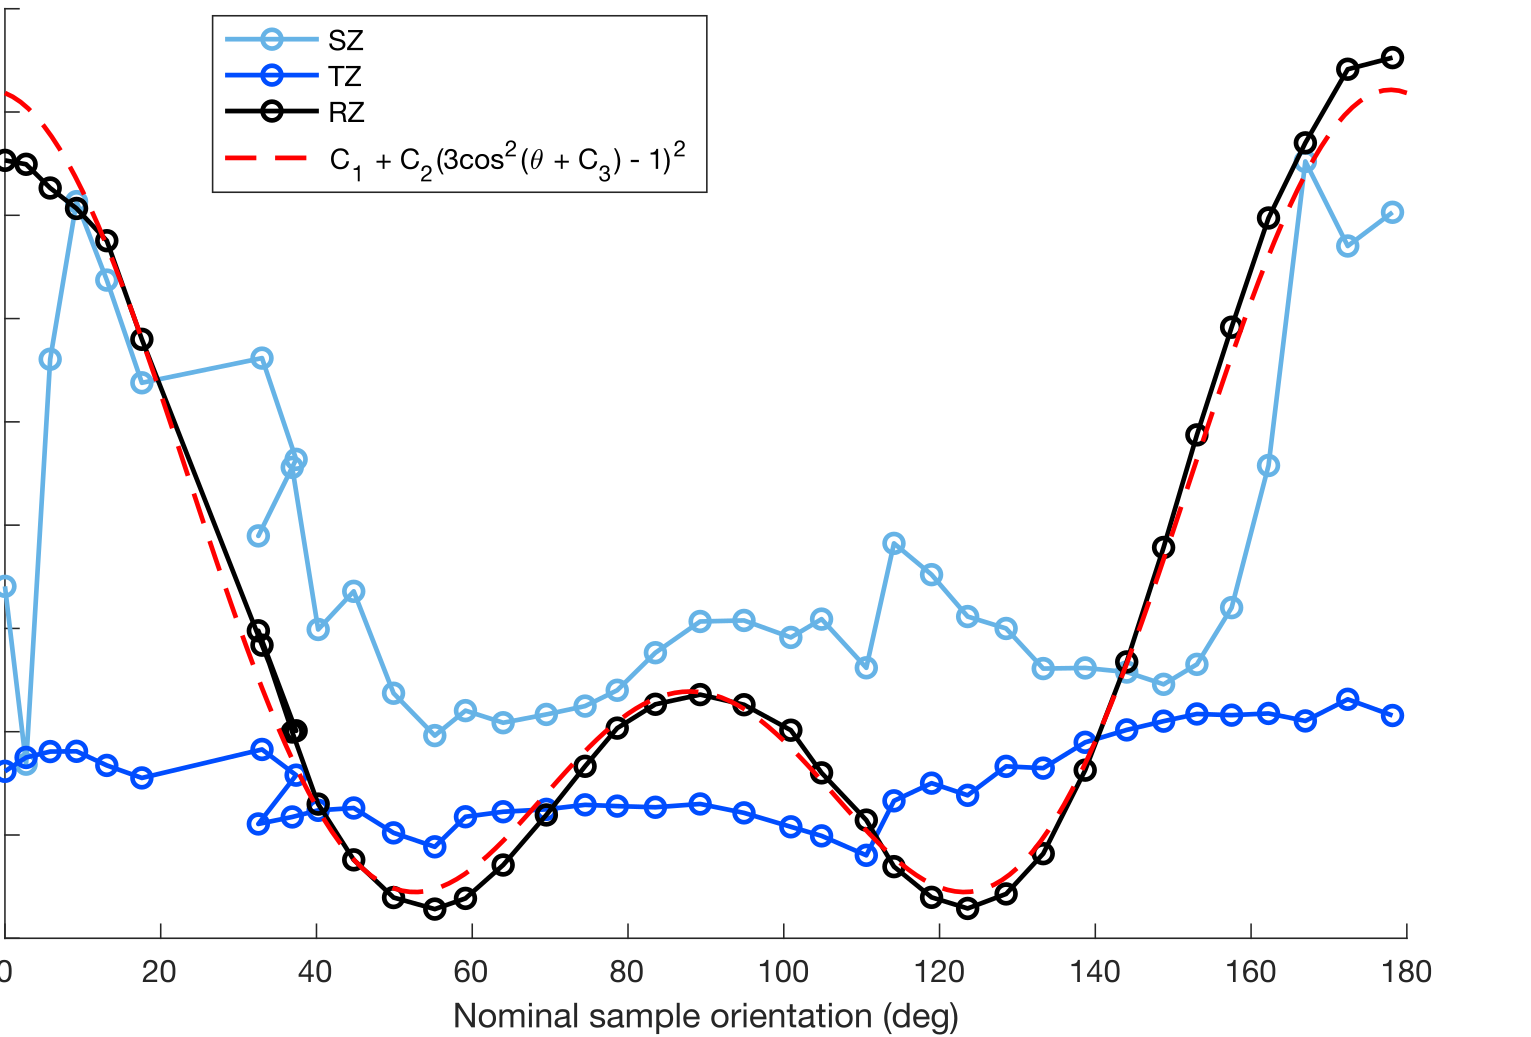
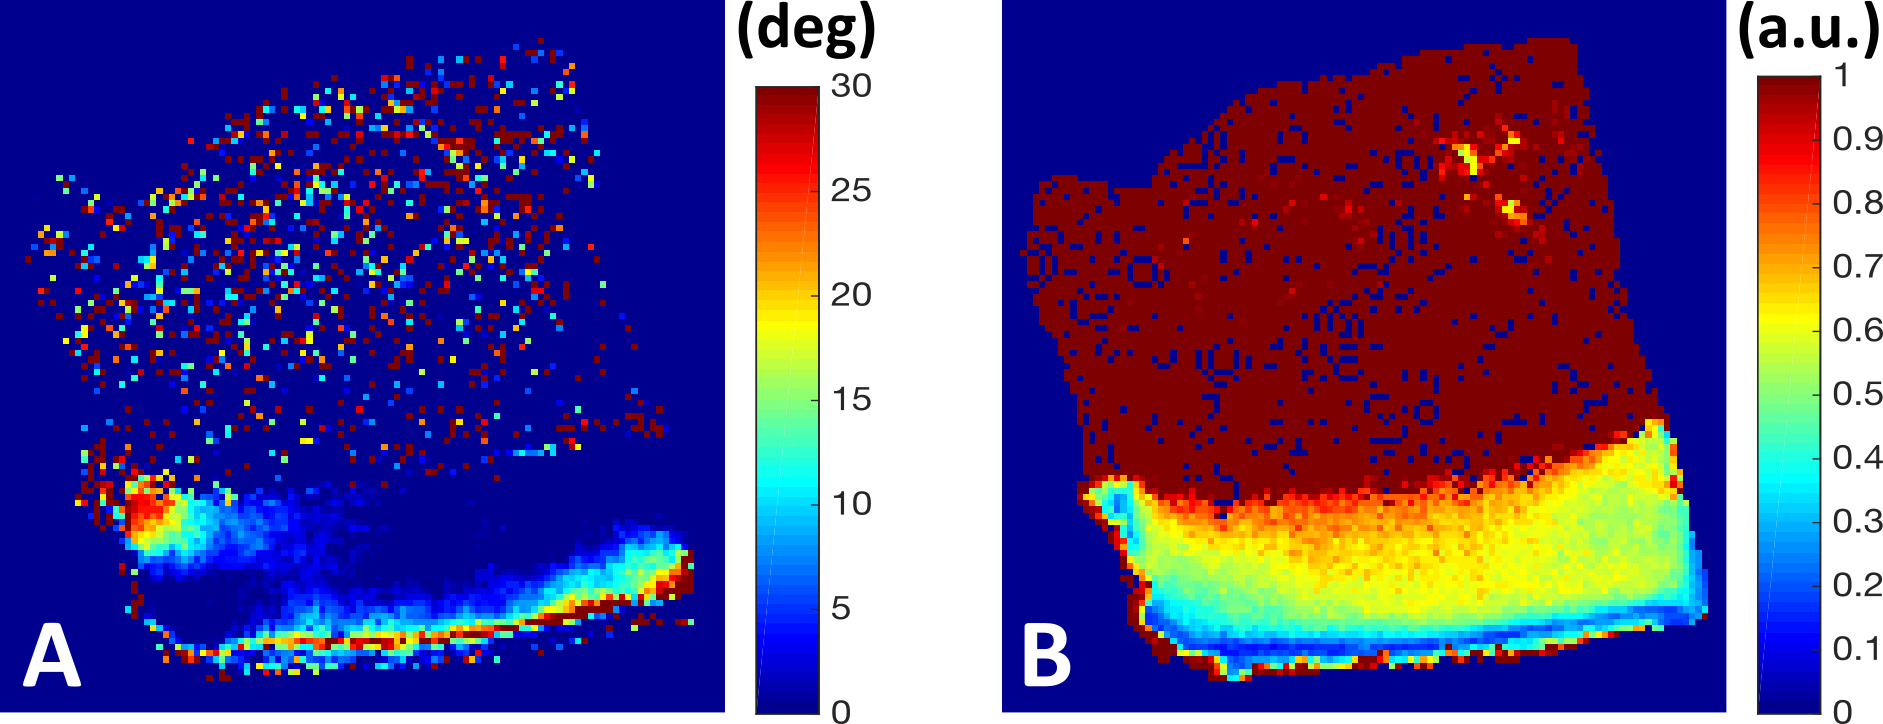
The depth-wise relaxation time profiles over the 180 degrees for CPMG-T2 and MESE-T2 both showed the well-known magic angle behavior 6, with the RZ exhibiting the largest changes (Fig. 1). The anisotropic R2 relaxation component was fastest in the deep cartilage and slowest around the transitional and superficial zone, while the isotropic R2 component appeared relatively flat through the cartilage depth with faster relaxation at the deepest and most superficial layers (Fig. 2A-B). Combination of the anisotropic and isotropic components into overall T2 relaxation (Fig. 2C) demonstrated depth-wise variation, but different from single-orientation T2 relaxation (0°, Fig. 2D). ROI-wise average relaxation times over the orientations also clearly depicted the differences between the zones and demonstrated the match with the theoretical fit (Fig. 3). The fitted fiber angle map (Fig. 4A) appeared qualitatively similar to previously reported collagen fiber angle maps 7, although the orientation did not span the expected 0-90 degrees. The relaxation anisotropy map (Fig. 4B) appeared highly similar to previously reported collagen fiber anisotropy (parallelism) maps 7.Discussion and conclusions
The aim of the study was to investigate the T2 relaxation anisotropy in articular cartilage at high angular resolution to allow estimation of the physical properties of the tissue. While the histological analysis of the samples is underway, the relaxation anisotropy and to lesser extent the fiber orientation maps appeared consistent with previously reported polarized light microscopy maps for articular cartilage 7. The fitted overall T2 relaxation time map differed from the T2 relaxation time map measured at a single orientation, which is expected as the former represents orientation independent T2 relaxation. The study is limited by the very small number of specimens (though additional specimens measured at lower angular and spatial resolution demonstrated the same features), and the lengthy scanning protocol. Another limitation is the requirement for sample rotation, which is possible ex vivo, but only to some extent in vivo 8. However, the results indicated potential for extracting physically meaningful information from cartilage in non-invasive manner. The feasibility of the orientation-independent T2, as calculated from series of orientations, to serve as a biomarker warrants further research.Acknowledgements
Support from the Academy of Finland (grants #285909, #319440 and #325146) is gratefully acknowledged.References
1. Hanninen N, Rautiainen J, Rieppo L, Saarakkala S, Nissi MJ. Orientation anisotropy of quantitative MRI relaxation parameters in ordered tissue. Sci Rep 2017;7(1):9606. doi: 10.1038/s41598-017-10053-2.
2. Xia Y. Relaxation anisotropy in cartilage by NMR microscopy (muMRI) at 14-microm resolution. Magn Reson Med 1998;39(6):941-949.
3. Momot KI, Pope JM, Wellard RM. Anisotropy of spin relaxation of water protons in cartilage and tendon. NMR Biomed 2010;23(3):313-324. doi: 10.1002/nbm.1466.
4. Nieminen MT, Nissi MJ, Hanni M, Xia Y. Physical properties of cartilage by relaxation anisotropy. In: K XYM, editor. Biophysics and Biochemistry of Cartilage by NMR and MRI: Royal Society of Chemistry; 2017.
5. Klein S, Staring M, Murphy K, Viergever MA, Pluim JP. elastix: a toolbox for intensity-based medical image registration. IEEE Trans Med Imaging 2010;29(1):196-205. doi: 10.1109/TMI.2009.2035616.
6. Xia Y, Moody JB, Alhadlaq H. Orientational dependence of T2 relaxation in articular cartilage: A microscopic MRI (microMRI) study. Magn Reson Med 2002;48(3):460-469.
7. Rieppo J, Hallikainen J, Jurvelin JS, Kiviranta I, Helminen HJ, Hyttinen MM. Practical considerations in the use of polarized light microscopy in the analysis of the collagen network in articular cartilage. Microsc Res Tech 2008;71(4):279-287.
8. Casula V, Aro OP, Paakkari P, Zbyn S, Nevalainen M, Nissi MJ, Nieminen MT. Magic-Angle Effect on In Vivo T2 Mapping of Cartilage. 2019; Montreal, QC, Canada. p 0419.
Figures