0353
Bilateral Femoral Cartilage T2 Asymmetry Analysis for the Detection of Early Osteoarthritic Degeneration1Radiology, Stanford University, Stanford, CA, United States, 2Mechanical Engineering, Stanford University, Stanford, CA, United States, 3Massachusetts General Hospital, Boston, MA, United States, 4Mechanical Engineering, University of Saskatchewan, Saskatoon, SK, Canada, 5Bioengineering, Stanford University, Stanford, CA, United States, 6Electrical Engineering, Stanford University, Stanford, CA, United States
Synopsis
There is a pressing need for a single-time-point quantitative measure capable of predicting osteoarthritic change. Bilateral knee imaging with T2 cluster asymmetry analysis is a promising approach to achieve this goal. This study examines T2 cluster asymmetry in ACL-injured subjects and controls. ACL-injured subjects showed elevated T2 cluster asymmetry 9-months following reconstruction surgery relative to the controls in the superficial half of cartilage. This novel approach for analyzing T2 relaxation times in femoral cartilage shows promise in detecting changes that may be indicative of early osteoarthritis onset.
Introduction
T2 cluster analysis has been implemented to examine focally elevated T2 relaxation times between time-points following ACL-injury, showing significant differences between controls and injured subjects1,2. While this approach is appropriate for examining longitudinal change compared to an earlier scan for reference to identify clusters of altered T2, it would be advantageous to obtain measures of osteoarthritis at a single scan time. As gait asymmetry has been shown to be present in mild and moderate knee osteoarthritis compared to healthy controls3, the T2 cluster approach may similarly be able to detect inter-knee differences indicative of osteoarthritis. ACL-injured subjects are ideal for studying osteoarthritic changes due to their heightened risk of osteoarthritis3,4 and known time of acute injury. The objective of this study was to determine if T2 asymmetry clusters can be used to detect differences between ACL-injured subjects and healthy controls, and if the T2 cluster asymmetry varies over time for ACL-injured subjects.Methods
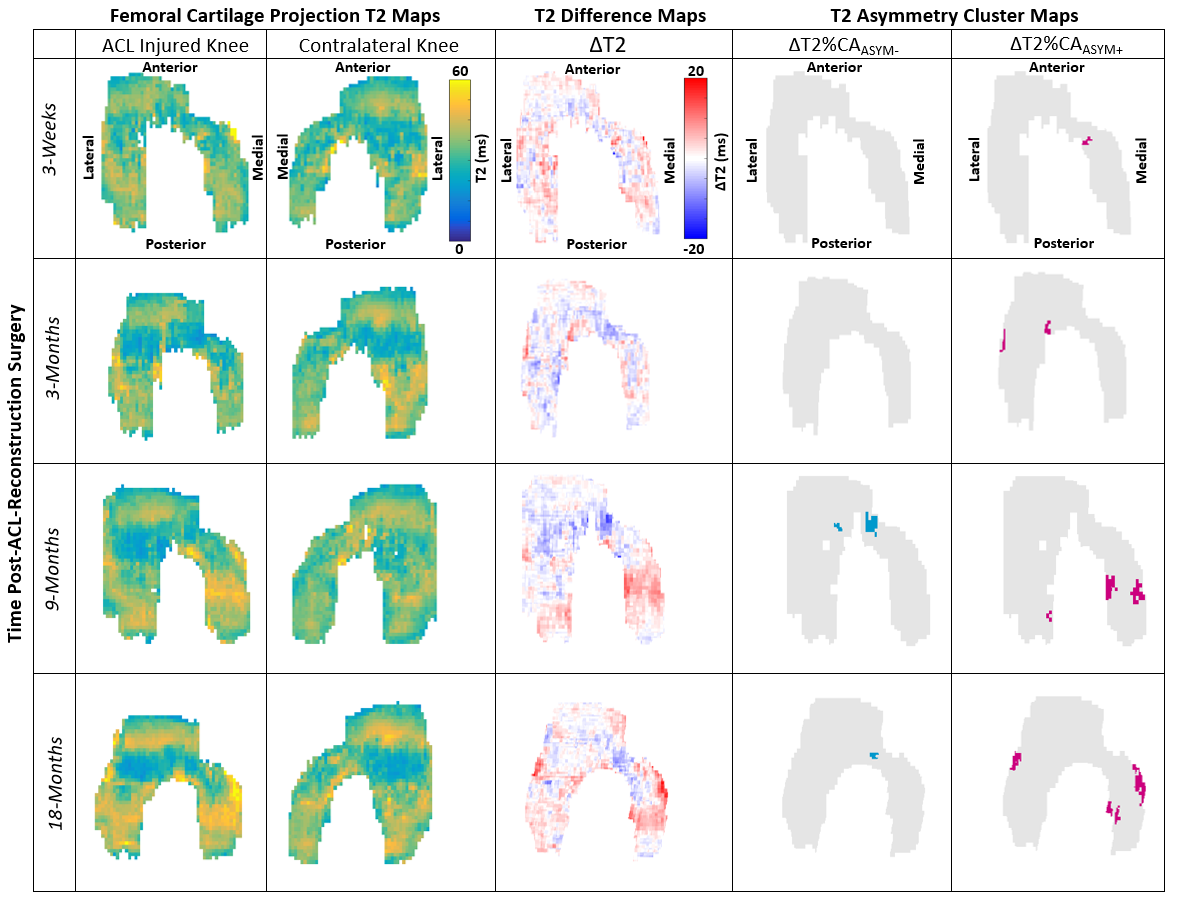
10 ACL-reconstructed subjects (5W/5M, 39±12 yrs, BMI: 23±1.5) and 5 controls (1W/4M, 34±12 yrs, BMI: 24±1.7) were included in this study. Both the ACL-reconstructed and contralateral knees were scanned at 4 time-points: 3-weeks, 3-months, 9-months, and 18-months post-ACL-reconstruction. The right and left knee of the controls were each scanned once.All images were acquired at 3T using a quantitative double-echo in steady-state (qDESS) sequence (5-minutes per knee). T2 relaxation times were calculated from the two qDESS echoes using an analytical model6. Femoral cartilage T2 projections were created by fitting a cylinder (axis medial-to-lateral) to the manually segmented cartilage and radially projecting the data into angular bins1. Deep and superficial cartilage layers were created using the midpoint of cartilage2. The T2 projections for the contralateral knee of the ACL-injured subjects were flipped right-left and subsequently registered to the ACL-injured knee. The same method was applied to the left knee and registered to the right knee for controls. Difference maps were created by subtracting the contralateral or left knee (for controls) cartilage projection maps from the ACL-injured and right knee, respectively (Figure 1). Asymmetry T2 clusters in these difference maps were quantified as a contiguous set of pixels with an area greater than 12.4mm2 consisting of absolute values greater than twice the standard deviation of the control subjects’ asymmetry difference maps3 (Figure 1).
Our outcome was reported as the change in T2 asymmetry percent cluster area (ΔT2%CAASYM), defined as the area of all positive clusters (elevated T2) and negative clusters (decreased T2) of pixels that met the defined thresholds scaled by the total femoral cartilage area. A general linear model with Bonferroni’s correction was used to test for differences in ΔT2%CAASYM between ACL-injured and control subjects (α<0.05). The ΔT2%CAASYM was analyzed to also compare separately the positive clusters ΔT2%CAASYM+ (elevated T2 clusters) and negative clusters ΔT2%CAASYM- (decreased T2 clusters) in ACL-injured knee relative to the contralateral knee at all time-points using a general linear model with Bonferroni’s correction (α<0.05).
Results
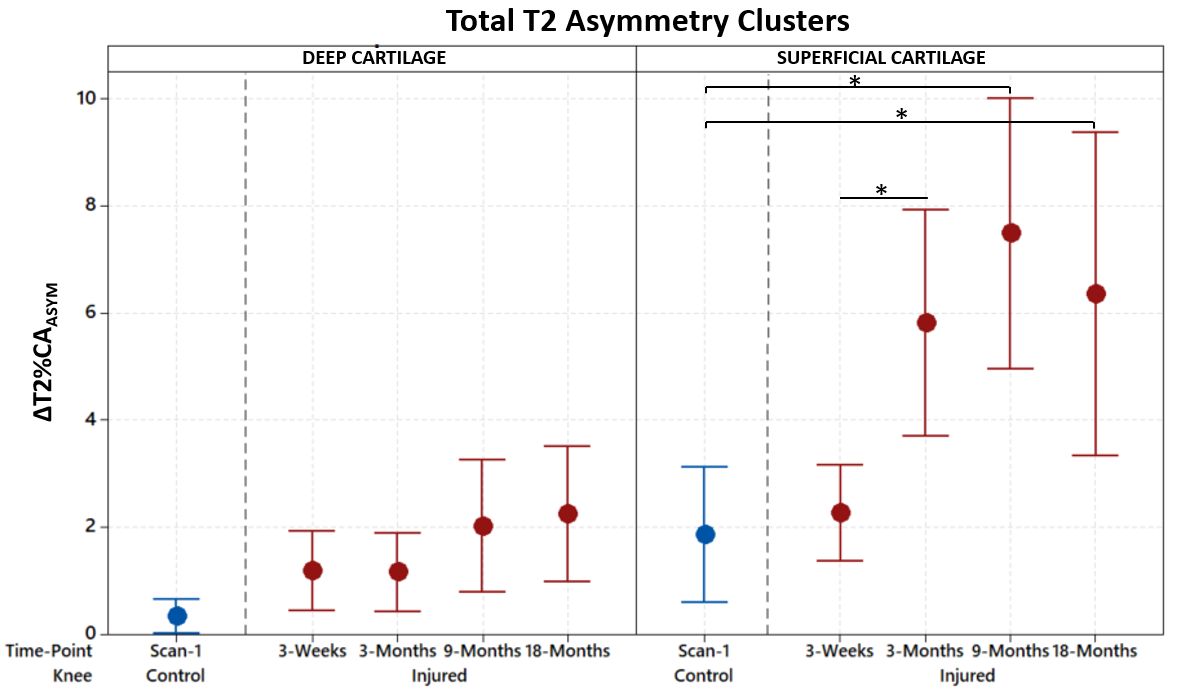
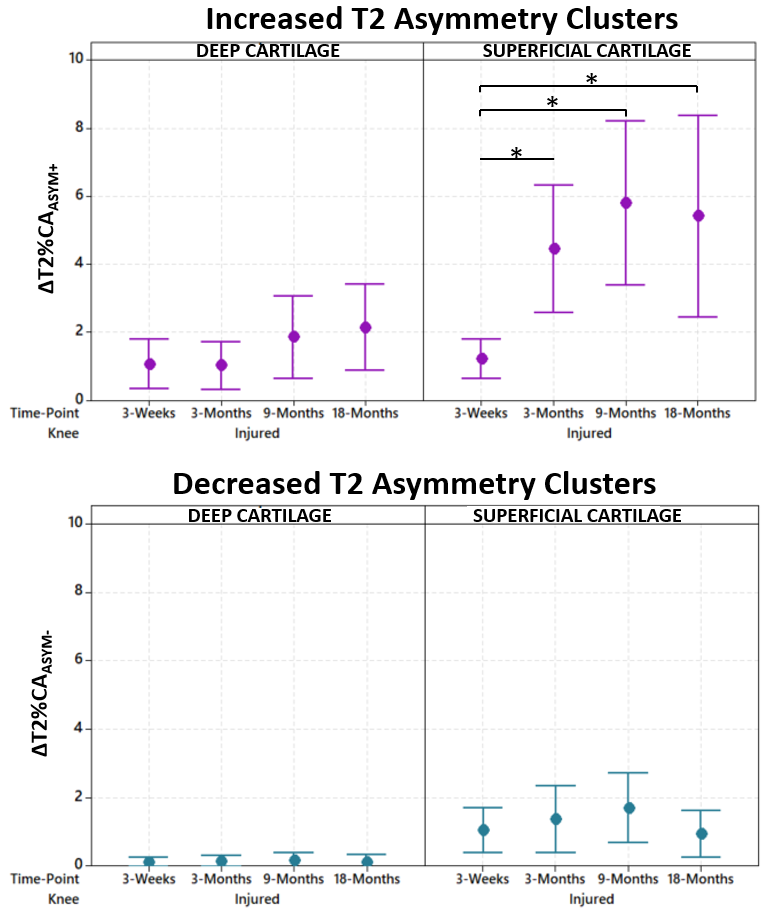
The total ΔT2%CAASYM for all clusters was higher in ACL-injured subjects’ knees at 9-months and 18-months post-surgery compared to control knees in the superficial layer (P=0.028 and P=0.001, respectively), but not at earlier 3-week or 3-month post-surgery time points (P>0.999 and P=0.079, respectively). There were no significant differences between the ΔT2%CAASYM of the deep layer at any time compared to the control knee (P>0.999 for all). The total ΔT2%CAASYM in the superficial layer of the ACL-injured knees increased from 3-weeks to 3-months (P=0.003), but did not significantly change from 3-months to 9-months, or 9-months to 18-months (P>0.999 for both) (Figure 2).For the positive cluster analysis in the ACL-injured subjects, the ΔT2%CAASYM+ was significantly higher in the superficial layer at 3-months, 9-months and 18-months relative to the 3-week time-point (P=0.005, P<0.001, and P=0.001). There were no significant differences between time-points for the deep layer ΔT2%CAASYM+ (P>0.999 for all). For the negative cluster analysis in the ACL-injured subjects (ΔT2%CAASYM-), the time-point factor was not a significant term in the model and it can be seen in Figure 3 that the ΔT2%CAASYM- remained very low (Figure 3).
Discussion
T2 asymmetry cluster analysis shows significant differences between controls and ACL-injured subjects from 9-months to 18-months post-ACL surgery. There is an increase in asymmetry relative to controls in the superficial layer and analysis of the ACL subjects indicates that this is primarily elevated T2. By focusing on the surface layer and looking at differences vs. the contralateral knee at one time-point, this asymmetry method is potentially a one-time scan protocol for detecting post-ACL degeneration at fairly early times. The changes happening preferentially in the surface layer is consistent with literature on early osteoarthritis degeneration7. The ability to scan each knee with a 5-minute scan or to scan both knees simultaneously in 5 minutes8, also makes this method highly feasible for research studies with high-patient throughput.Conclusion
T2 asymmetry cluster analysis can detect significant differences between patients with unilateral ACL knee injuries showing elevations in ΔT2%CAASYM as early as 9 months following surgery. Use of the contralateral knee as an internal control shows promise in detecting early osteoarthritic changes without the need for longitudinal data.Acknowledgements
Acknowledgements: NIH R01 AR0063643, NIH R01 EB002524, NIH K24 AR062068, GE Healthcare.References
1. U.D. Monu, C.D. Jordan, B.L. Samuelson, B.A. Hargreaves, G.E. Gold, E.J. McWalter, “Cluster analysis of quantitative MRI T2 and T1ρ relaxation times of cartilage identifies differences between healthy and ACL-injured individuals at 3T”, Osteoarthritis and Cartilage, Volume 25, Issue 4, 2017, Pages 513-520, ISSN 1063-4584.
2. Black M, Yoon D, Young K, Chaudhari AS, Kogan F, Gold GE, Levenston ME, Hargreaves B. “Detecting early changes in ACL-reconstructed knee cartilage: Cluster analysis of T2 relaxation times in superficial and deep cartilage and ADC analysis”. 27th Annual Meeting of ISMRM, Montreal 2019, p. 1322.
3. Mills, K.; Hettinga, B. A.; Pohl, M. B.; Ferber, R. Between-Limb Kinematic Asymmetry during Gait in Unilateral and Bilateral Mild to Moderate Knee Osteoarthritis. Arch. Phys. Med. Rehabil. 2013, 94, 2241–2247.
4. D. Simon, R. Mascarenhas, B.M. Saltzman, M. Rollins, B. R. Bach Jr., and P.MacDonald, “The Relationship between Anterior Cruciate Ligament Injury and Osteoarthritis of the Knee,” Advances in Orthopedics, vol. 2015, Article ID 928301, 11 pages, 2015.
5. D.E. Meuffels, M.M. Favejee, M.M. Vissers, et al, “Ten year follow-up study comparing conservative versus operative treatment of anterior cruciate ligament ruptures. A matched-pair analysis of high level athletes,” British Journal of Sports Medicine 2009;43:347-351.
6. B. Sveinsson, A.S. Chaudhari, G.E. Gold, B.A. Hargreaves, “A simple analytic method for estimating T2 in the knee from DESS”, Magnetic Resonance Imaging, Volume 38, 2017, Pages 63-70.
7. S.,Saarakkala, P. Julkunen, P. Kiviranta, J. Mäkitalo, J. S. Jurvelin, and R. K. Korhonen, "Depth-wise progression of osteoarthritis in human articular cartilage: investigation of composition, structure and biomechanics".: Osteoarthritis and Cartilage, v. 18, no. 1, 2010 p. 73–81.
8. F. Kogan, E. Levine, A. S. Chaudhari, U. D. Monu, K. Epperson, E. H. G. Oei, G. E. Gold, and B. A. Hargreaves, 2018, "Simultaneous bilateral-knee MR imaging". Magnetic Resonance in Medicine, v. 80, no. 2, 2018 p. 529–537.
Figures