0352
Rapid Simultaneous T1, T2, and T1ρ Relaxation Mapping of the knee joint with MR-Fingerprinting (MRF)1Radiology, NYU Langone Health, New York, NY, United States
Synopsis
Osteoarthritis of the knee, the most common joint disease, is a degenerative heterogeneous musculoskeletal disease which is mainly recognized by the progressive loss of hyaline articular cartilage (1). Spin-lattice relaxation in the rotating frame (T1ρ) and spin-spin relaxation (T2) have been shown to be sensitive to the biochemical changes associated with osteoarthritis progression including: loss of proteoglycans, increased water content, and disruption of collagen and anisotropy (1, 2). In this study, we propose a novel MR fingerprinting sequence for in-vivo simultaneous T1, T2, and T1ρ relaxation mapping of knee joint at 3T.
Purpose
To develop a novel MR-fingerprinting pulse sequence for simultaneous T1, T2, and T1ρ relaxation mapping with radial volumetric encoding and to evaluate the multi-parametric mapping of knee joint in healthy controls and patients with mild knee OA.Methods
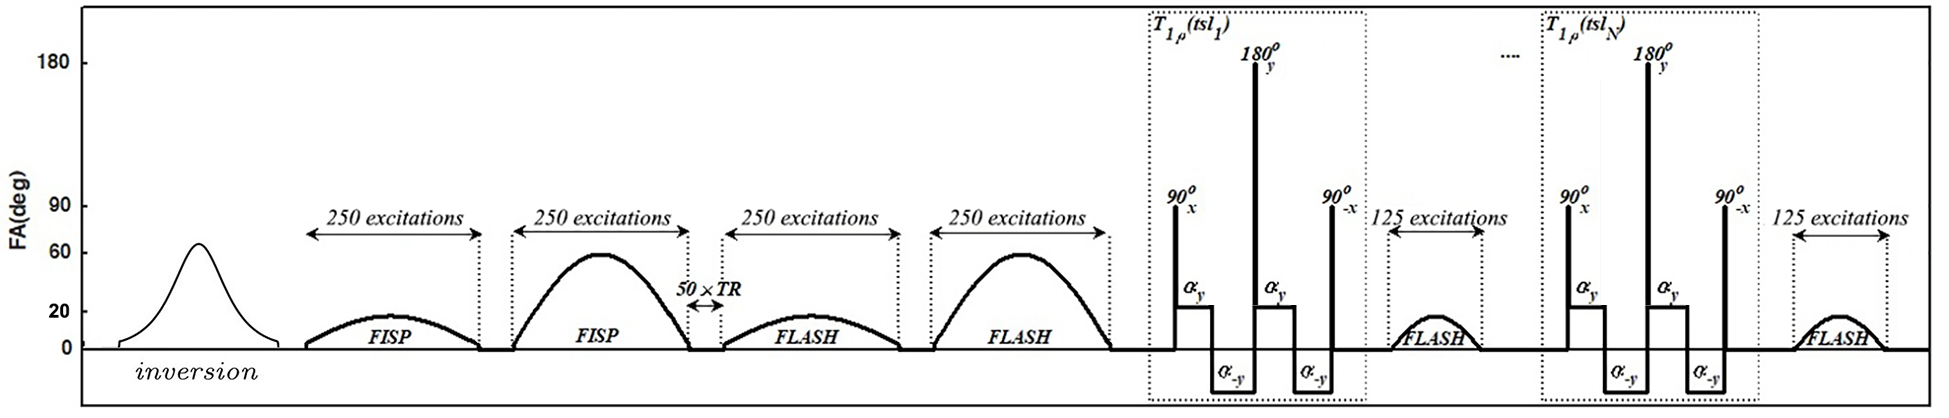
We developed an MRF-sequence based on the method described in (3) to estimate, T1, T2, and T1ρ in less than 8 minutes. Similar to a previous design (3), the proposed MRF-sequence started with an adiabatic inversion pulse followed by two fast imaging with steady‐state precession (FISP) segments, which predominantly encode T1/T2, and two fast low‐angle shot (FLASH) segments, which encode T1 and B1+ (Figure 1). Each segment contains 250 radiofrequency (RF) excitations with a timebandwidth product of three. There was a delay equal to 50 repetition times (TRs) between segments for partial recovery of the magnetization and enhancing T1 encoding. The peak flip angle for this part was 60°(3). To encode the T1ρ, N = 6 paired self-compensated spin-lock preparation modules (4) with different spin-lock duration (tsl = 2.0, 3.7, 6.9, 12.9, 24.1, 45ms ) were added at the end of the train. Each of the preparation modules was followed by a FLASH segment with 125 RF excitations. The peak flip angle for the T1ρ train was 20° (Figure 1).Test-retest scans were performed on 3T MRI scanner (MAGNETOM Prisma, Siemens Healthcare GmbH, Germany) using a phantom including 3 %, 4%, and 8% agar samples and crosslinked bovine serum albumin (BSA) to asses the repeatability of the method. In addition, the MRF sequence was also tested on another 3T MRI scanner (MAGNETOM Skyra, Siemens Healthcare GmbH, Germany) to evaluate the reproducibility.
Afterward, IRB-approved MRF imaging was performed on seven healthy volunteers (mean age: 38 ± 12 years) and five patients with mild knee OA (MOA) (KL score 1-2, mean age: 63 ± 5 years) using a 15 channel Rx/Tx knee coil (Quality Electrodynamics [QED], Mayville, OH). Six sagittal images were acquired with 0.6×0.6mm2 in-plane resolution, 4.0mm slice thickness, 224×224 matrix size, TE/TR = 3.5/7.5ms, BW = 420Hz/pixel, number of shots = 4 spin-power fsl = 500Hz. The Acquisition time was 7:06min.
Results
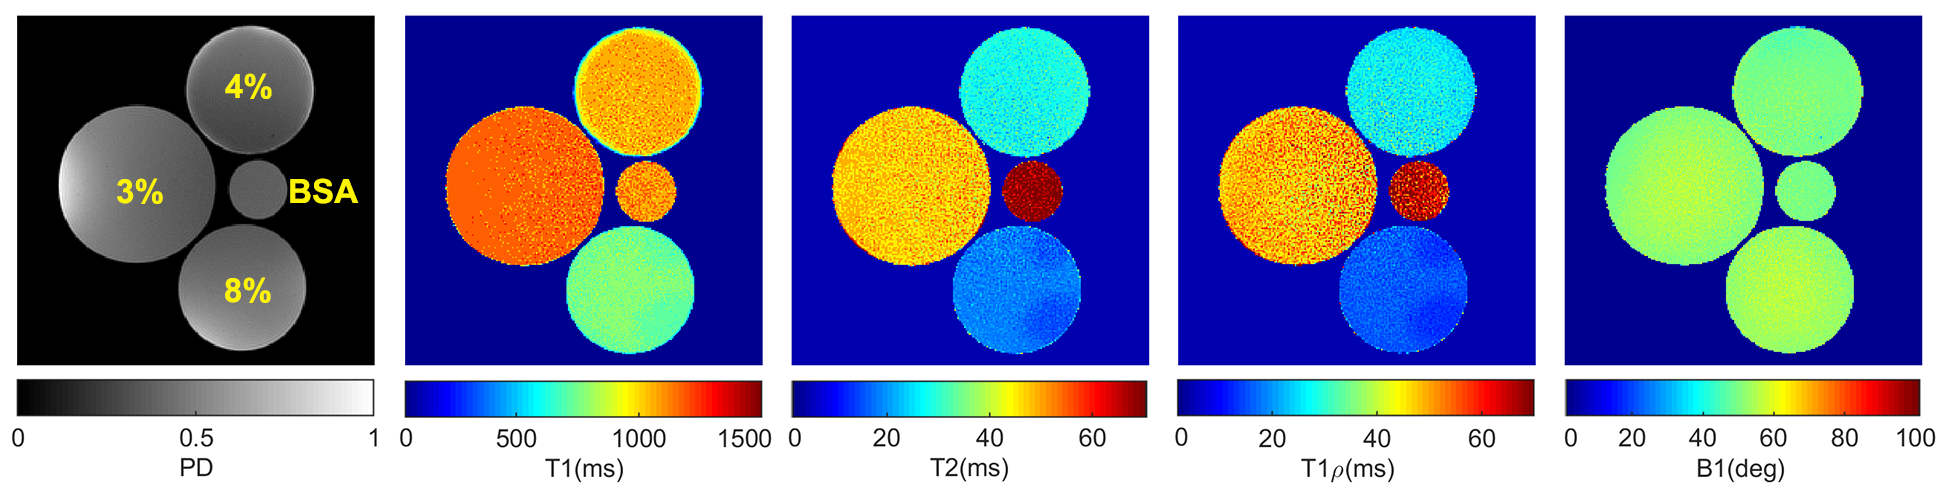
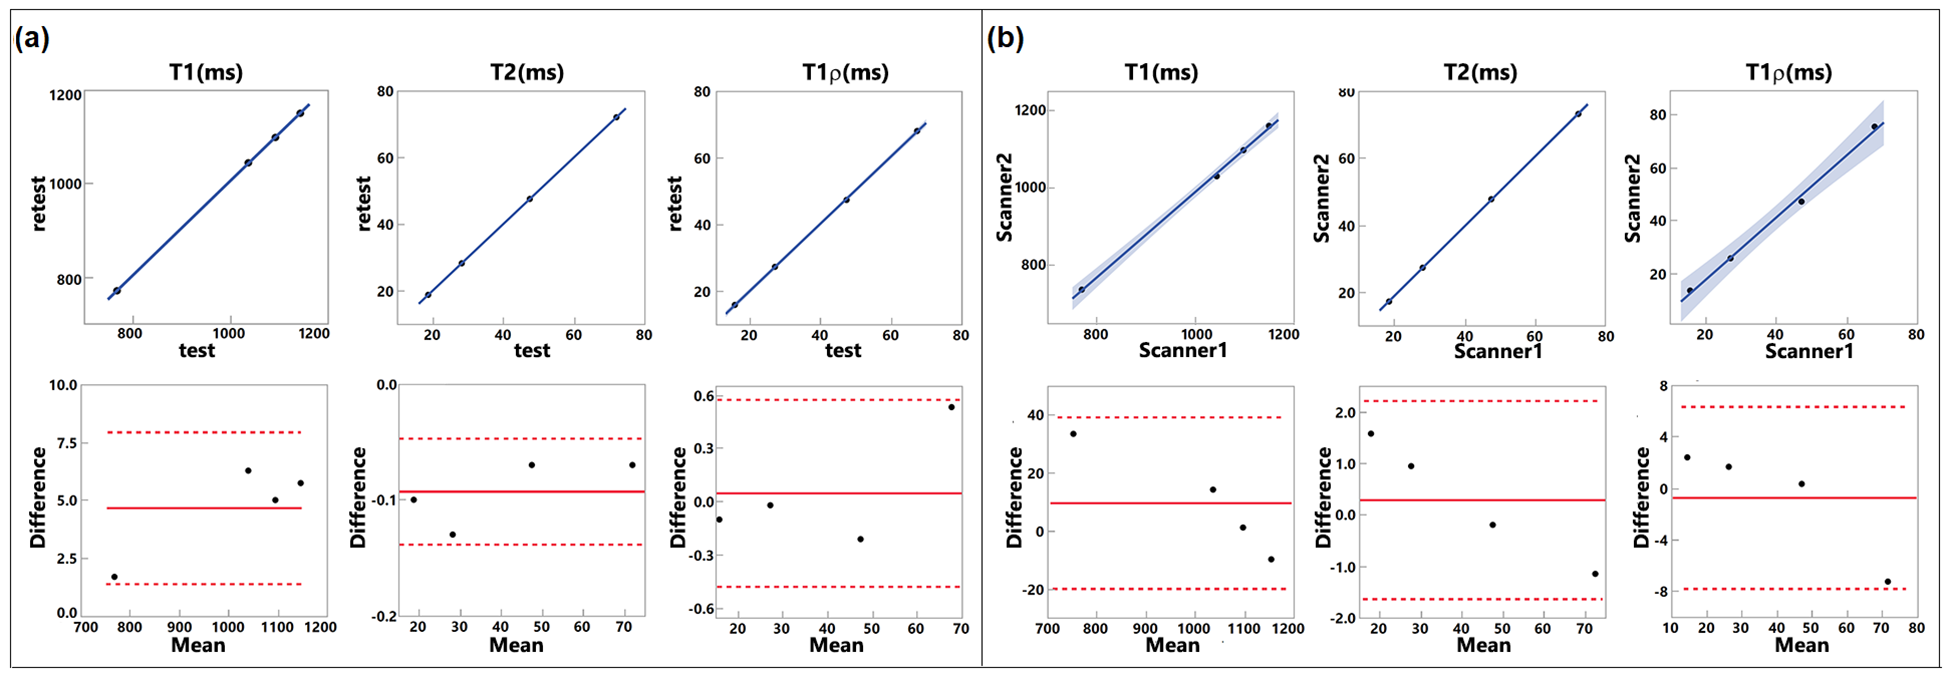
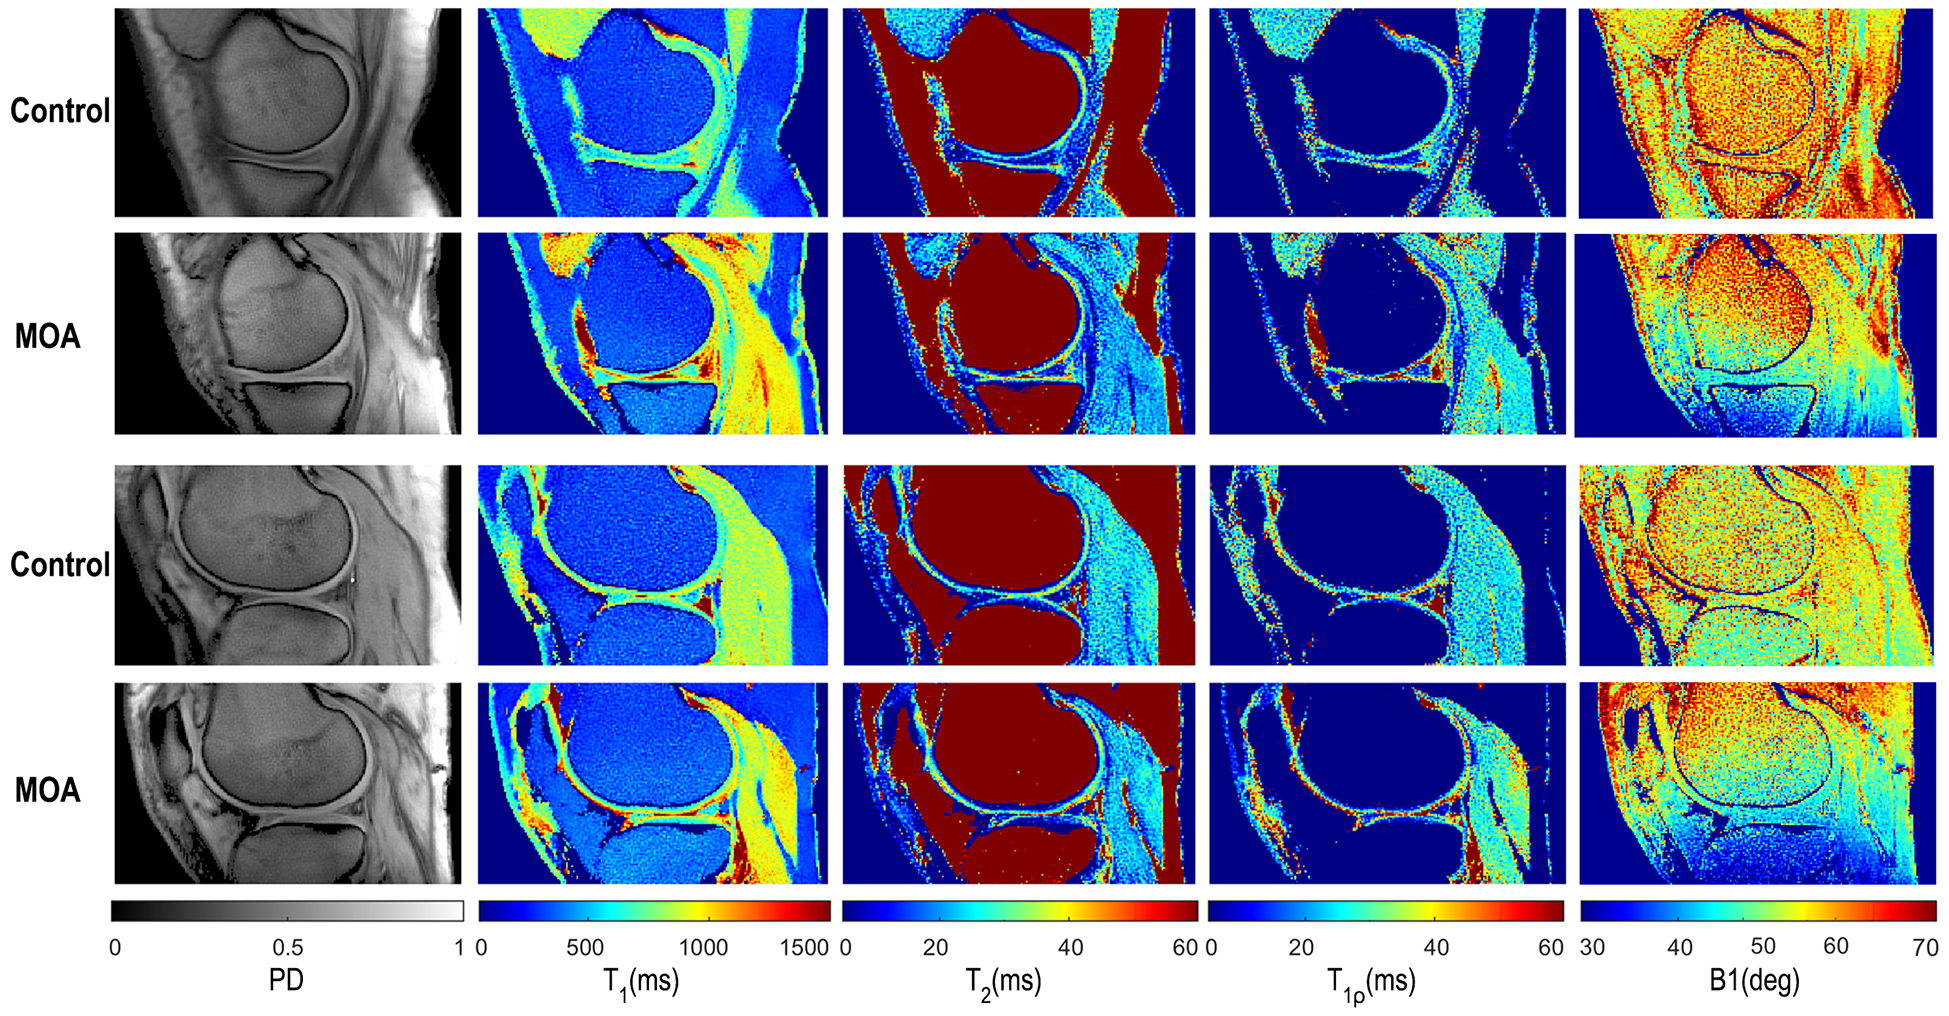
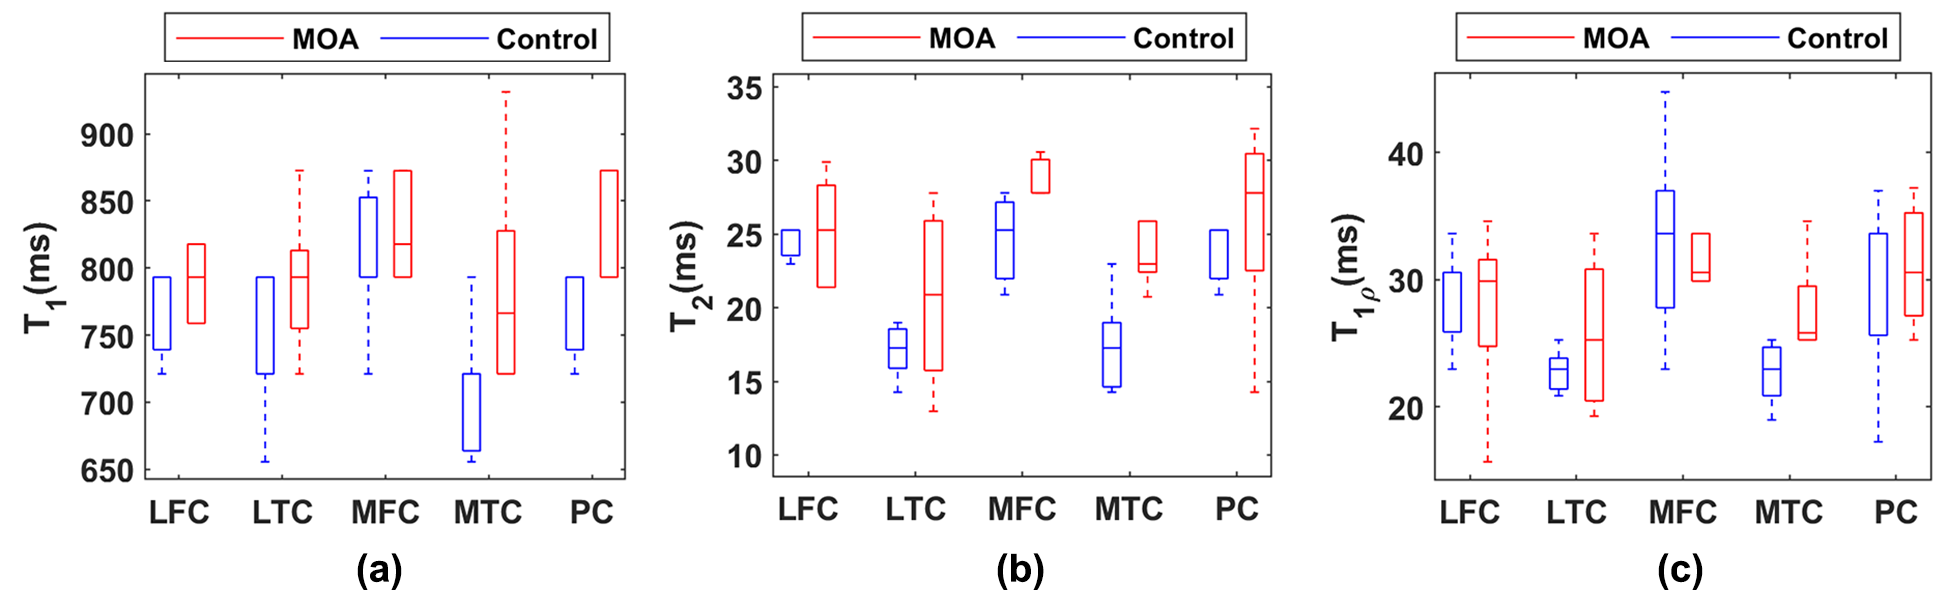
Figure 2 shows the representative T1, T2, T1ρ relaxation, and B1 maps of the model agar-gel phantoms. Analysis of the Bland-Altman plot demonstrated an average difference of 4.67ms, -0.09ms, and 0.05ms between two scans in the same scanner and 9.68ms, 0.29ms, and -0.72ms between the scans acquired on two scanners for T1, T2, and T1ρ (Figure. 3), respectively. The representative maps of the knee joint (medial and lateral cartilages) for control and MOA patient are shown in Figure 4. The boxplot comparisons of three relaxation parameters between control and MOA patients are shown in Figure 5. The Wilcoxon test showed a significant difference between control and MOA patients for T1 (p = 0.04), T2 (p = 0.01), and T1ρ (p = 0.02) relaxation parameters in medial tibial cartilage (MTC) as well as for T2 relaxation time (p = 0.02) in medial femoral cartilage (MFC).Discussion and Conclusion
In this work, we implemented an MRF sequence and showed the feasibility of rapid simultaneous acquisition of accurate PD, T1, T2, and T1ρ maps of the human knee joint. The proposed MRF method is fast, reproducible, and robust to B1 inhomogeneity. The current proposed method uses offline reconstruction and dictionary matching since it is computationally costly and memory consuming. Fast reconstruction and matching methods are under investigation. Nevertheless, the in-vivo results showed that it could discriminate the mild OA patients from the healthy controls and hence has the potential to be used for the quantitative assessment of the cartilage for the early detection of OA.Acknowledgements
This study was supported by NIH grants R01 AR067156, and R01 AR068966, and was performed under the rubric of the Center of Advanced Imaging Innovation and Research (CAI2R), a NIBIB Biomedical Technology Resource Center (NIH P41 EB017183).References
1. Li X, Benjamin Ma C, Link TM, et al.: In vivo T1ρ and T2 mapping of articular cartilage in osteoarthritis of the knee using 3T MRI. Osteoarthr Cartil 2007; 15:789–797.
2. Regatte RR, Akella SVS, Lonner JH, Kneeland JB, Reddy R: T1ρ mapping in human osteoarthritis (OA) cartilage: Comparison of T1ρ with T2. J Magn Reson Imaging 2006; 23:547–553.
3. Cloos MA, Assländer J, Abbas B, et al.: Rapid Radial T1 and T2 Mapping of the Hip Articular Cartilage With Magnetic Resonance Fingerprinting. J Magn Reson Imaging 2019; 50:810–815.
4. Mitrea BG, Krafft AJ, Song R, Loeffler RB, Hillenbrand CM: Paired self-compensated spin-lock preparation for improved T1ρ quantification. J Magn Reson 2016; 268:49–57.
Figures