0351
Extending DESS to MESS: A 5 minute knee protocol for water-fat separation and T2 mapping1Image Sciences Institute, UMC Utrecht, Utrecht, Netherlands
Synopsis
This study proposes a 5 minute knee protocol using an extension of the double-echo steady-state (DESS) sequence to include multiple readouts. This multiple-echo steady-state (MESS) sequence supports quantification of water, fat, and T2, in a single, efficient acquisition. These parameters may provide additional tissue-specific MRI biomarkers, for example in muscle and bone, on top of the T2 quantification of cartilage provided by the DESS sequence. In vivo results on 5 volunteers show robust water-fat separation and that T2 quantification using MESS corresponds well with quantification on water-selective DESS images.
Introduction
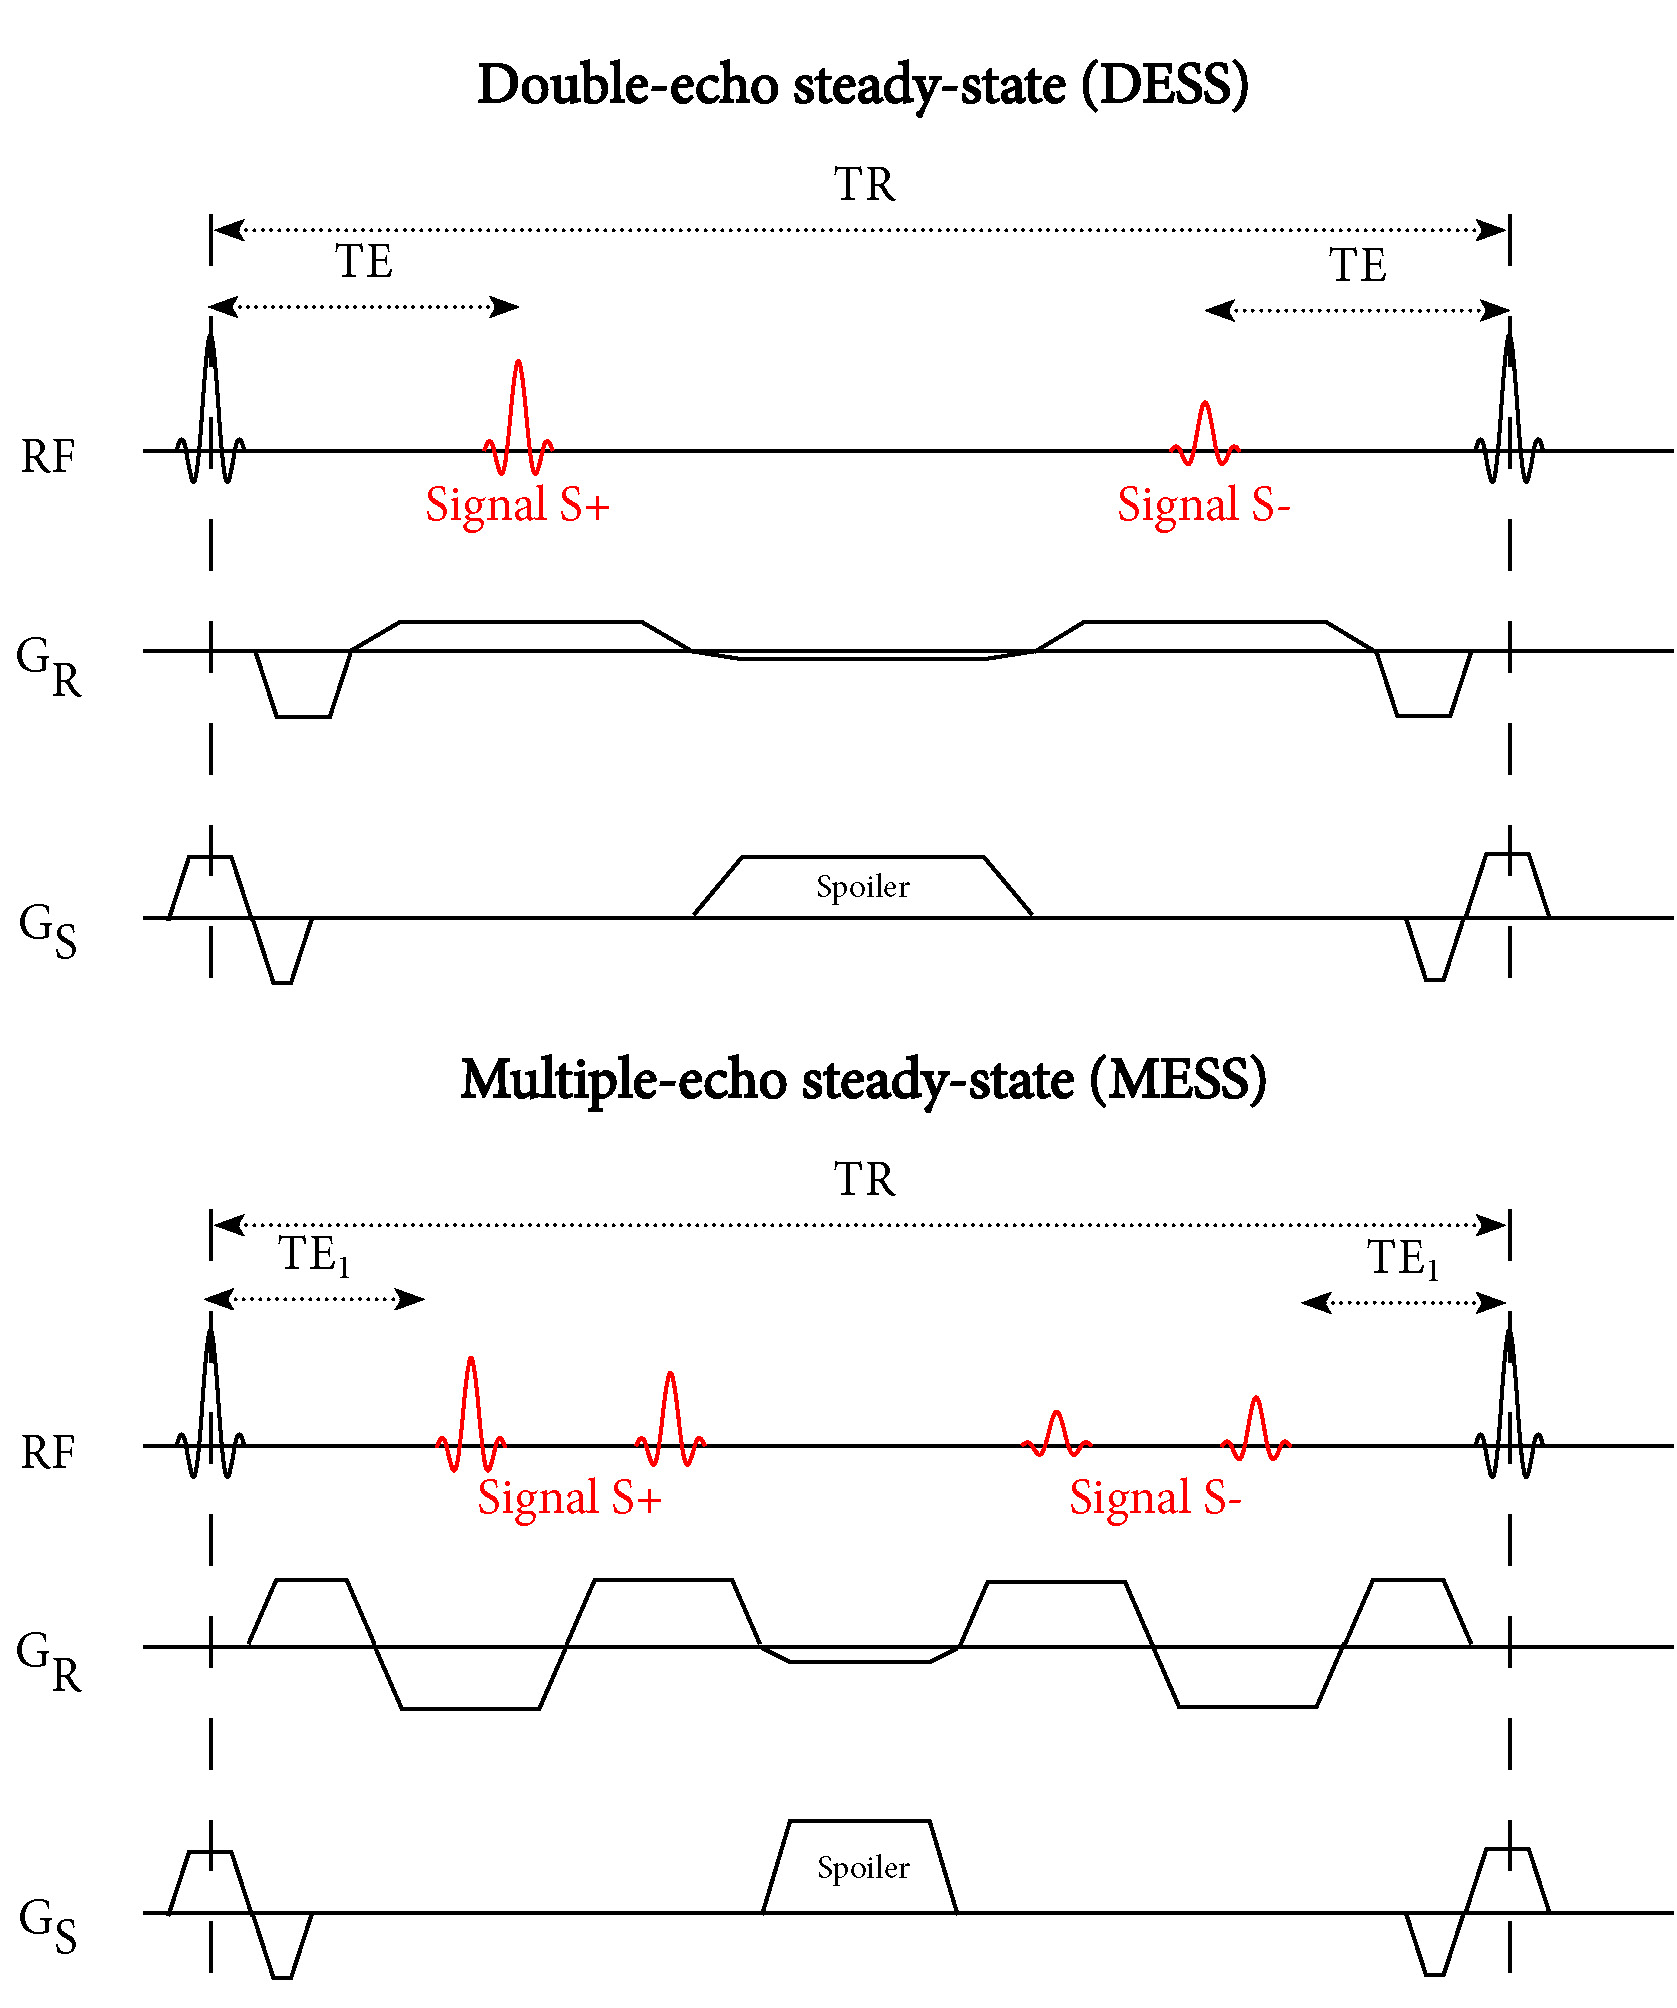
Clinical knee MRI protocols typically consistent of multiple sequences with varying contrasts, fat-suppression, and scan orientations, adding up to about 20 minutes of scan time. Reducing imaging time through faster and more efficient scanning protocols has the potential to reduce costs and improve access to MRI, increase patient comfort and decrease motion artifacts. Recently, two 5-minute knee protocols were proposed: Alaia et al evaluated parallel imaging and reduced imaging resolution for scan time reduction1, while Chaudhari et al compared a single 5-minute water-selective double-echo steady-state (DESS) sequence and an optional 2-minute proton-density fat-saturated sequence with a conventional clinical protocol2. Both studies found that knee abnormalities were depicted with similar accuracy in the abbreviated protocols.In this study we propose a 5-minute sequence that is a multi-echo extension of the DESS sequence, where Dixon water-fat separation is used as an alternative to water-selective excitation. By replacing the two low bandwidth readouts in DESS (Figure 1A) with four shorter, higher bandwidth readouts (Figure 1B), the multiple-echo steady-state (MESS) sequence allows separation of water and fat signal using 2-point Dixon reconstruction3, as well as quantification of $$$T_2$$$ of both water and fat components. In addition to the water signal provided by DESS, fat fraction has been proven useful in assessment of bone marrow microstructure4, osteoporosis5, and muscle6, and may efficiently provide additional diagnostic information. Furthermore, morphological analysis, such as automatic segmentation of structures in the knee7 could benefit from the in-phase and fat signals.
Methods
Acquisition:We implemented the multiple-echo steady-state (MESS) sequence on a 3T scanner (Philips Ingenia, Best, The Netherlands), and acquired DESS and MESS images of the knee for five healthy volunteers (4 male, 1 female, mean age 30.6 years). The parameters for the DESS sequence were: TE1/TE2/TR 4.9/14.3/19.2, flip angle 20, resolution $$$0.5\times0.5\times1.3$$$ mm, FOV $$$144\times144\times130$$$ mm, $$$1.2\times1.2$$$ SENSE acceleration, bandwidth 228 Hz/pixel, scan duration 304 seconds. The DESS sequence used water excitation with a 1-2-1 binomial RF pulse. The parameters for the 4-echo MESS sequence were matched to the DESS sequence, with the exception of: TE1/TE2/TE3/TE4/TR 3.5/6.5/12.6/15.6/19.1, bandwidth 362 Hz/pixel, scan duration 303 seconds.
Water-fat separation and $$$T_2$$$ mapping:
We performed two 2-point Dixon water-fat separations on the MESS acquisition, for the first two echoes and for the last two echoes. A quadratic phase correction was applied to correct for eddy current and B1-related phase effects, in order to make the image phase more consistent between these two pairs of echoes. An analytical 2-point water-fat separation3 was used, where the field phasor was determined using region growing and local smoothing on the first pair of echoes.
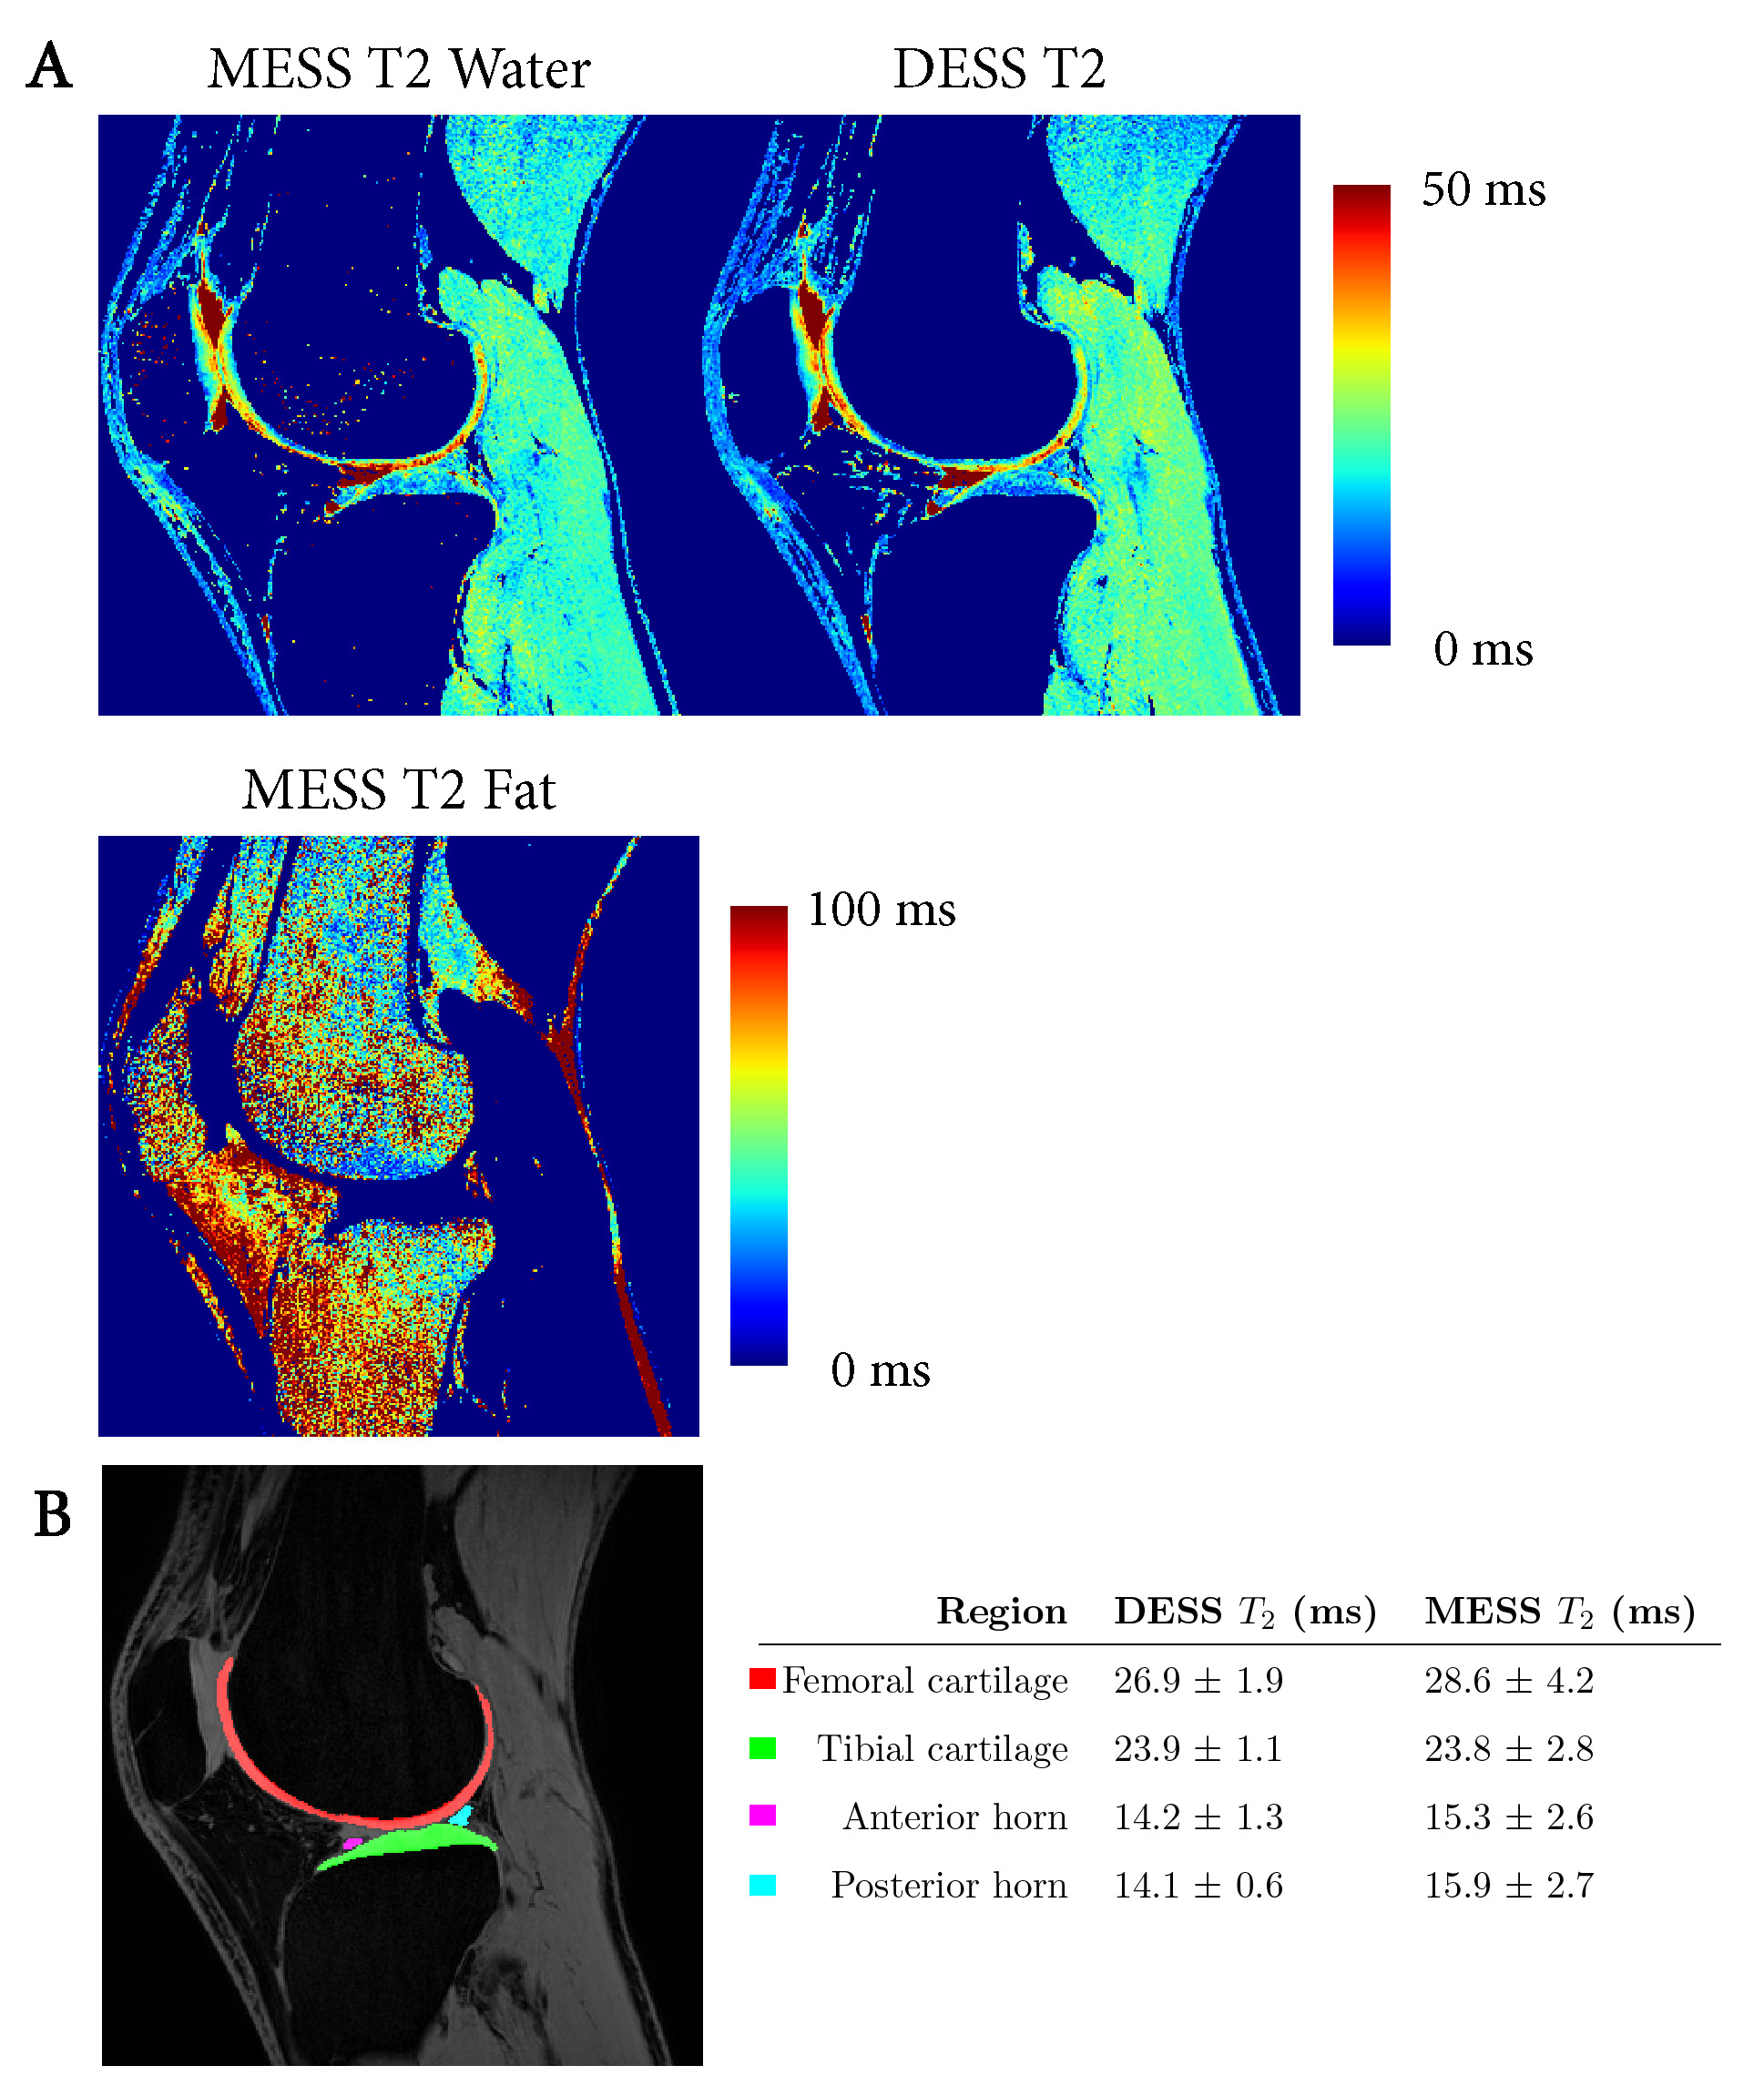
The $$$T_2$$$ of the water and fat components were seperately estimated using an analytical $$$T_2$$$ fit8. For the water $$$T_2$$$ we used a reference $$$T_1$$$ of 1200 ms (cartilage), and for the fat $$$T_2$$$ we used a reference $$$T_1$$$ of 365 ms (bone marrow). We manually segmented the femoral and tibial cartilage, and anterior and posterior horn of the meniscus, in which mean $$$T_2$$$ values were measured on both DESS and MESS water $$$T_2$$$ maps for all 5 volunteers.
Results
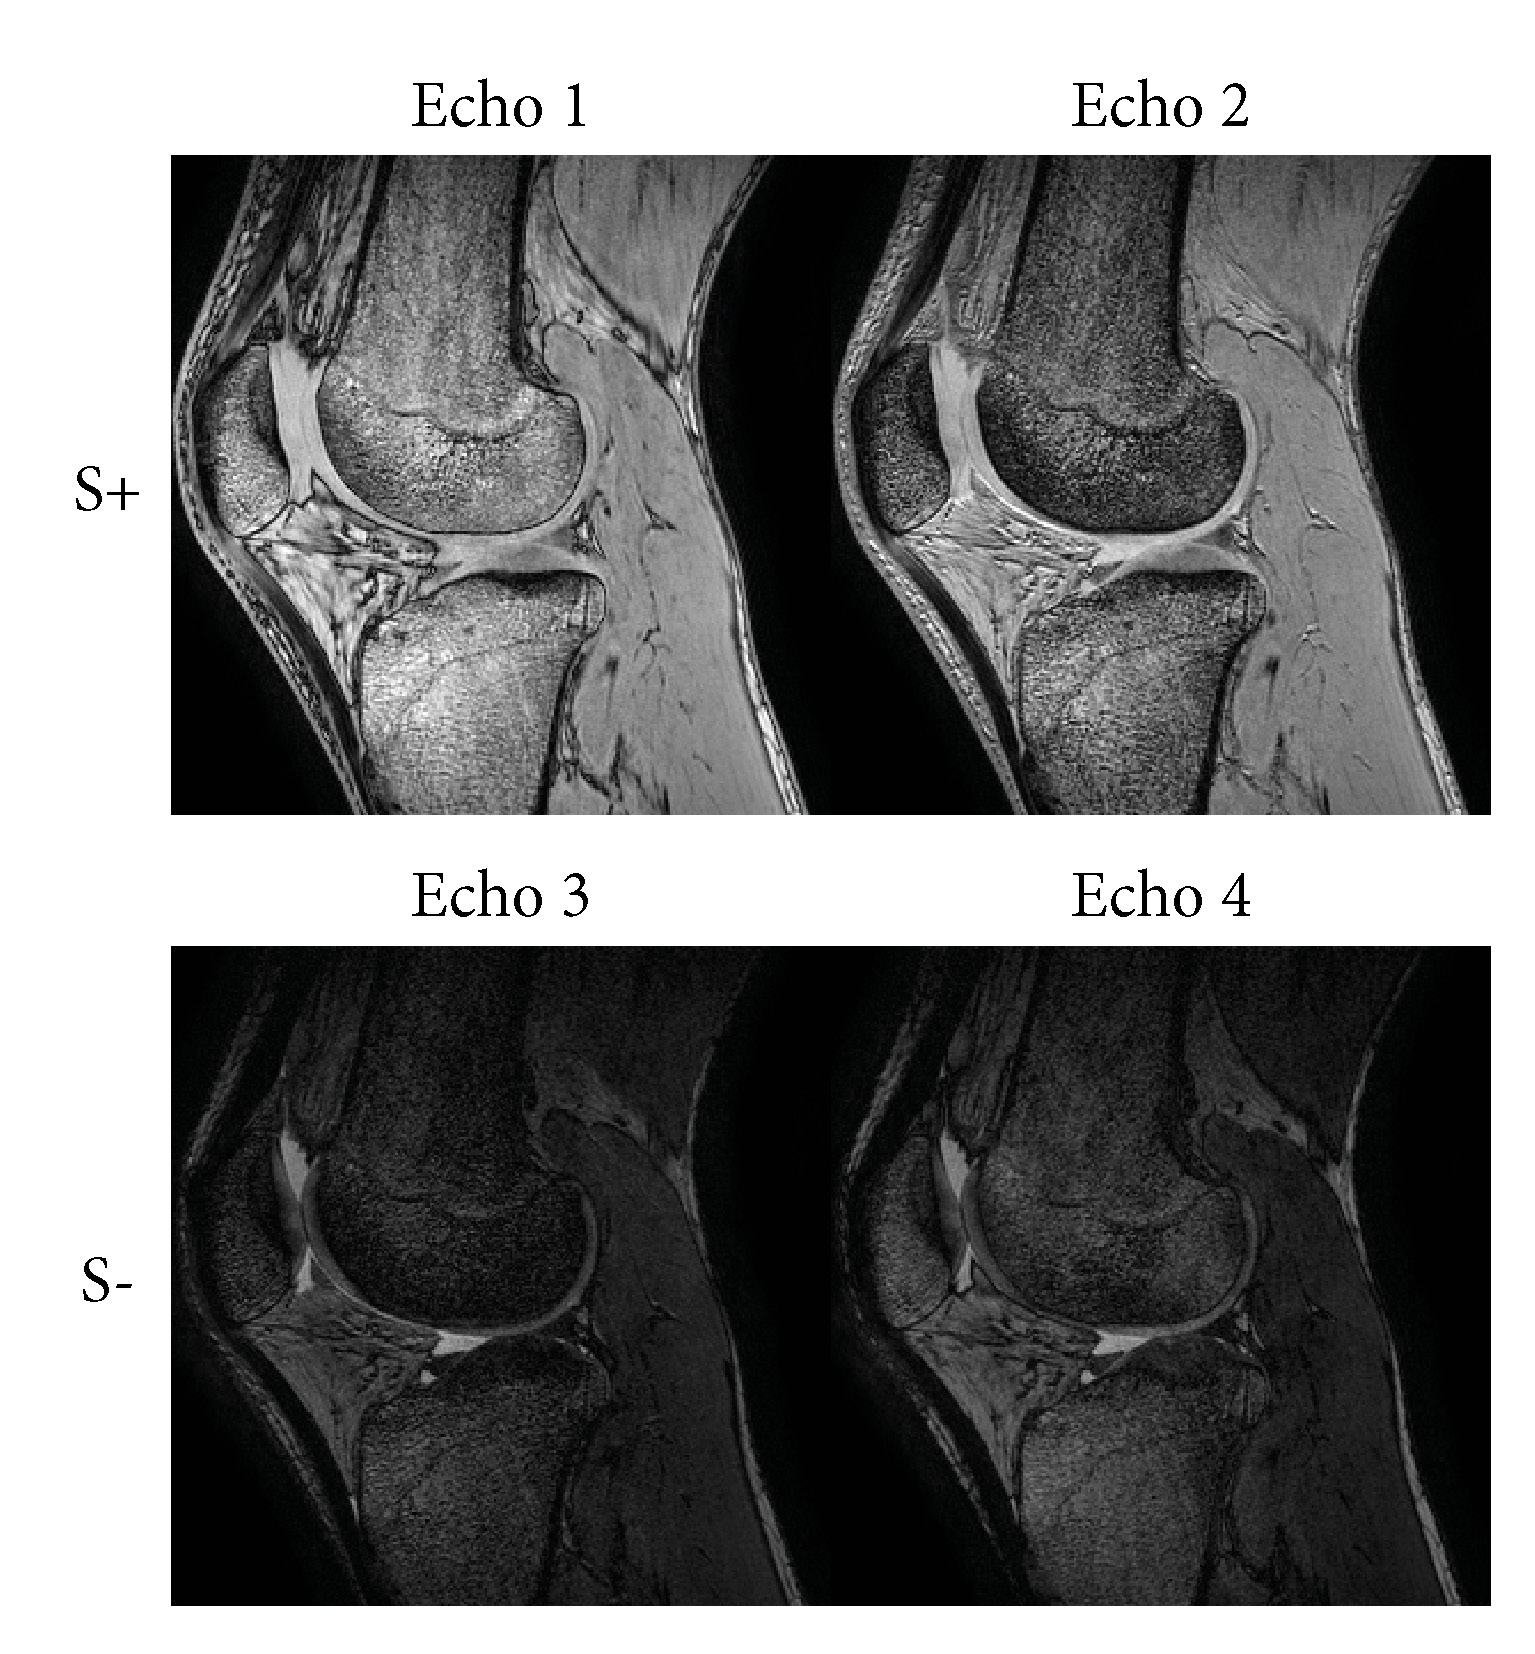
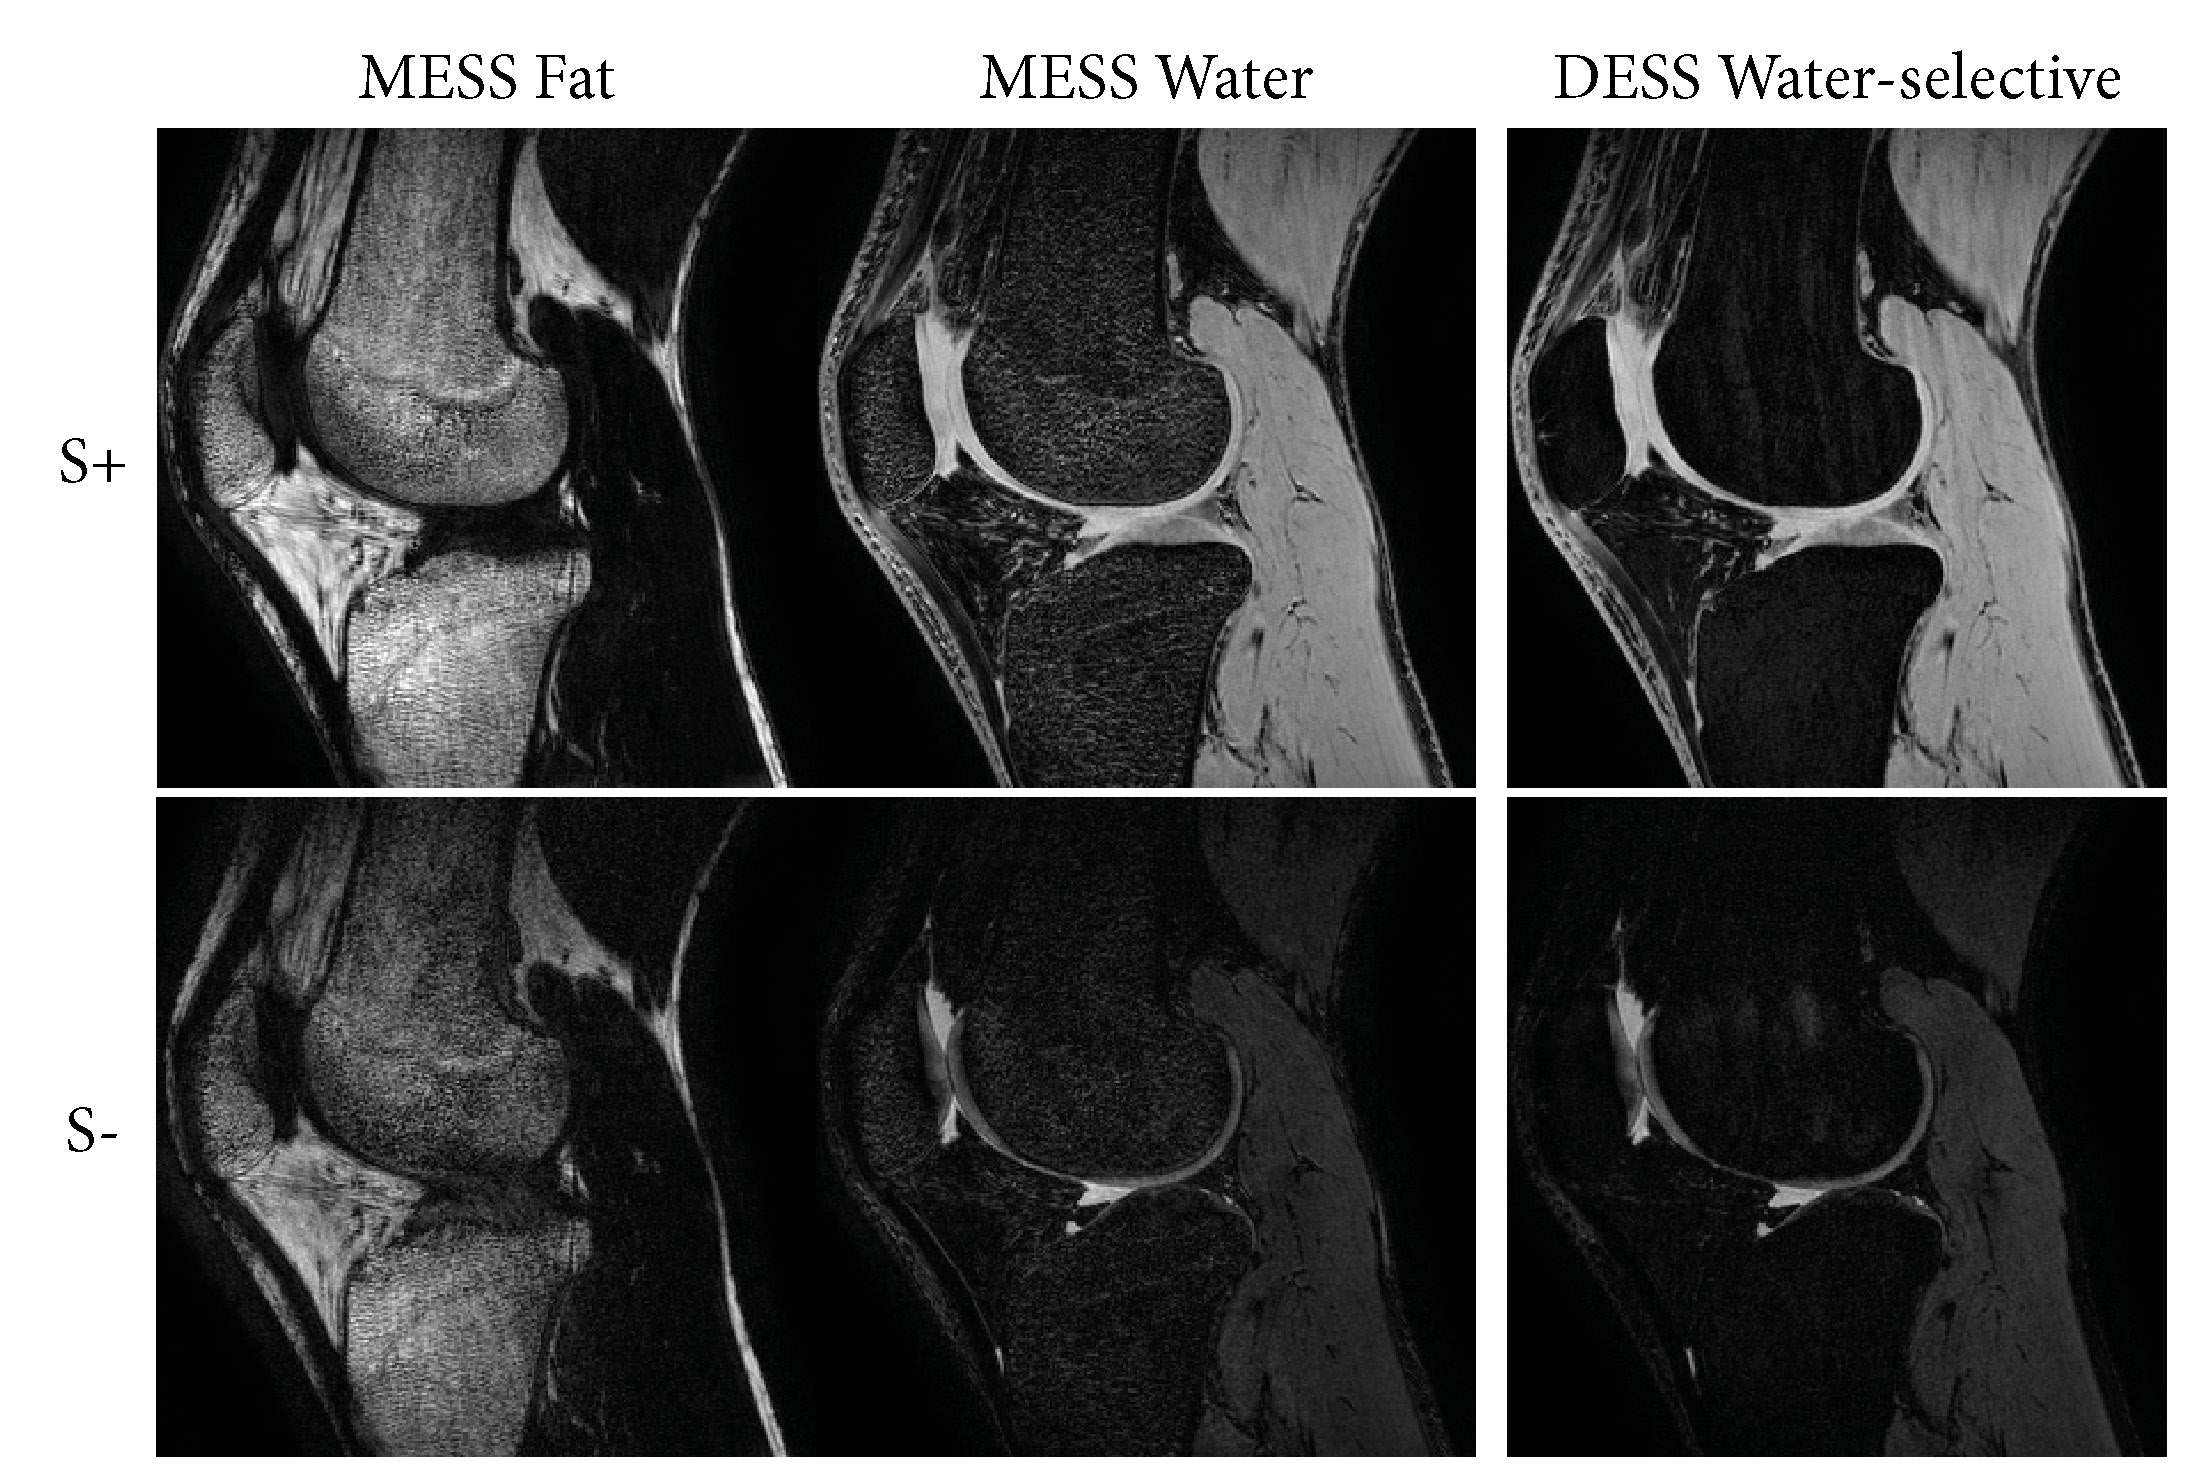
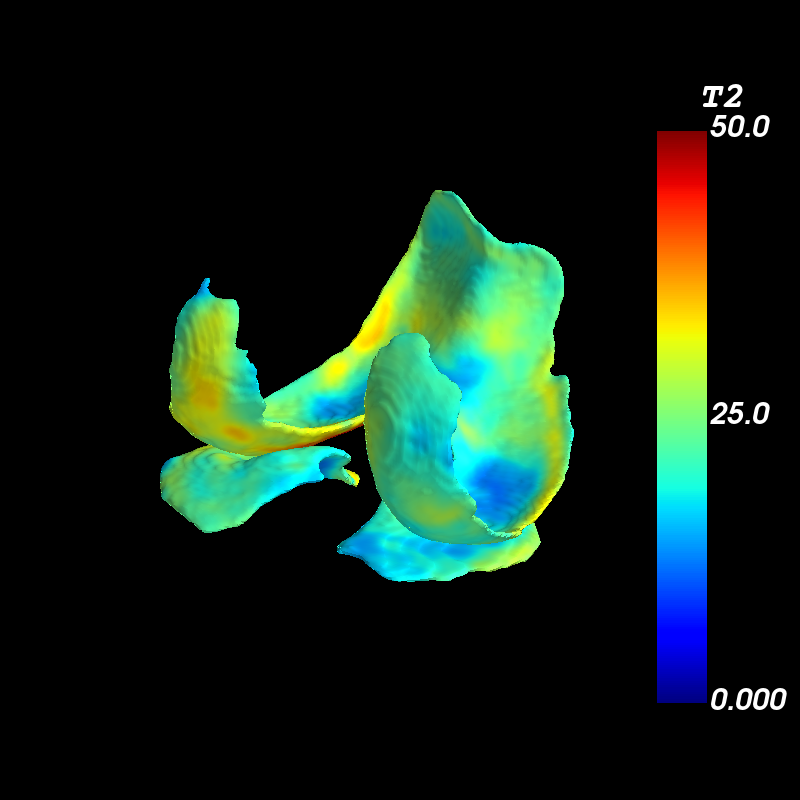
Figure 2 shows the 4 echoes from the MESS acquisition, showing varying $$$T_2$$$ contrasts and in-phase/out-of-phase effects of water and fat. These images were used to perform the water-fat separation shown in Figure 3, where the DESS water-selective images are shown as a reference. While the suppression of fat signal in the bone marrow is not as good as in the dedicated water-selective excitation, the fat image shows contrast between cortical bone and bone marrow, and structure in the bone marrow that is lost in the DESS sequence.Figure 4 shows a comparison between DESS and MESS $$$T_2$$$ quantification. The images and $$$T_2$$$ values showed a good correspondence between DESS and MESS. The quantitative results on the 5 volunteers show the MESS $$$T_2$$$ has a higher standard deviation than DESS, which could be caused by lower SNR of the MESS images due to higher readout bandwidth. Additionally, the MESS $$$T_2$$$ quantification may be affected by chemical shift, and imperfect water fat separation. Finally, a visualization of $$$T_2$$$ on the segmented cartilage is shown in Figure 5.
Discussion & Conclusion
In this study we have demonstrated a 5-minute knee protocol that extends the DESS sequence to provide quantification of water, fat, and $$$T_2$$$, while maintaining the parameters provided by the original DESS sequence. The water-fat separation and $$$T_2$$$ quantification were performed with relatively simple, non-iterative methods that should easily translate to clinical scanners. The fat signal in MESS could provide additional morphological and tissue-specific information over DESS, potentially acting as biomarkers to characterize bone marrow, cortical bone, ligaments, and cartilage in a single acquisition. MESS has a higher readout bandwidth which lowers SNR, but this is partially compensated through the acquisition of additional echoes, and in combination with non-selective excitation it makes MESS less sensitive to $$$B_0$$$-inhomogeneity and susceptibility-based distortion artifacts.The 5-minute MESS sequence provides an efficient way to obtain quantitative measurements from multiple tissue types in the knee in 3D. Compared to DESS, it also provides a fat signal and non-fat-suppressed images, which could provide valuable clinical information in less time than conventional clinical protocols.
Acknowledgements
This work is part of the research programme Applied and Engineering Sciences (TTW) with project number 15479 which is (partly) financed by the Netherlands Organization for Scientific Research (NWO).References
1. Alaia EF, Benedick A, Obuchowski NA, et al. Comparison of a fast 5-min knee MRI protocol with a standard knee MRI protocol: a multi-institutional multi-reader study. Skeletal Radiol. 2018;47(1):107–116.
2. Chaudhari AS, Stevens KJ, Sveinsson B, et al. Combined 5-minute double-echo in steady-state with separated echoes and 2-minute proton-density-weighted 2D FSE sequence for comprehensive whole-joint knee MRI assessment. J. Magn. Reson. Imaging. 2019;49(7):e183–e194.
3. Berglund J, Ahlström H, Johansson L, et al. Two-point dixon method with flexible echo times. Magn. Reson. Med. 2011;65(4):994–1004.4. Wehrli FW, Song HK, Saha PK, et al. Quantitative MRI for the assessment of bone structure and function. NMR Biomed. 2006;19(7):731–764.
5. Yeung DKW, Griffith JF, Antonio GE, et al. Osteoporosis is associated with increased marrow fat content and decreased marrow fat unsaturation: A proton MR spectroscopy study. J. Magn. Reson. Imaging. 2005;22(2):279–285.
6. Kumar D, Karampinos DC, MacLeod TD, et al. Quadriceps intramuscular fat fraction rather than muscle size is associated with knee osteoarthritis. Osteoarthritis Cartilage. 2014;22(2):226–234.
7. Norman B, Pedoia V, Majumdar S. Use of 2D U-Net Convolutional Neural Networks for Automated Cartilage and Meniscus Segmentation of Knee MR Imaging Data to Determine Relaxometry and Morphometry. Radiology. 2018;288(1):177–185.
8. Sveinsson B, Chaudhari AS, Gold GE, et al. A simple analytic method for estimating T2 in the knee from DESS. Magn. Reson. Imaging. 2017;38:63–70.
Figures