0350
Gray Level Co-occurrence Matrix Based 3D Texture Analysis of Knee Articular Cartilage using 3D DESS Images1Research Unit of Medical Imaging, Physics and Technology, University of Oulu, Oulu, Finland, 2Medical Research Center, University of Oulu and Oulu University Hospital, Oulu, Finland, 3Medical Imaging, Central Finland Health Care District, Jyväskylä, Finland, 4Department of Diagnostic Radiology, Oulu University Hospital, Oulu, Finland
Synopsis
In the present study, a gray level co-occurrence matrix-based 3D texture analysis of knee 3D DESS images was used to investigate longitudinal changes in articular cartilage using data from the Osteoarthritis Initiative (baseline, 36-month and 72-month visits). At baseline, all subjects included in the study had Kellgren-Lawrence grade < 2. Three groups were defined, based on time of progression into radiographic osteoarthritis (Kellgren-Lawrence grades ≥ 2): control, slow progressor and fast progressor groups. 3D texture analysis of 3D DESS images was able to distinguish progressors from controls before radiographic signs of osteoarthritis and showed significant longitudinal changes across all groups.
Introduction
Gray level co-occurrence matrix (GLCM) based texture analyses1 have been conducted in osteoarthritis (OA) studies in 2D using quantitative T2 and T1rho maps. This study aims to introduce a novel GLCM-based 3D texture analysis method, which uses isotropic 3D DESS Magnetic Resonance (MR) images and enables following the curvature of the knee cartilage in layers parallel to the bone-cartilage interface at different cartilage depths. The new method could enable the detection of cartilage degeneration before signs of radiographic OA.Methods
3D DESS images of 642 right knees acquired at 3T were obtained from baseline (00m), 36-month (36m) and 72-month (72m) follow-ups from the Osteoarthritis Initiative2 (OAI) database (https://nda.nih.gov/oai/). The subjects included in this study (N=214, aged 45 to 65 years) had Kellgren-Lawrence3 (KL) grade < 2 at baseline. They were stratified into three groups based on the time of progression into radiographic osteoarthritis (ROA; KL ≥ 2). The control group (N=65, 25 males, age 53±5 years, BMI 24±3 kg/m2) included subjects from OAI non-exposure cohort with KL grade < 2 at all time points. Subjects in slow progressor group (diagnosed ROA only at 72m; N=71, 29 males, age 56±6 years, BMI 29.7±4.2 kg/m2) and fast progressor group (diagnosed ROA already at 36m; N=78, 26 males, age 56±6 years, BMI 29.3±4.9 kg/m2) were selected from combined OAI Incidence and Progression cohorts. Femoral cartilage was segmented from 3D DESS images using the baseline method from an in-house automated deep learning segmentation tool4. Textural features, contrast, correlation, energy, entropy and homogeneity, were extracted from femoral cartilage using in-house 3D texture analysis software developed using Matlab (MathWorks Inc., MA, USA). Textural features were extracted for three one-pixel thick 3D layers parallel to the bone-cartilage interface at different cartilage depths, respectively at 10% (L10), 50% (L50) and 90% (L90) of relative cartilage thickness from the bone-cartilage interface. Statistical analysis was performed using Matlab. Differences between groups were analyzed using the Kruskal-Wallis test and differences within the groups using Friedman’s test. P-values were adjusted with Bonferroni correction for multiple comparisons.Results
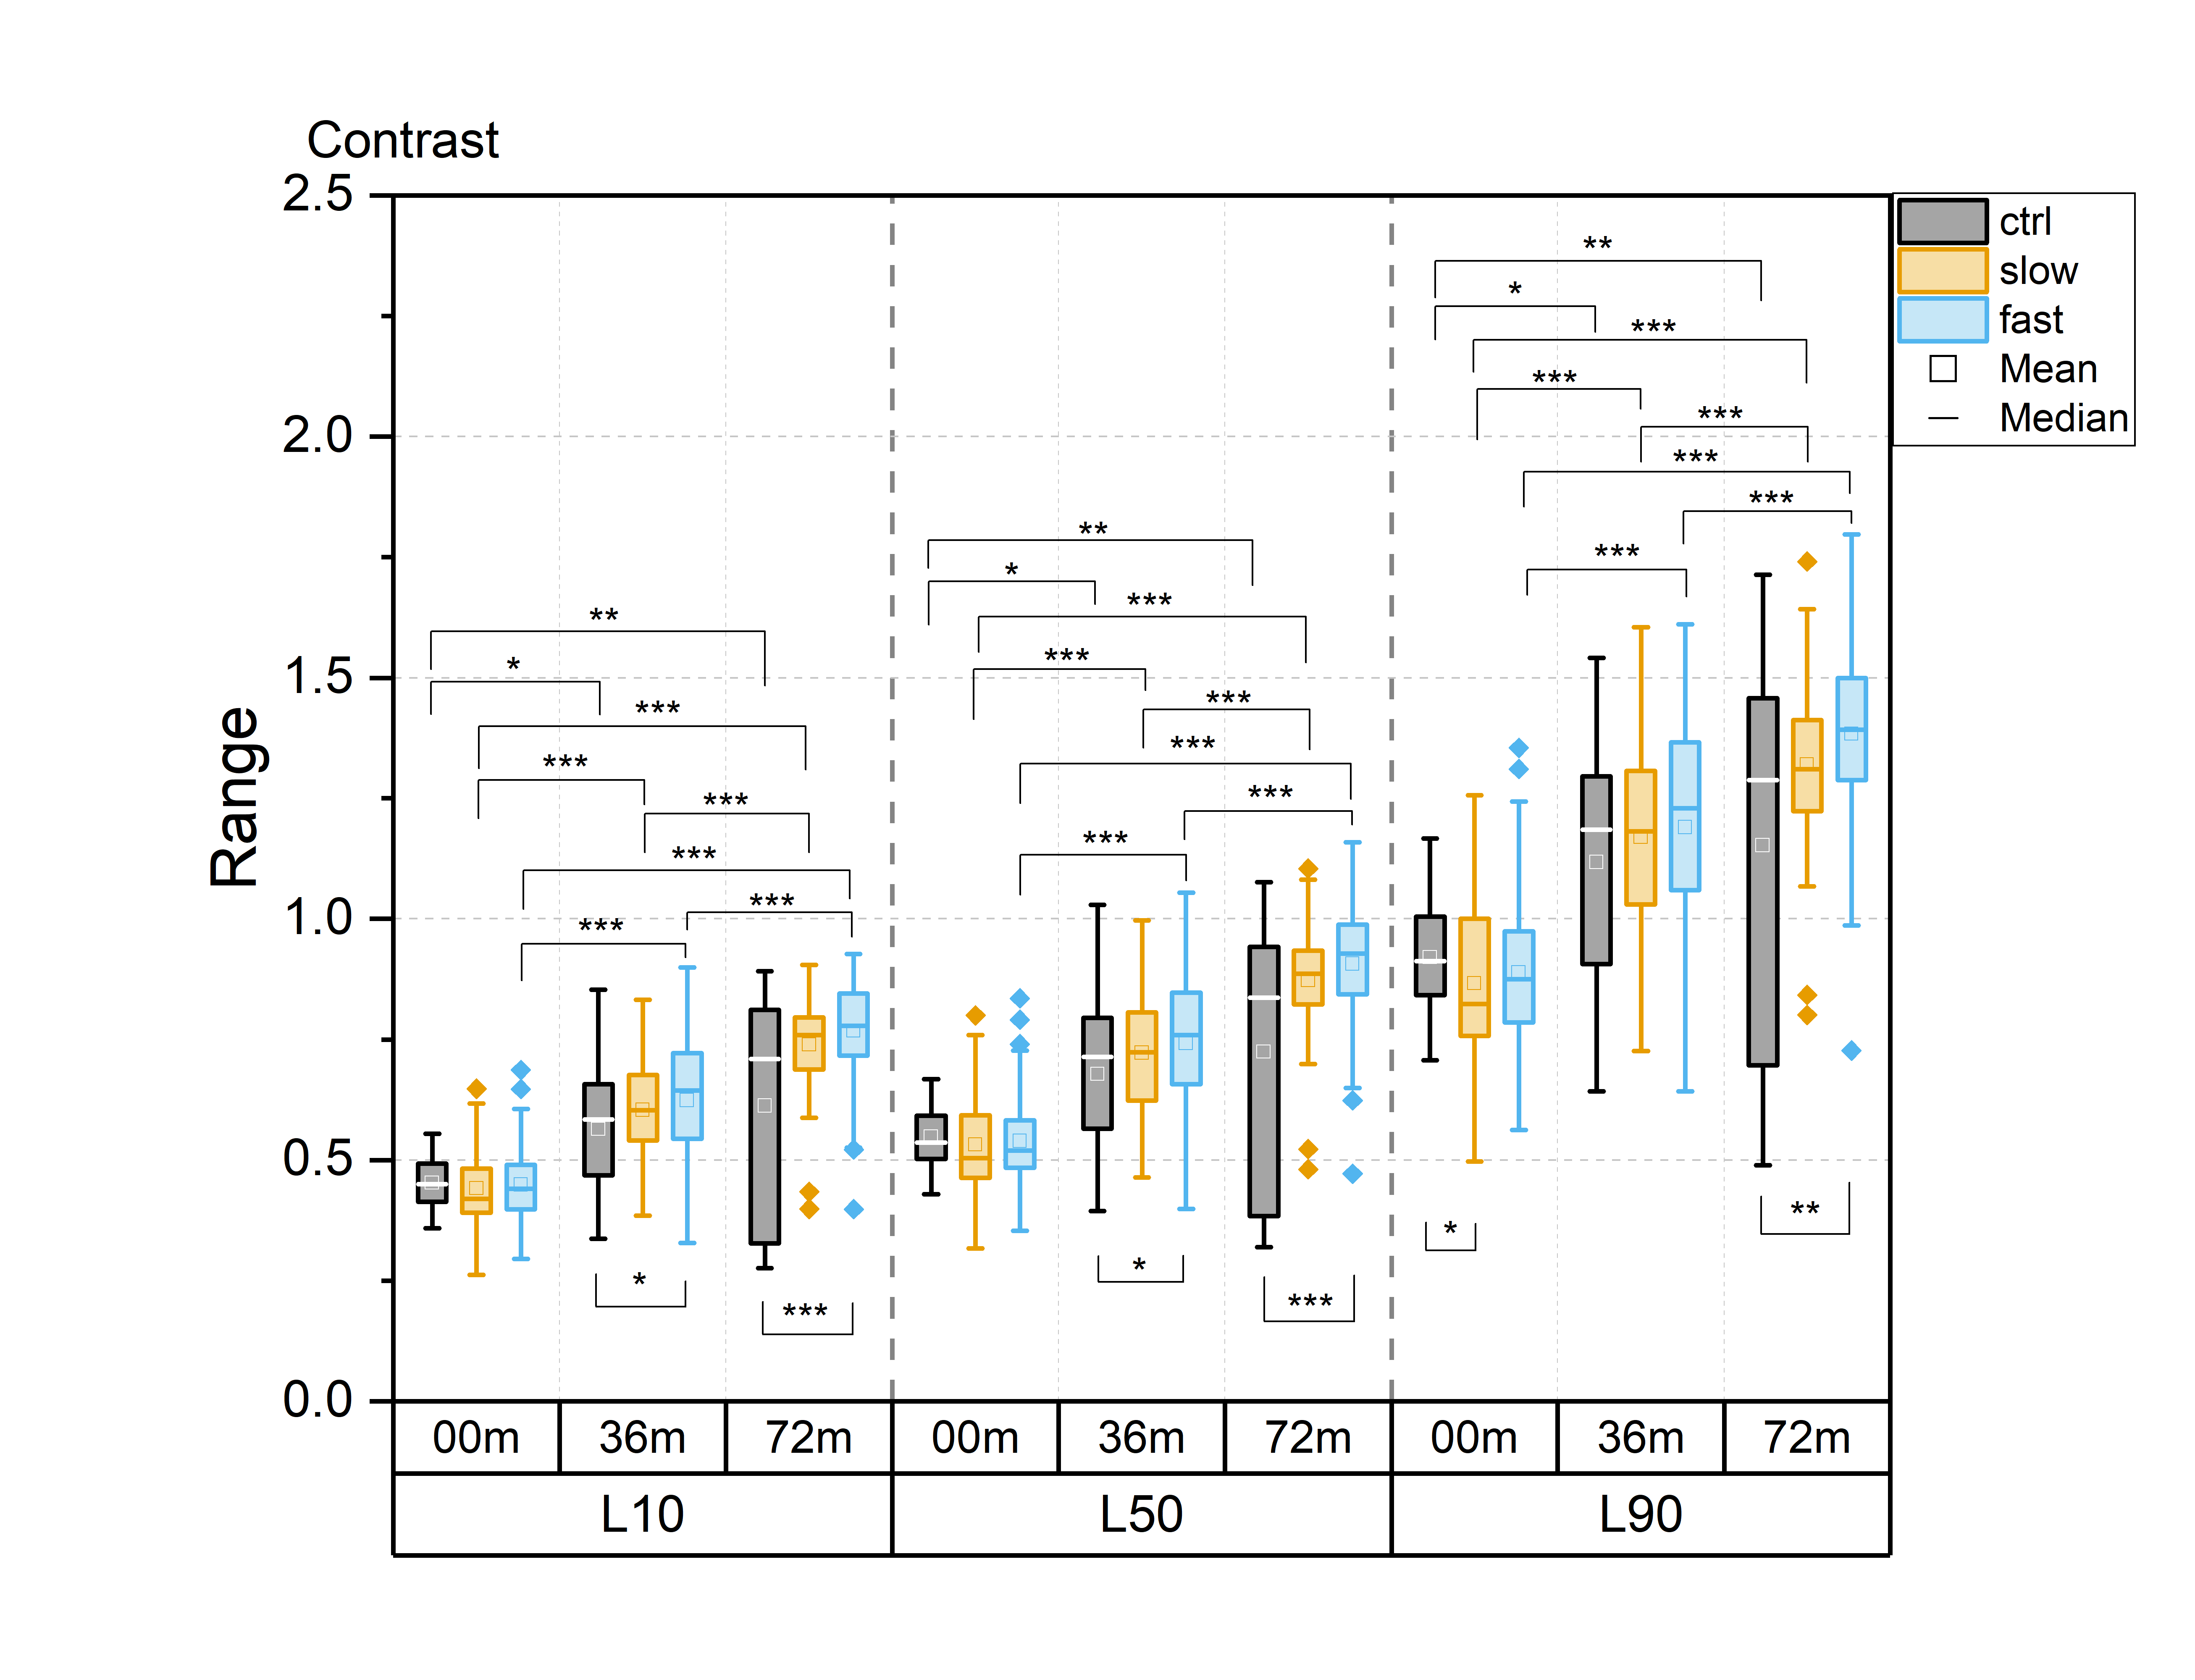
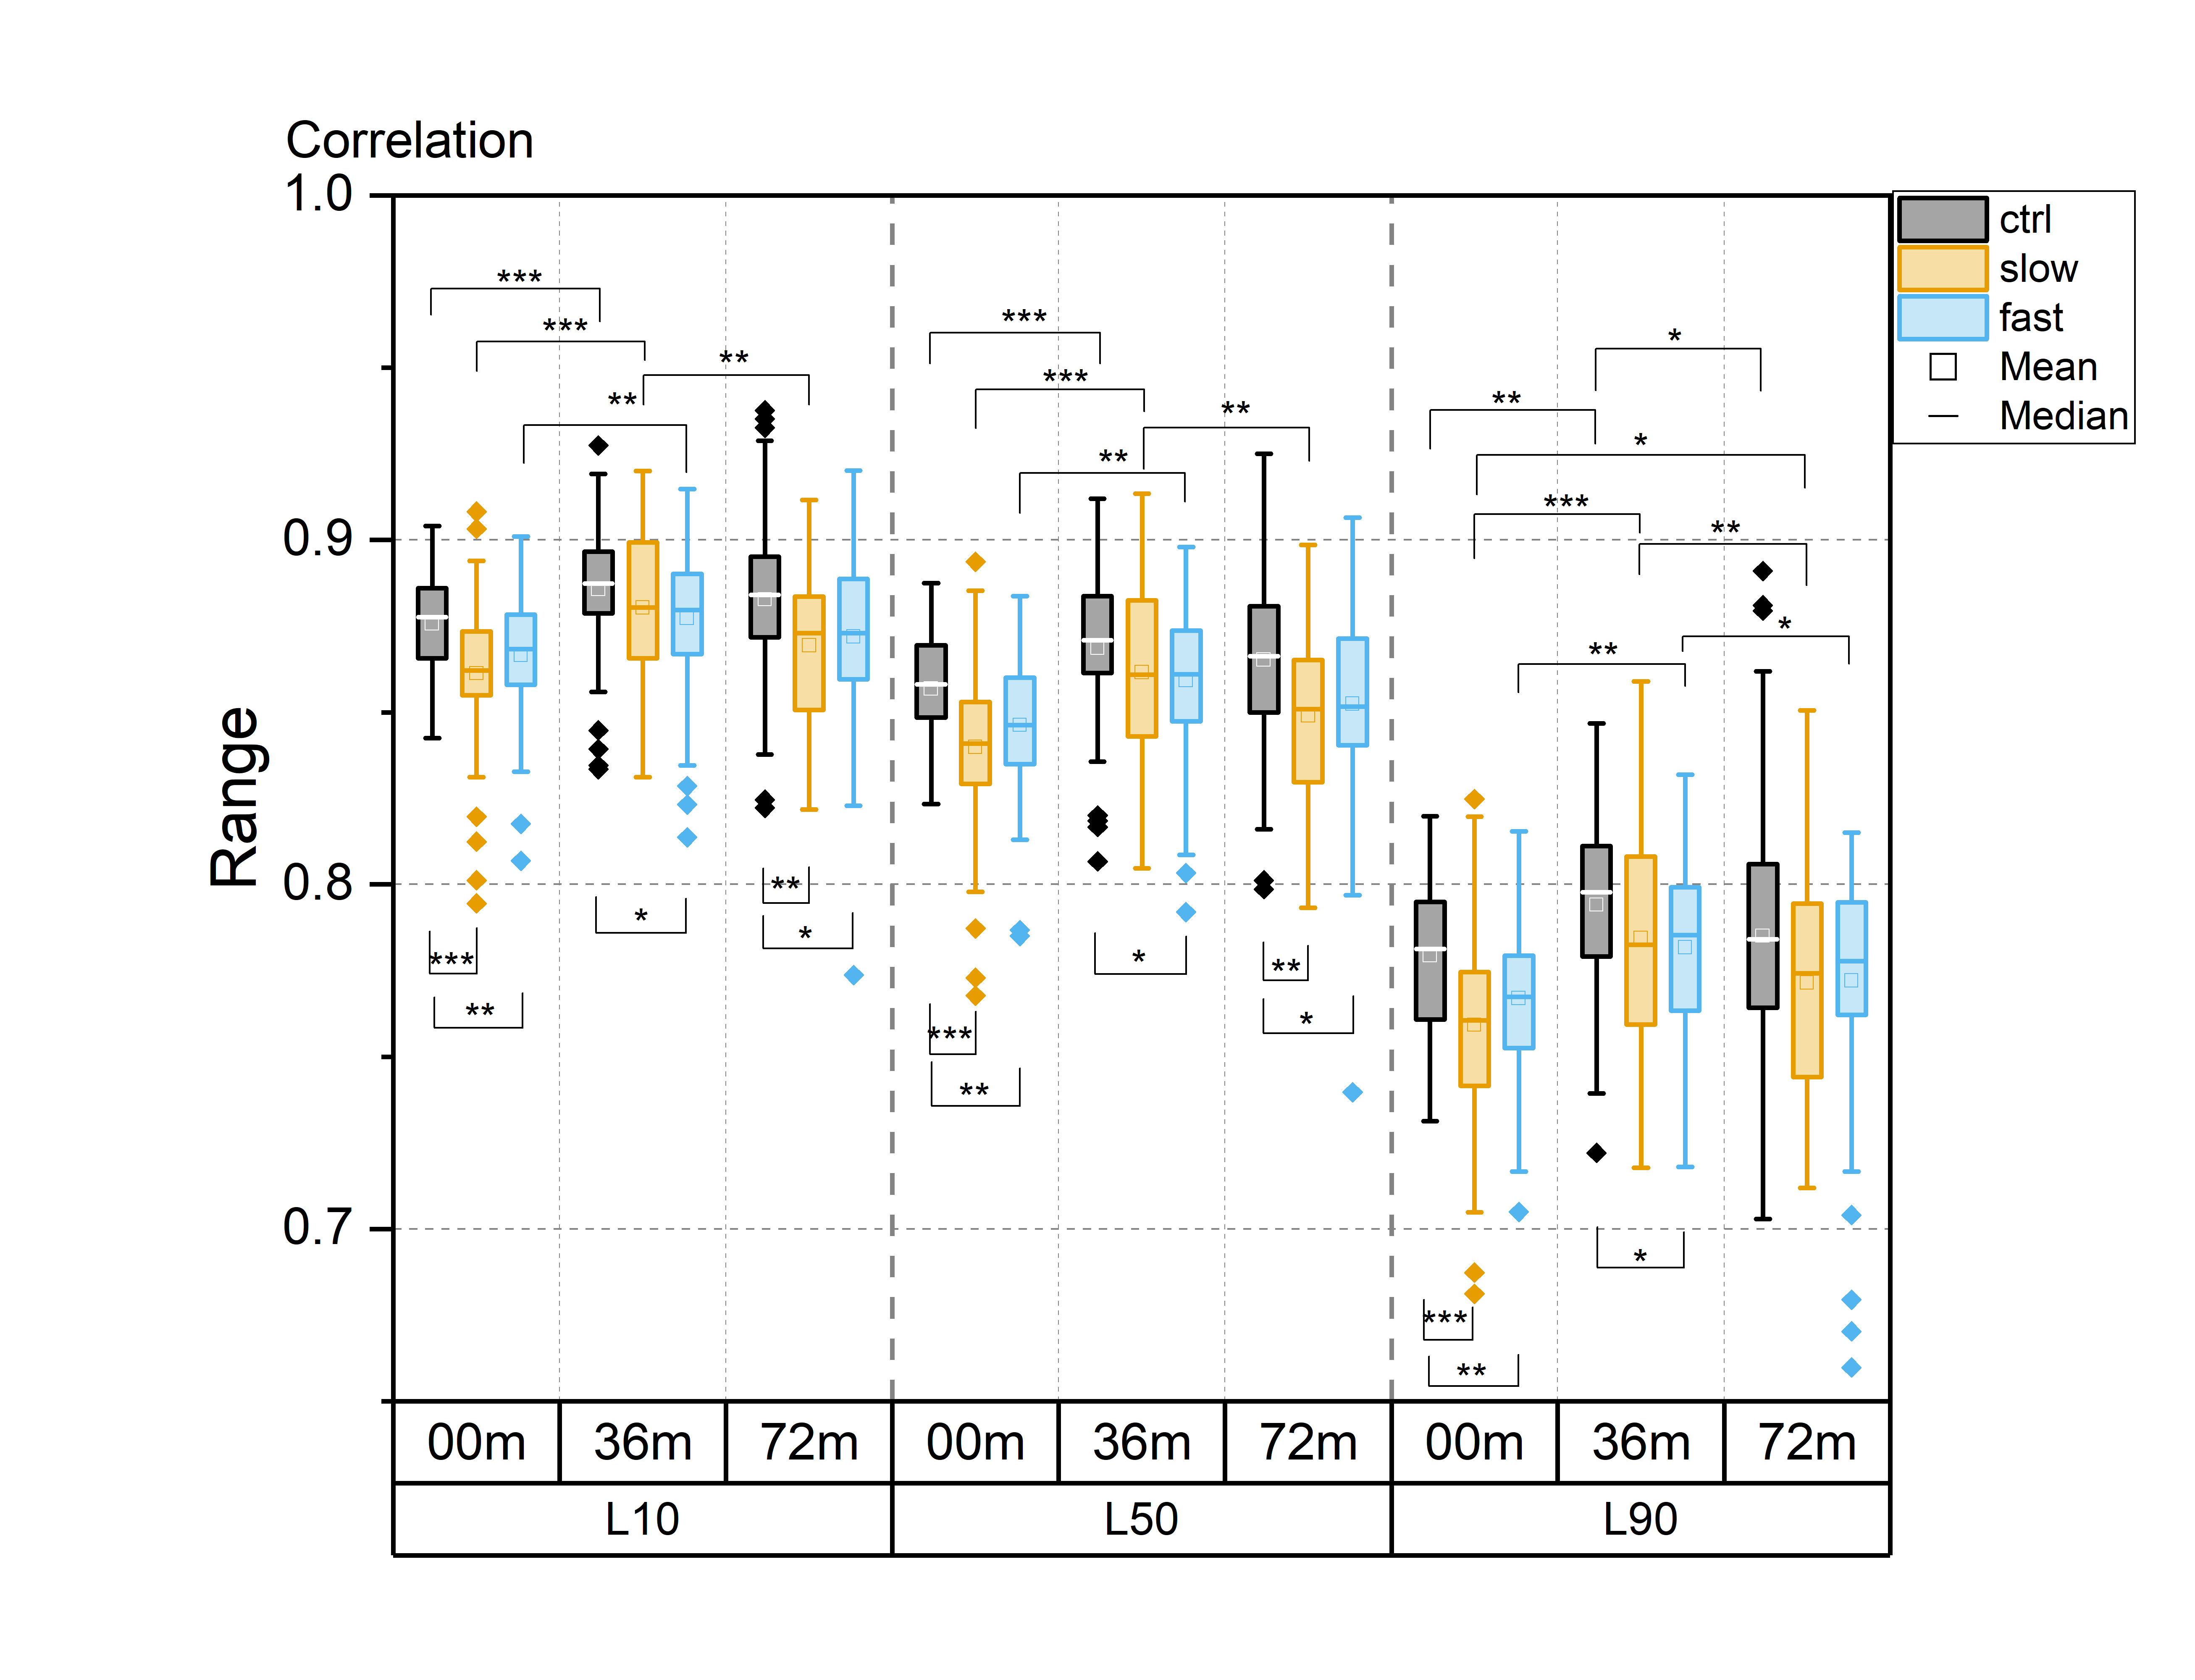
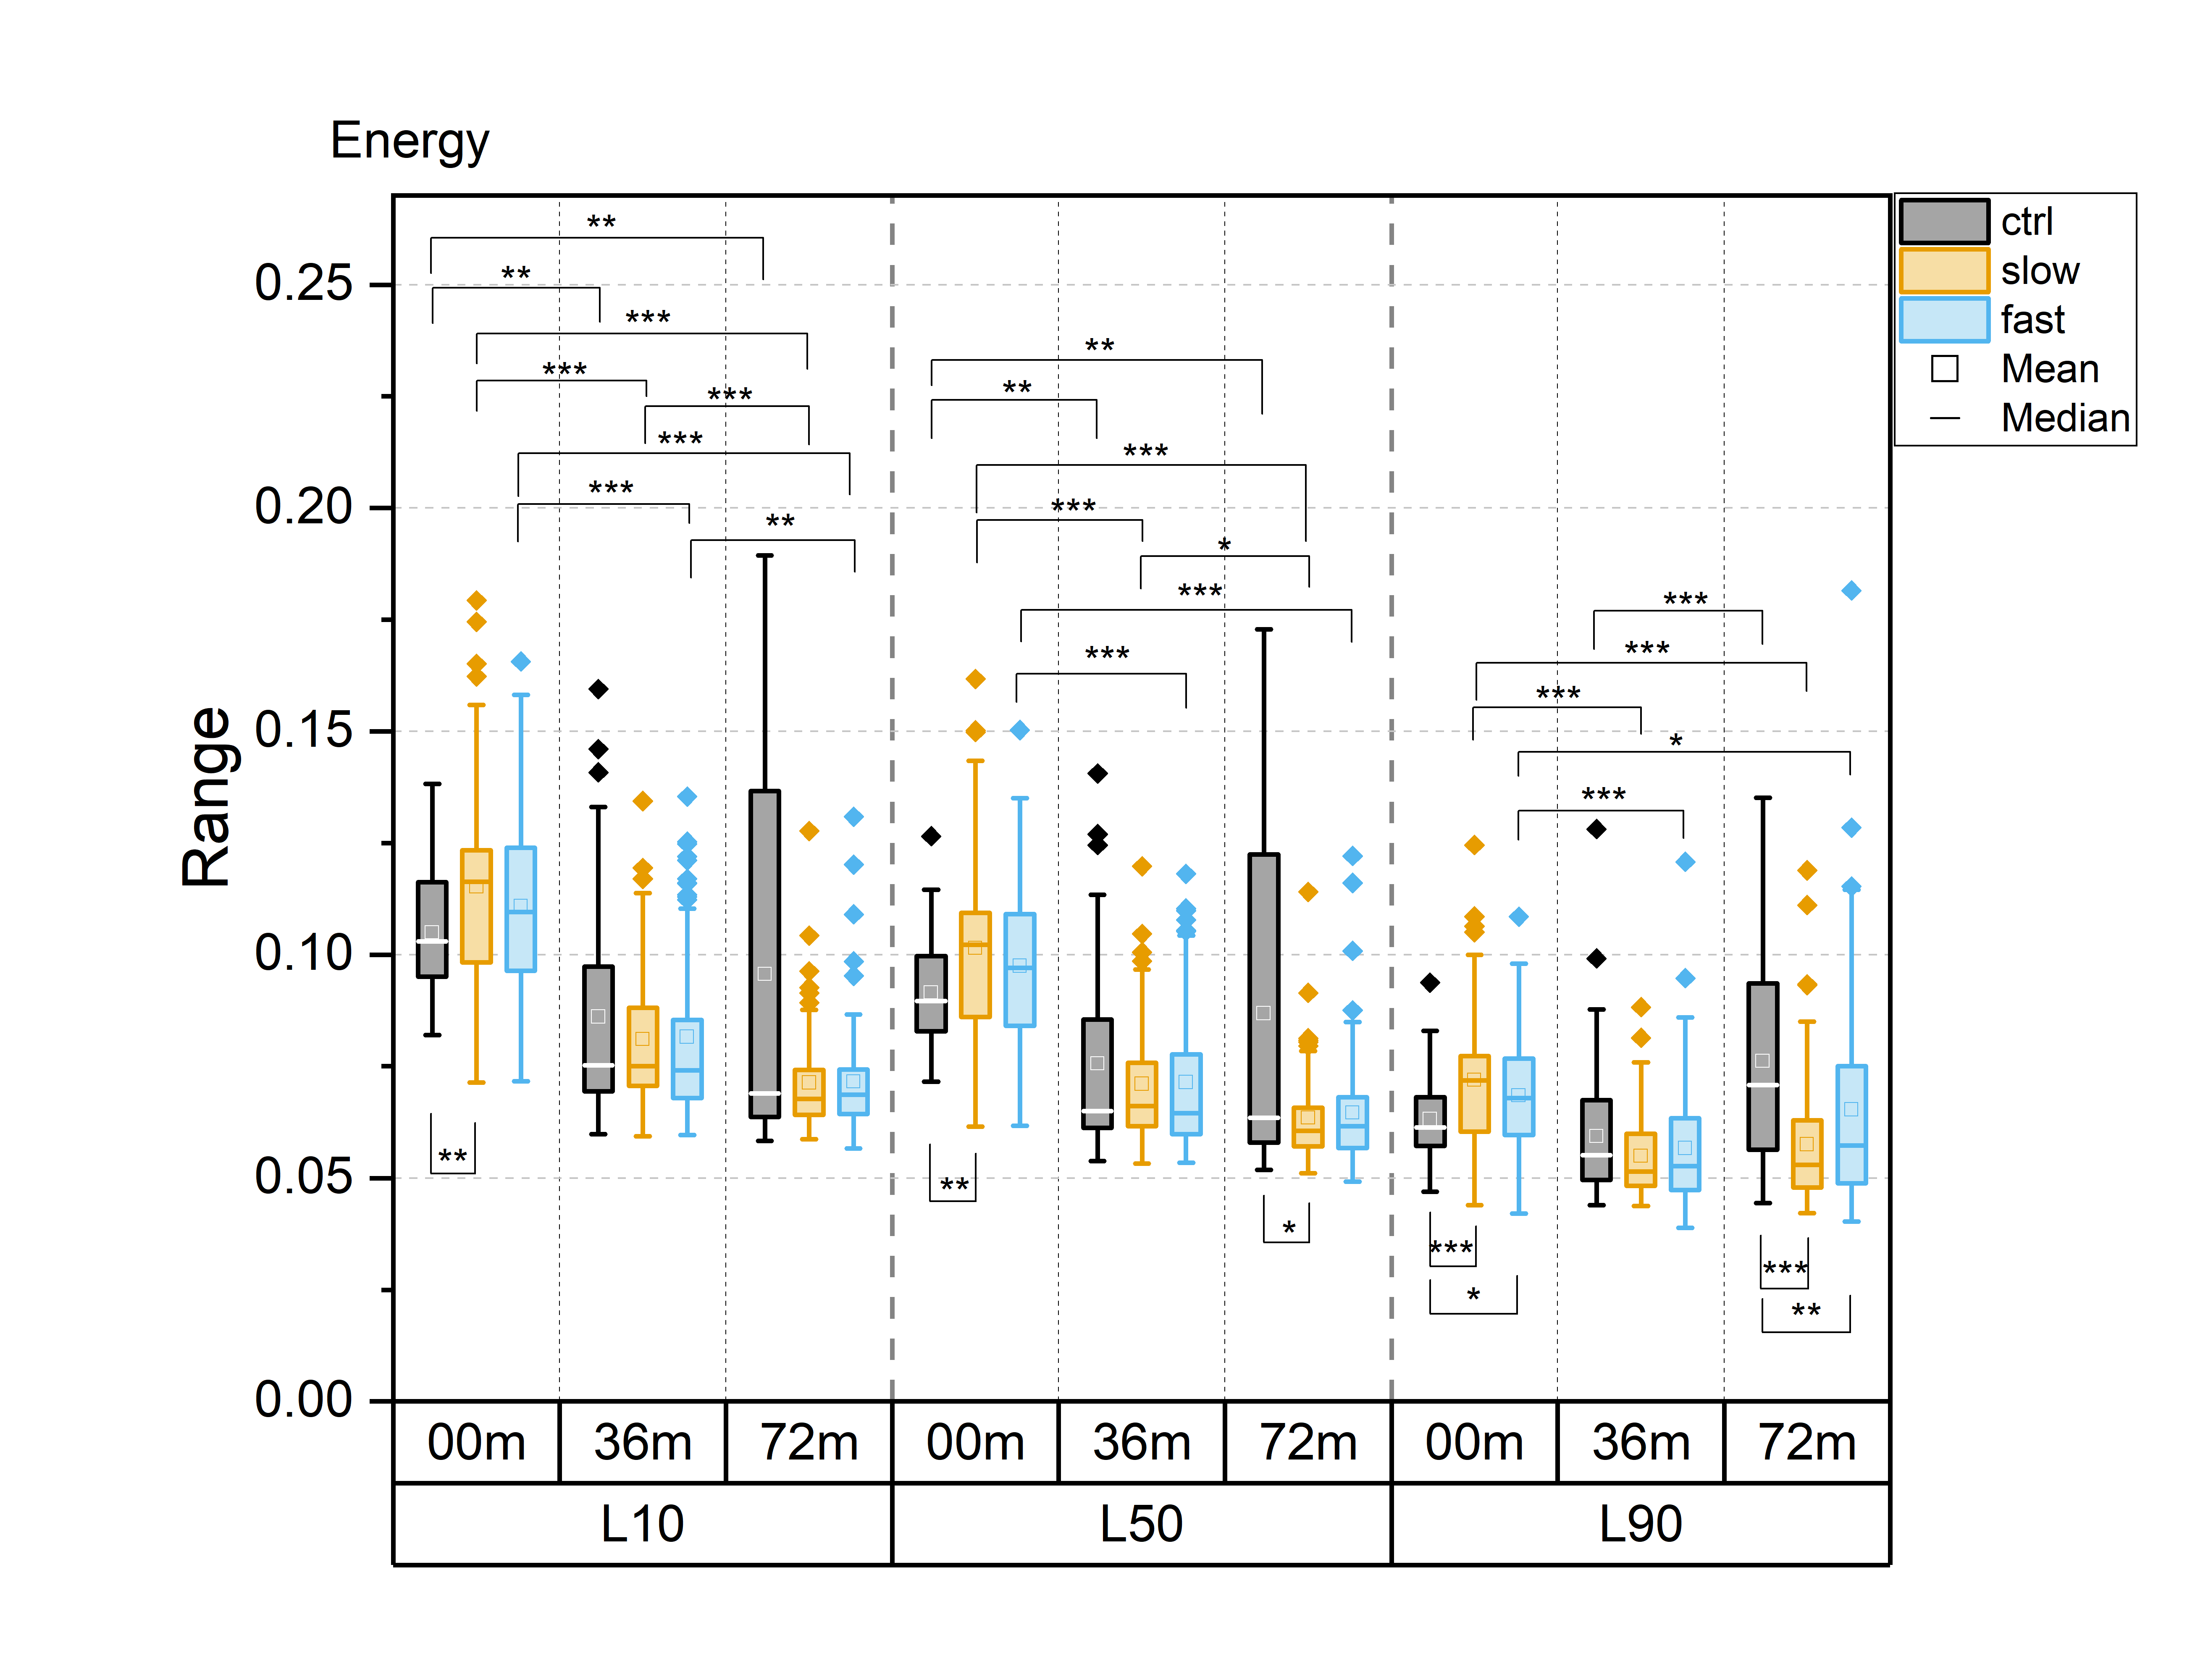
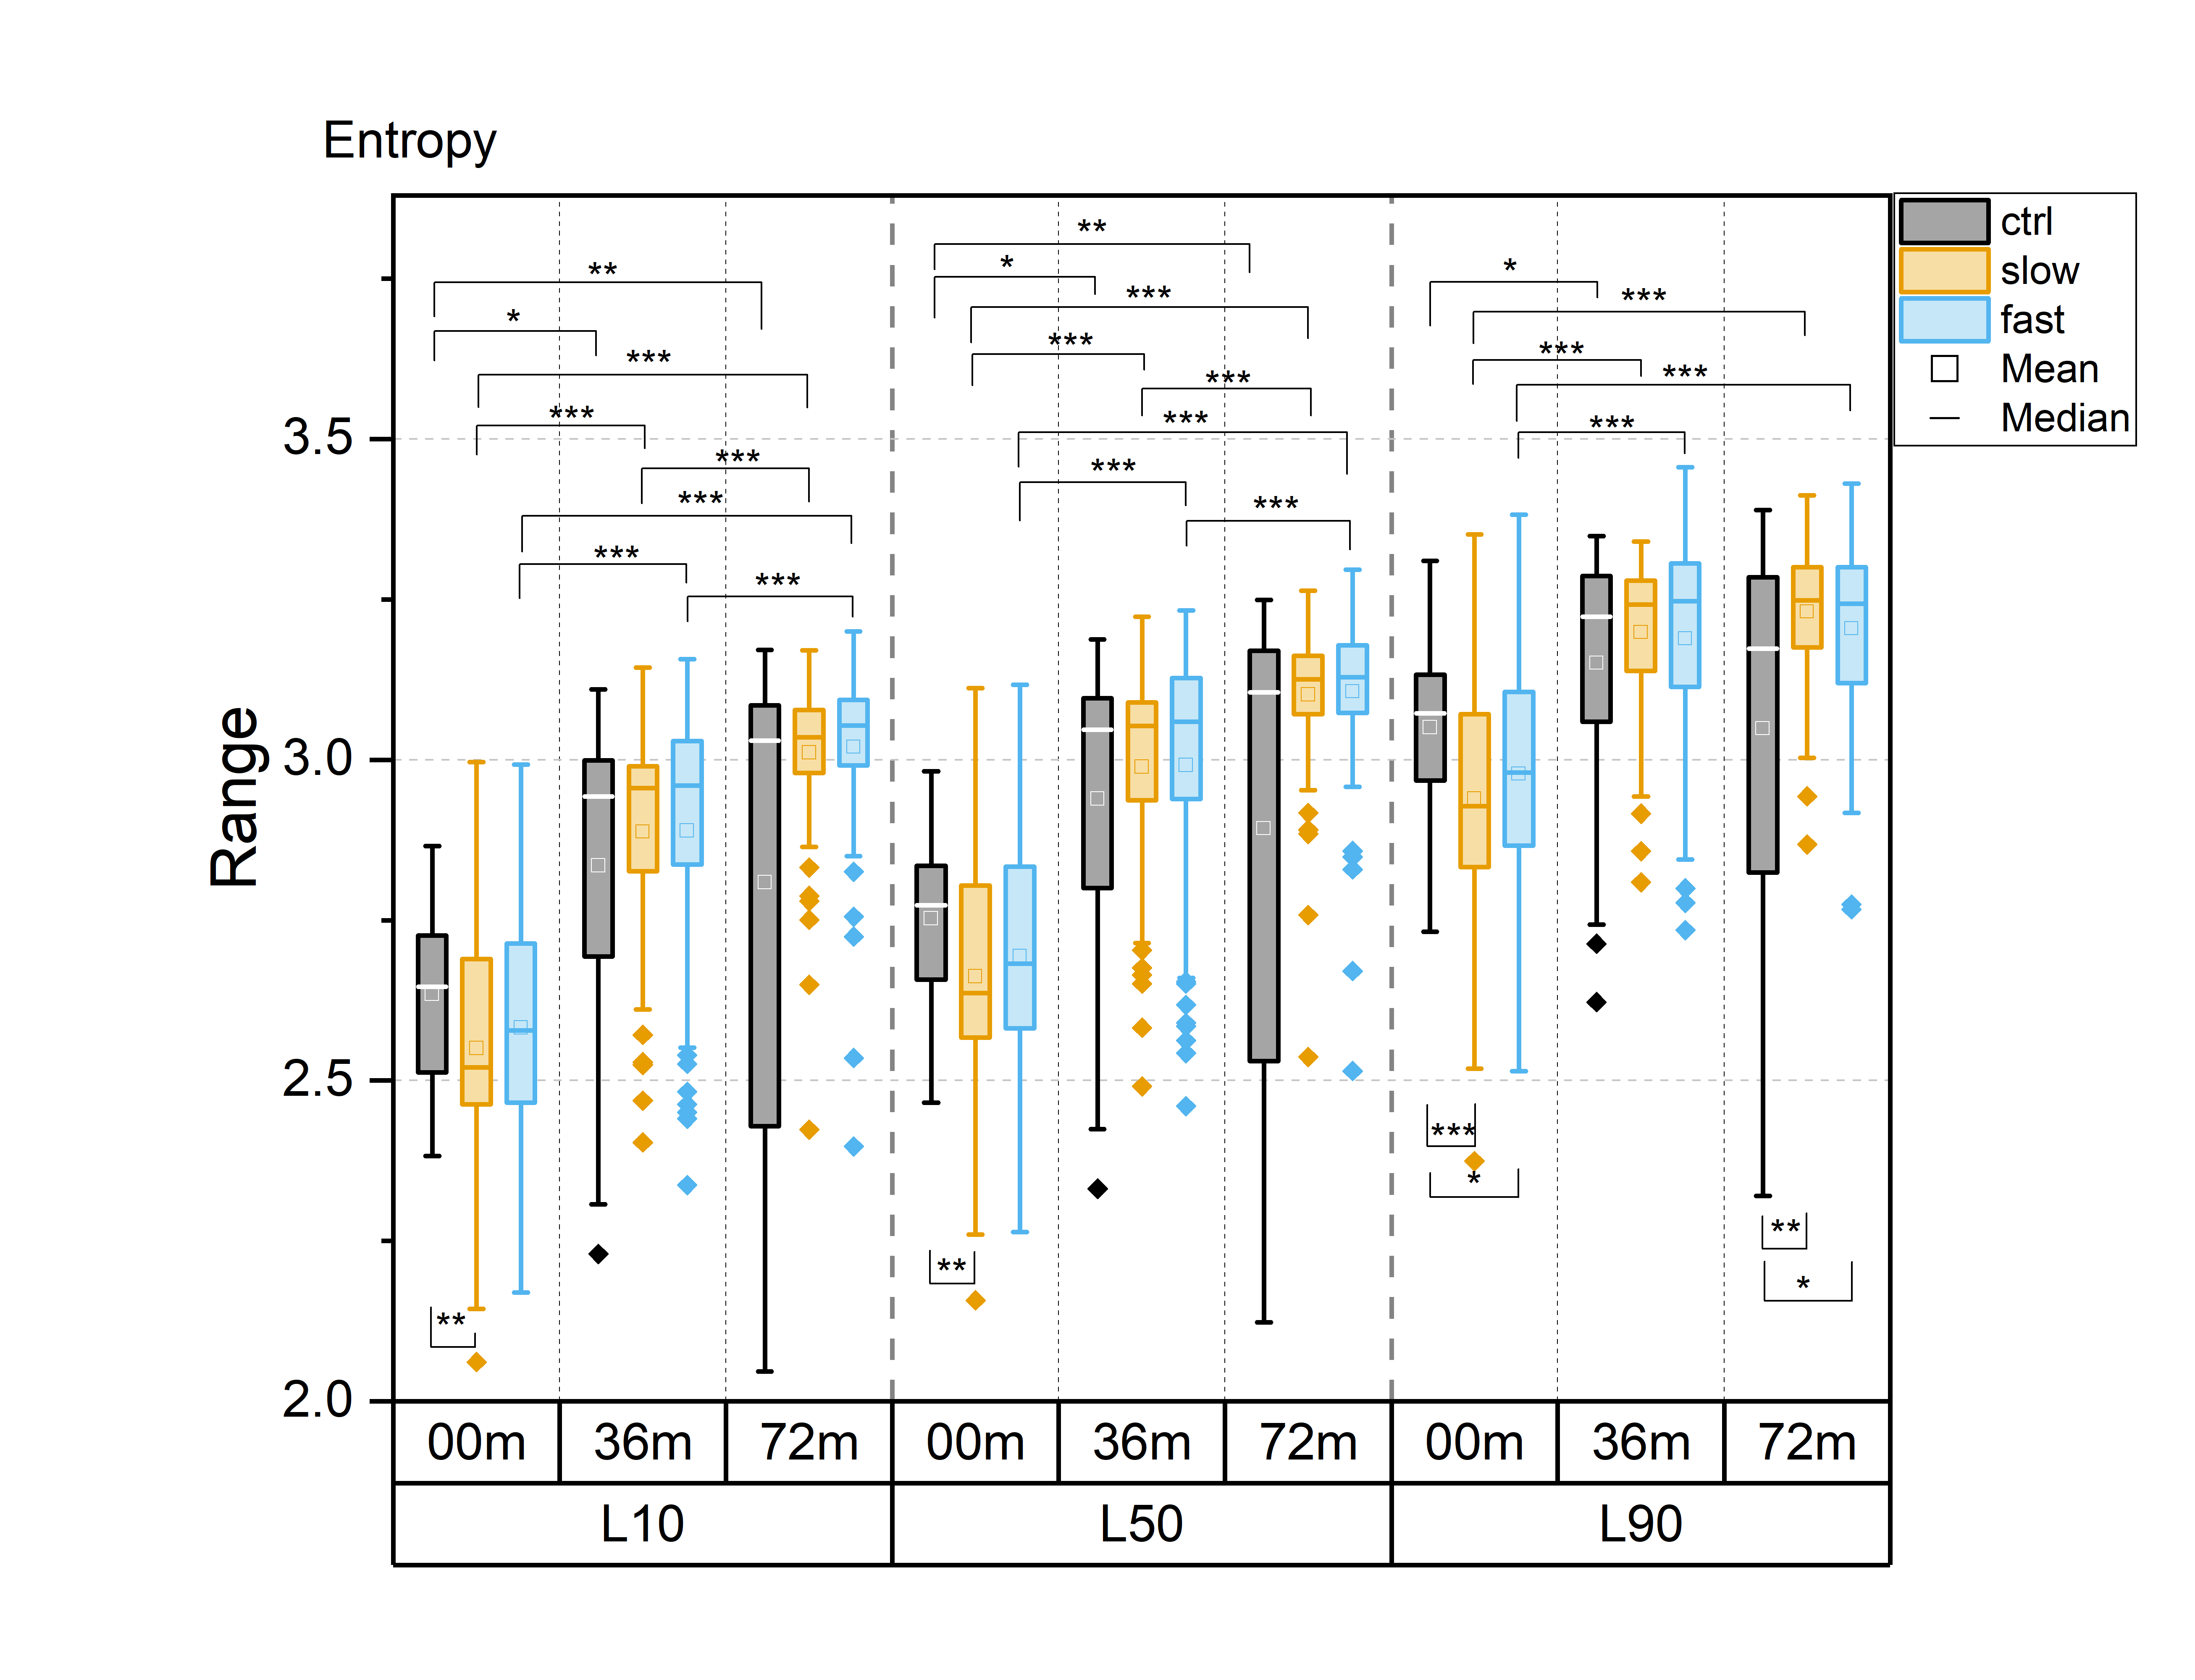
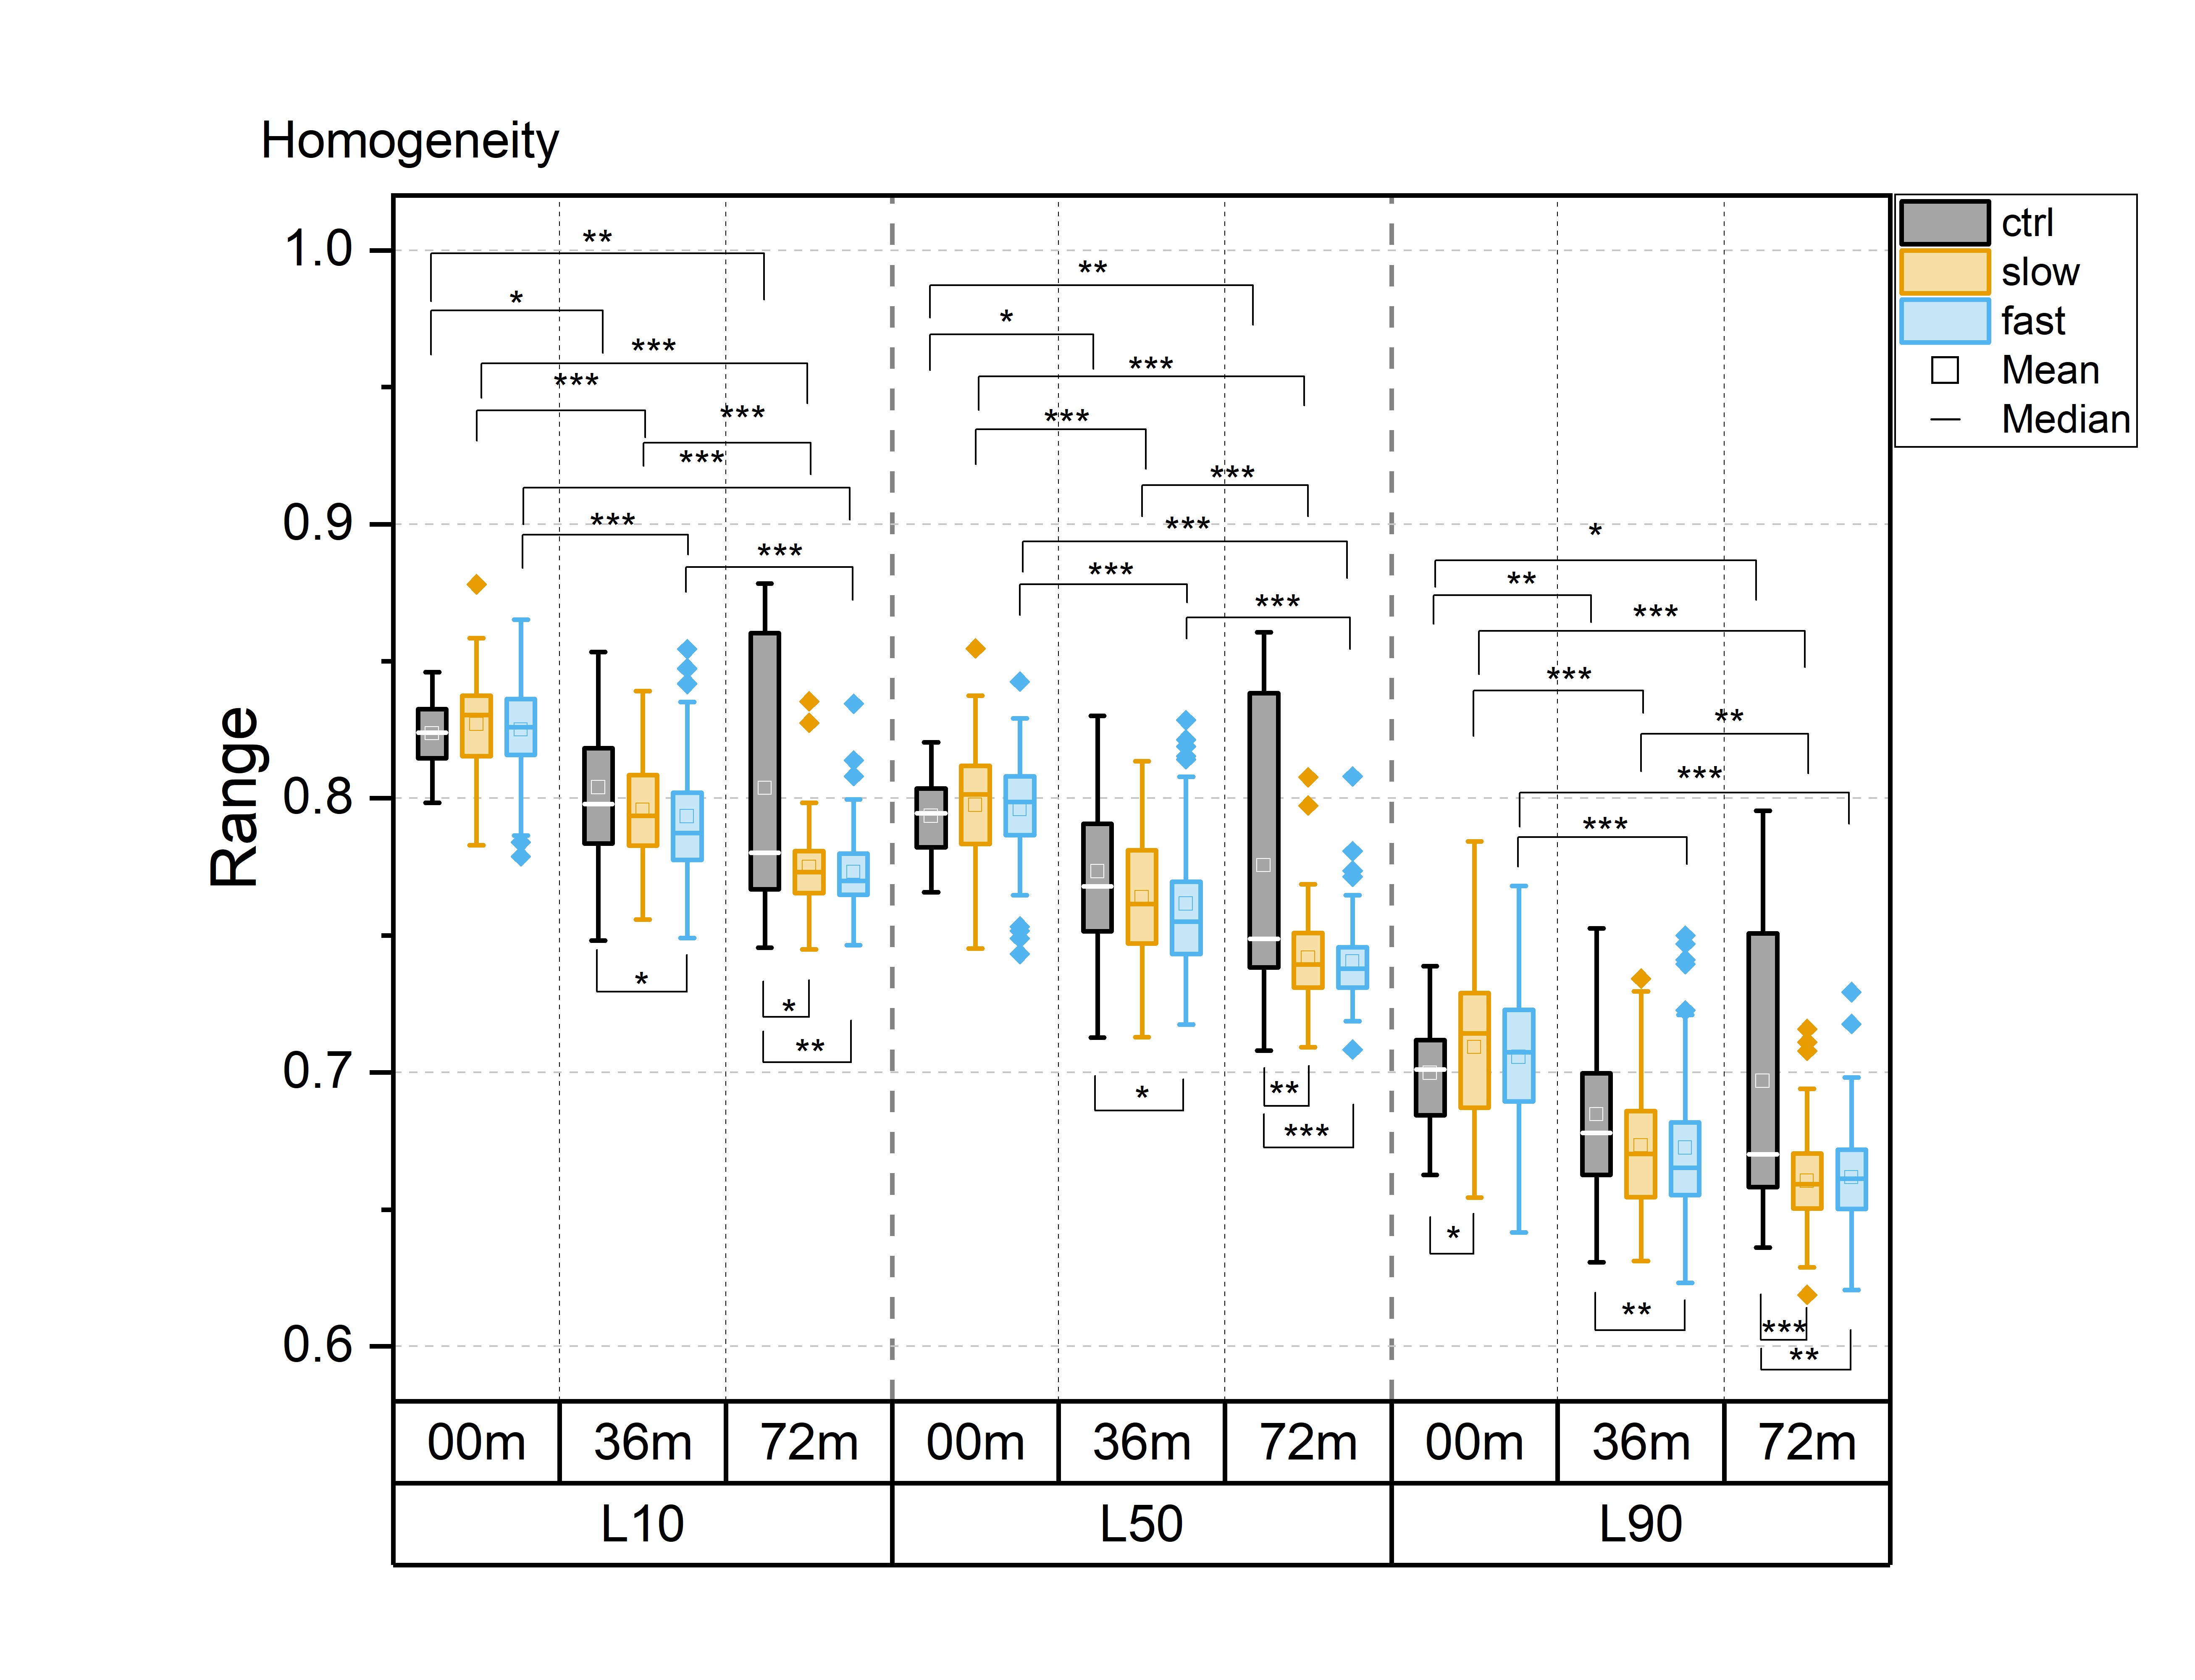
For all textural features, statistically significant differences between time points were observed in all layers, particularly in the progressor groups (Fig. 1-5). Contrast, correlation and entropy increased over time, while homogeneity and energy decreased.At baseline, correlation in progressor groups was significantly lower in all layers, compared to controls (Fig. 2). The energy was elevated and entropy decreased in progressor groups, although, for the fast group only in L90 (Fig. 3-4). The significantly lower contrast and elevated homogeneity were seen only for the slow group in L90 (Fig. 1 and Fig. 5).
At 36m, significant differences were observed only for the fast group, which showed increased contrast (in L10 and L50), and decreased correlation and homogeneity (all layers) compared to controls (Fig. 1, 2 and 5). The same differences were confirmed in fast progressors also at 72m, and only at 72m similar changes were seen in slow progressors in correlation and homogeneity. Decreased energy in all progressors and increased entropy only in the fast progressors were significant in L90 at 72m but not at 36m. No significant differences were observed between the slow and the fast progressor groups at any time point.
Discussion
Texture analysis of 3D DESS was able to differentiate slow and fast progressors from controls already at baseline. Correlation, energy and entropy were the most sensitive textural features to pre-radiographic cartilage changes in progressors, as they showed the highest significant differences compared to controls. At later time points, different textural features showed changes specific to progressor groups, with significant differences often seen in different layers for slow and fast progressors, and changes in slow progressors often preceded by fast progressors. Significant differences were seen in all layers, although most of them resided in L90, confirming that superficial cartilage is the layer most affected by degeneration5.Previous studies have reported elevated values of contrast6, correlation7, energy8, entropy9 and homogeneity8 in T2 maps observed in patients with or at risk for OA, compared to healthy controls. In this study, often the opposite trend was observed in progressor groups compared to controls, suggesting that textural features may behave differently for 3D DESS and T2 maps.
Longitudinal changes were more frequently observed with a higher level of significance for progressor groups. Significant longitudinal changes were also observed in controls. These could be explained by cartilage aging or degeneration captured by the textural features, while not visible in conventional knee radiography. There were no significant differences observed between the slow and fast progressor groups. In the future, a compartmental analysis, particularly focusing on the load-bearing cartilage, could be used to increase the sensitivity of 3D DESS texture analysis to differentiate subjects with different ROA progression rates by identifying regional changes in cartilage tissue.
Conclusion
GLCM-based 3D texture analysis of 3D DESS MR images is sensitive to cartilage degeneration and can distinguish control and progressor groups before diagnosed ROA. Our findings show that 3D texture analysis, combined with the automated segmentation of 3D DESS images, can provide a powerful tool for non-invasive assessment of early cartilage degeneration using a clinically available MRI sequence.Acknowledgements
Support from Jane and Aatos Erkko Foundation is gratefully acknowledged.References
1. Haralick RM, Shanmugam K & Dinstein I. Textural Features for Image Classification. IEEE Transactions on Systems, Man, and Cybernetics 1973:SMC-3:610-621.
2. Peterfy CG, Schneider E & Nevitt M. The osteoarthritis initiative: report on the design rationale for the magnetic resonance imaging protocol for the knee. Osteoarthritis Cartilage 2008:16:1433-1441.
3. Kellgren JH & Lawrence JS. Radiological assessment of osteo-arthrosis. Ann Rheum Dis 1957:16:494-502.
4. Panfilov E, Tiulpin A, Klein S, et al. Improving Robustness of Deep Learning Based Knee MRI Segmentation: Mixup and Adversarial Domain Adaptation. In Proceedings of the IEEE International Conference on Computer Vision Workshops (pp. 0-0). 2019.
5. Mosher TJ, Liu Y, Yang QX, et al. Age dependency of cartilage magnetic resonance imaging T2 relaxation times in asymptomatic women. Arthritis & Rheumatism 2004:50:2820-2828.
6. Joseph GB, Baum T, Carballido-Gamio J, et al. Texture analysis of cartilage T2 maps: individuals with risk factors for OA have higher and more heterogeneous knee cartilage MR T2 compared to normal controls - data from the osteoarthritis initiative. Arthritis Res Ther 2011:13:R153.
7. Carballido-Gamio J, Stahl R, Blumenkrantz G, et al. Spatial analysis of magnetic resonance and relaxation times improves classification between subjects with and without osteoarthritis. Med Phys 2009:36:4059-4067.
8. Williams A, Winalski CS & Chu CR. Early articular cartilage MRI T2 changes after anterior cruciate ligament reconstruction correlate with later changes in T2 and cartilage thickness. J Orthop Res 2017:35:699-706.
9. Blumenkrantz G, Stahl R, Carballido-Gamio J, et al. The feasibility of characterizing the spatial distribution of cartilage T2 using texture analysis. Osteoarthritis and Cartilage 2008:16:584-590.
Figures