0348
Principal Axis and Fiber Aligned 3D Strain / Strain Rate Mapping with Compressed Sensing Velocity Encoded Phase Contrast MRI to study Aging Muscle1Physics, UC San Diego, La Jolla, CA, United States, 2Physics, San Diego State University, San Diego, CA, United States, 3Radiology, UC San Diego, La Jolla, CA, United States
Synopsis
Strain and Strain rate tensors can be computed from velocity encoded phase contrast imaging. The study of the variation of deformation indices with force output (% Maximum Voluntary Contraction (MVC)) can provide information on the aging muscle. However, such studies have been limited by the long acquisition time precluding its use at high MVCs and in older subjects. We developed a compressed sensing VE-PC technique to enable acquisitions across a range of MVCs and applicable to older subjects as well. Significant differences in the deformation indices were seen between 11 young / 8 senior subjects as well between different %MVCs.
Introduction:
The ability to image tissue deformations provides a non-invasive way to study muscle kinematics at the voxel level. Strain and Strain rate $$$\left( \mathbf{SR} \right)$$$ imaging based on velocity encoded phase contrast imaging has been recently established as a viable methodology to capture tissue deformations1. The variation of the deformation indices with submaximal force output (% Maximum Voluntary Contraction, MVC) can provide information on stress-strain like relationships. However, such studies have been limited by the long sequence time precluding its use at high MVCs. We have developed a compressed sensing (CS) VE-PCI technique to enable acquisitions across a range of MVCs to extract 3D Strain and SR tensors. The CS technique combines multiple coils and a $$$k_{y}t$$$-SENSE SPARSE reconstruction to obtain artifact free images in 75 seconds. The objective was to study the differences in 3D strain and $$$\mathbf{SR}$$$ tensor components (in the principal and fiber aligned frames of reference) with age and with %MVC.Methods:
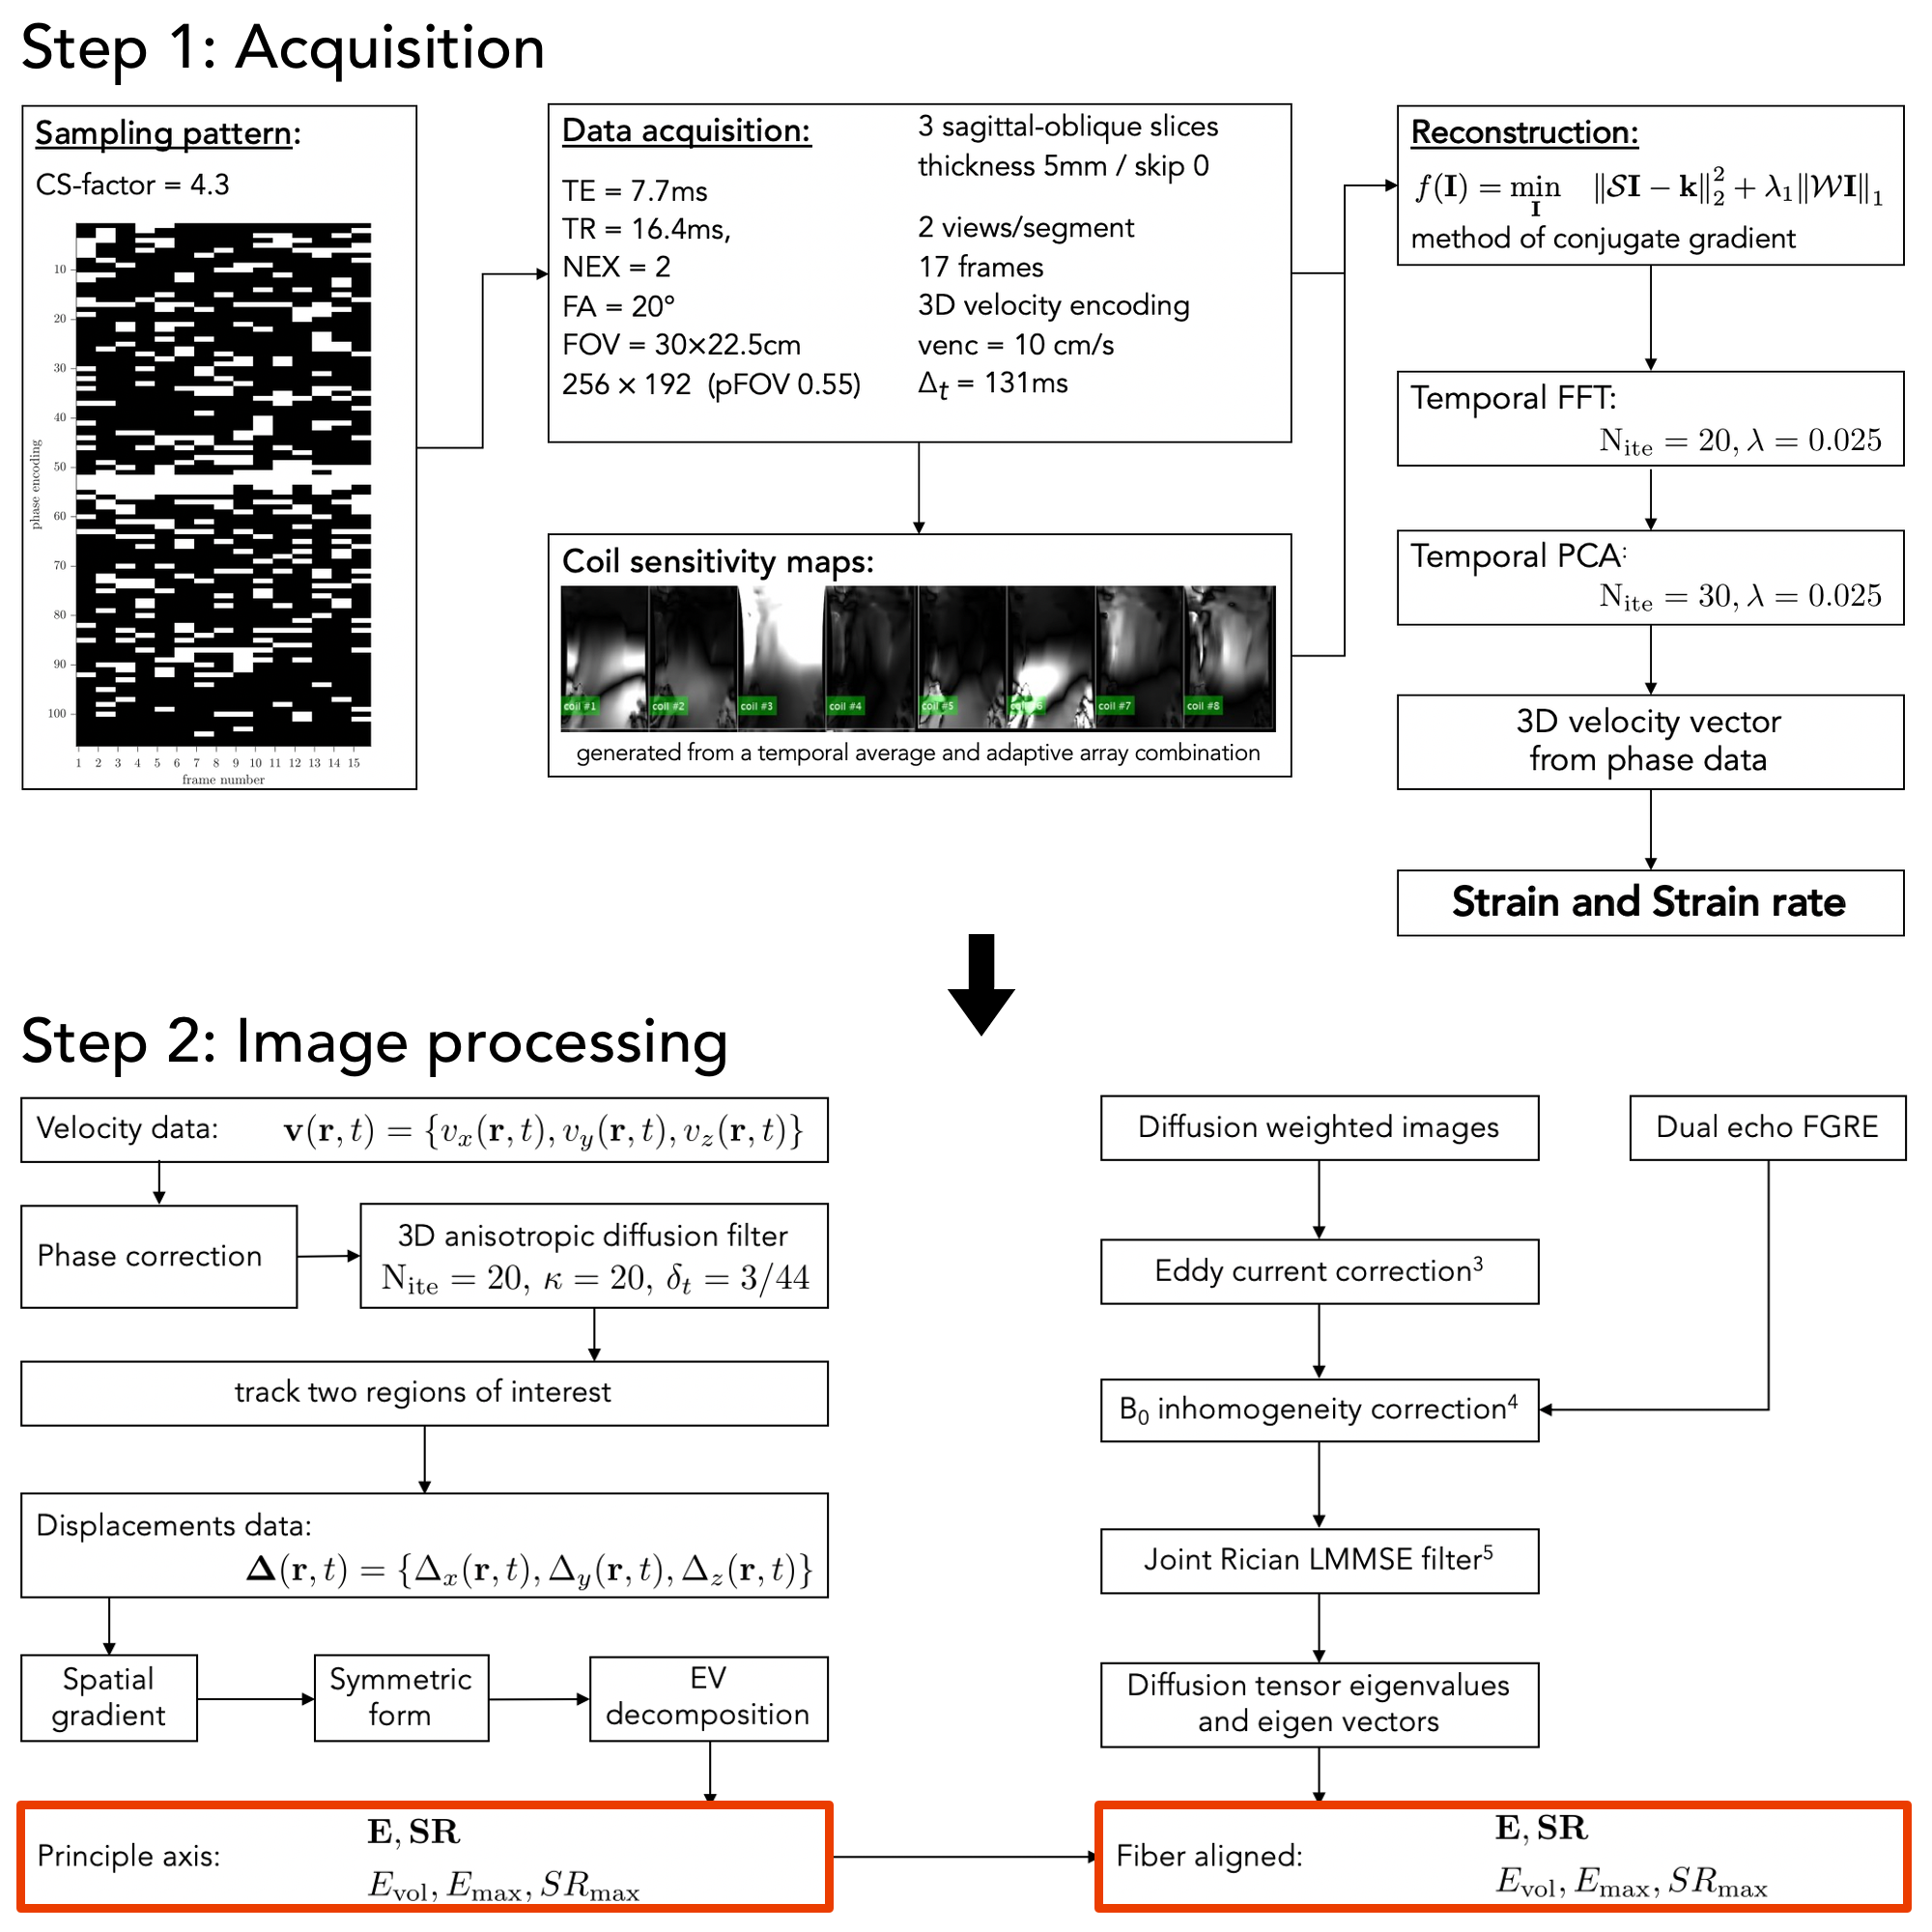
11 young (28 ± 7 yrs) and 8 senior (74 ± 6 yrs ) subjects were recruited after IRB approval and scanned on a 1.5T GE scanner. Data acquisition and image processing pipeline are summarized in Figure 1. Gated VE-PC images were obtained during 3 submaximal isometric contraction levels (TE: 7.7ms, TR: 16.4ms, NEX: 2, FA: 20°, slice thickness 5 mm, sagittal-oblique orientation, FOV: 30×22.5cm (partial-phase FOV: 0.55), matrix: 256×192, 17 phases, 3D velocity encoding, venc = 10cm/s, 24 repetitions, cycle length 2.9s). Three contiguous slices were acquired at each %MVC for a total of nine dynamic acquisitions; each dynamic scan was 75 seconds resulting in ×8.6 times accelerated acquisition (CS-factor of 4.3, Views per Segment (VPS) = 2). The protocol also included a geometrically matched spin echo DTI EPI sequence. The multi-coil CS scheme used a variable density random undersampling with maximum density at the center of k-space. A two-step$$$k_{y}t$$$-SENSE SPARSE CS joint reconstruction (of reference and velocity encoded images) was performed2 using the coil sensitivities with a temporal FFT followed by a temporal PCA as the sparsifying transforms. The lower leg was resting against foot-pedal device3 with strain sensor and anchored in an 8-channel RF coil; real-time visual feedback was provided to the subject. Data sets were obtained for submaximal forces (30, 40 and 60% MVC) for all subjects. 3D strain and $$$\mathbf{SR}$$$ tensors were calculated for the central slice of the three acquired slices. Prior to the analysis, phase-contrast images were corrected for phase shading artifacts and denoised using a 3D anisotropic diffusion filter4. Voxels in the entire volume were tracked to obtain displacements and locations in subsequent temporal frames. The 3D strain and $$$\mathbf{SR}$$$ images were generated from the spatial gradients of the velocity and displacement images; both Eulerian and Lagrangian strains and $$$\mathbf{SR}$$$ were evaluated. Two invariants were calculated from the rank 2 strain and $$$\mathbf{SR}$$$ tensors (volumetric and maximum shear strain rate $$$SR_{\mathrm{max}}$$$). The strain and strain tensors in principal axis were rotated to the DTI eigenvector frame of reference. The rotation matrix, $$$\mathbf{R}$$$ was generated from the DTI eigenvectors to reorient the strain and $$$\mathbf{SR}$$$ tensors from:$$\mathbf{SR}_{\mathrm{DTI}} = \mathbf{R} \cdot \mathbf{SR} \cdot \mathbf{R}^{\mathrm{T}}$$
Quantitative analysis was performed for a ROI placed in medial gastrocnemius and soleus muscles (7×7). Indices were extracted at the frame corresponding to maximum $$$SR_{fiber}$$$ during the contraction part of the cycle.
Results:
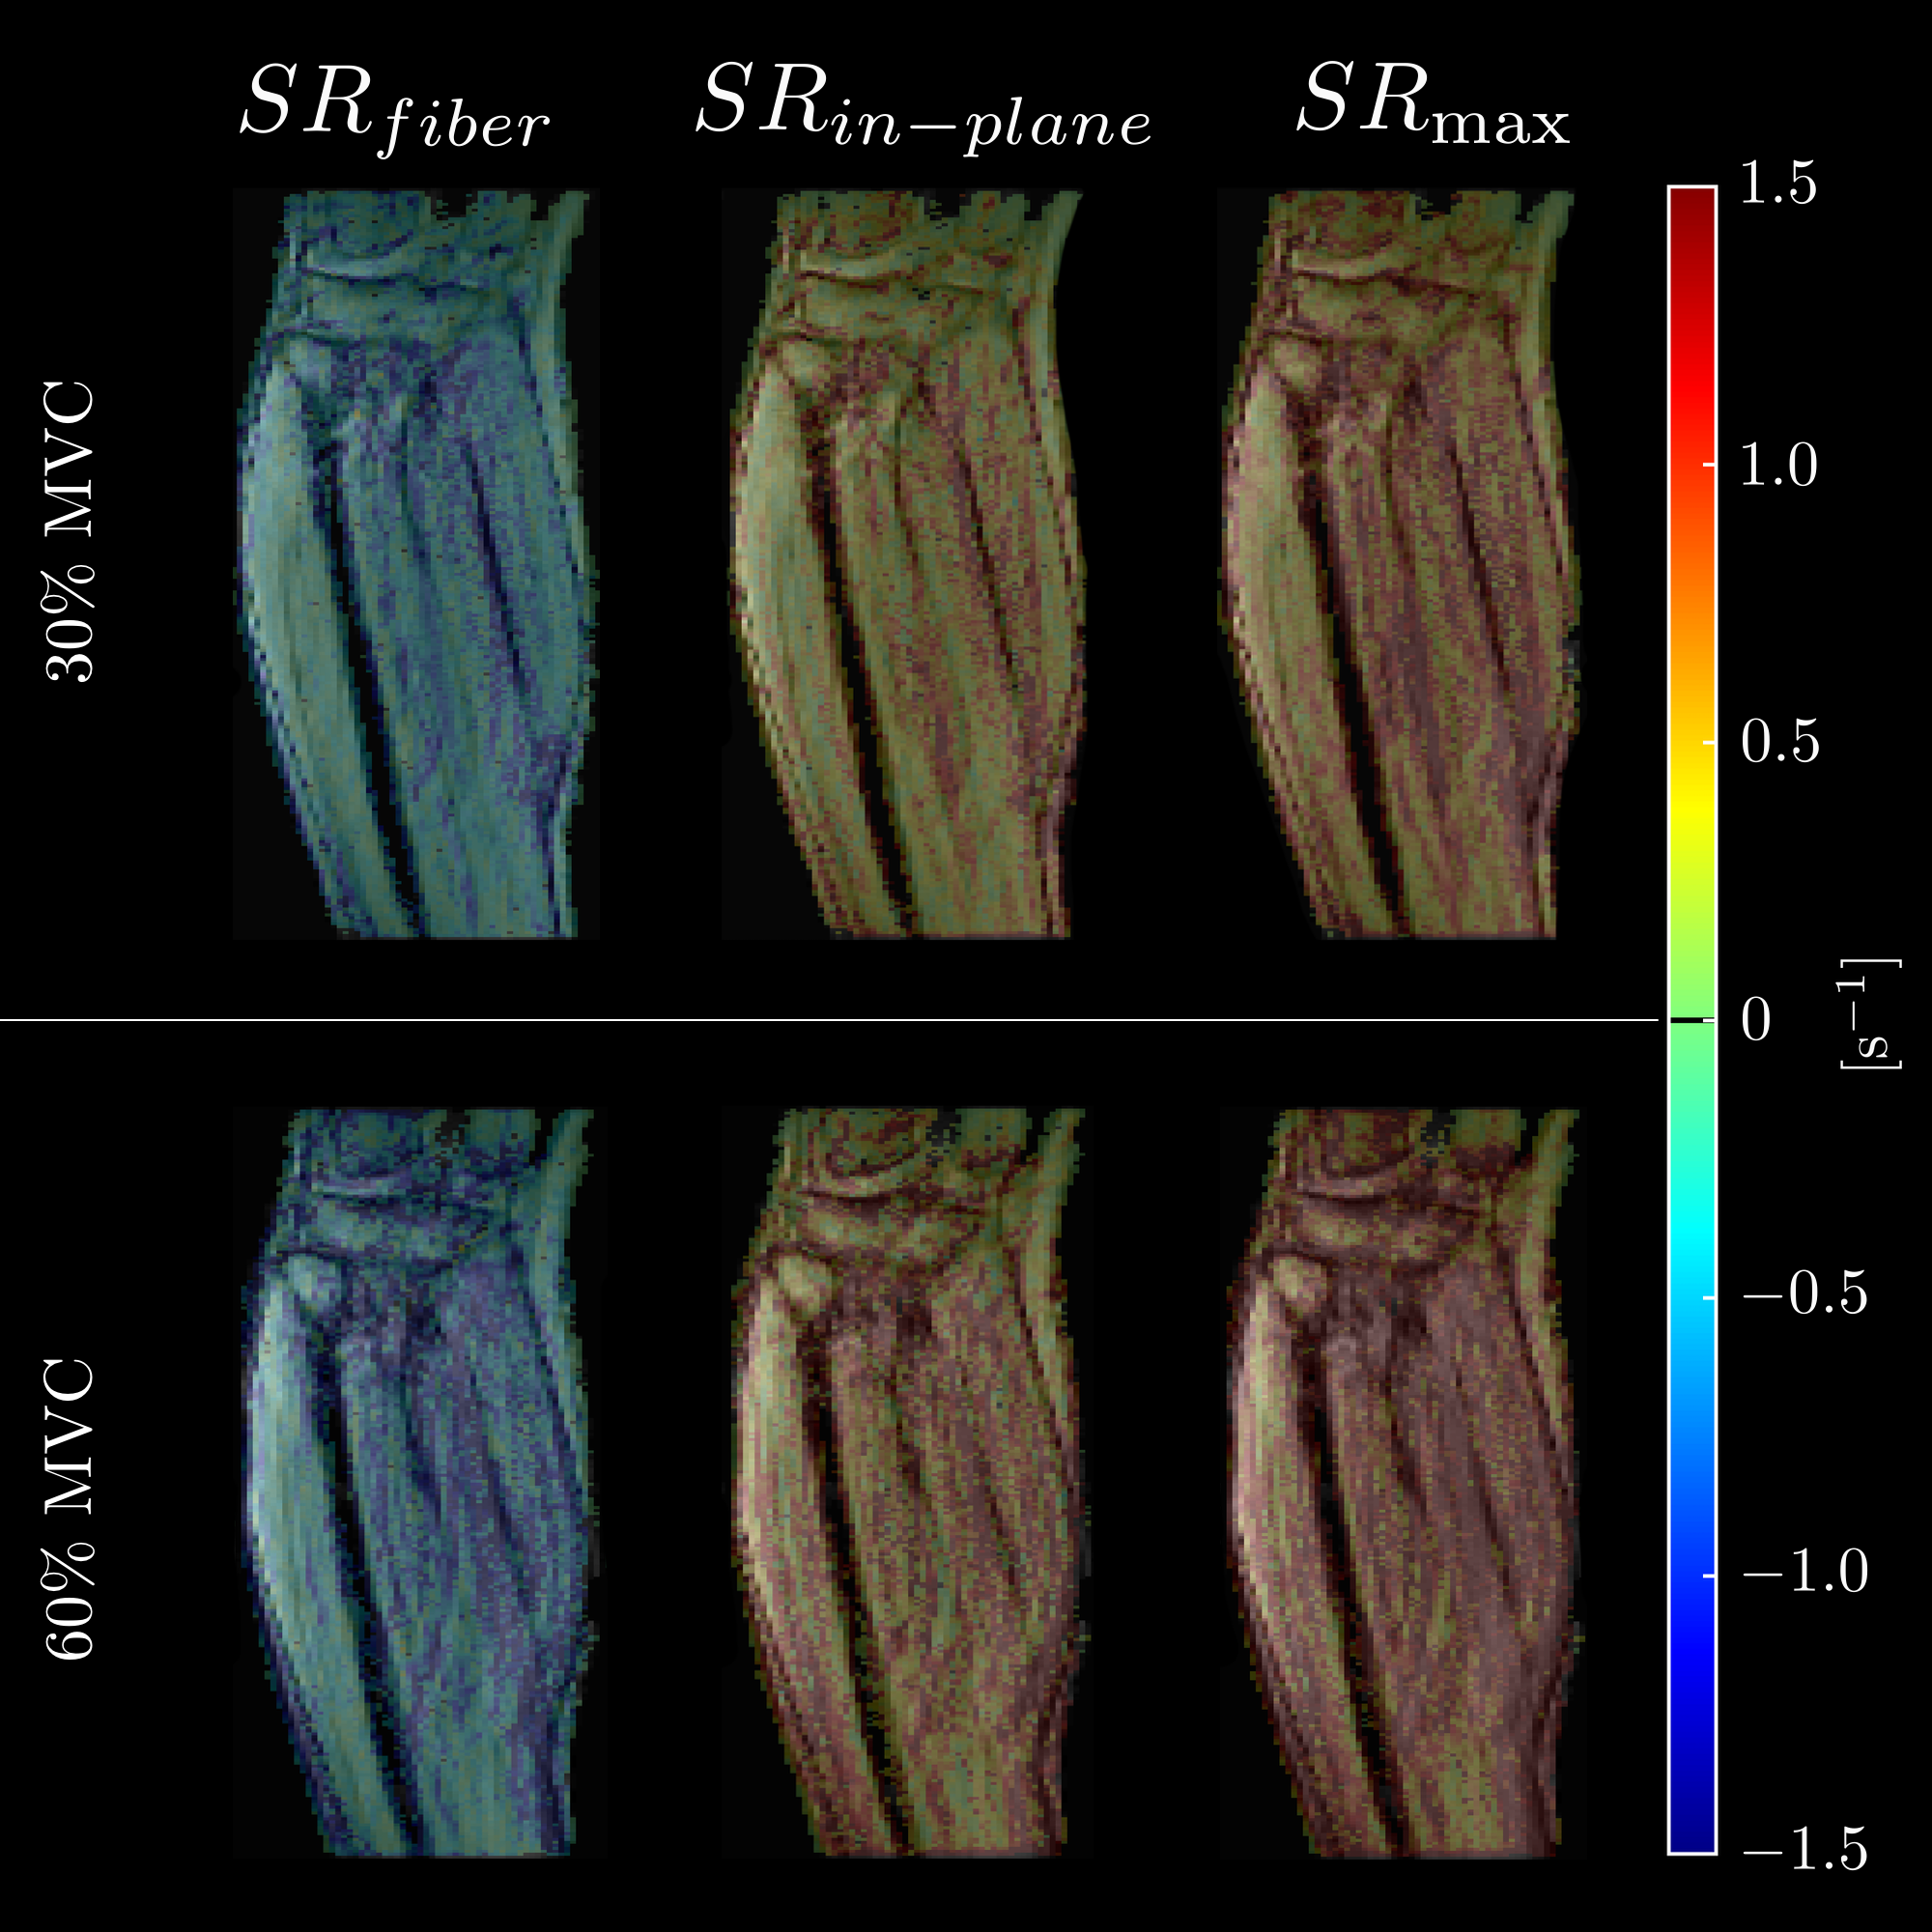
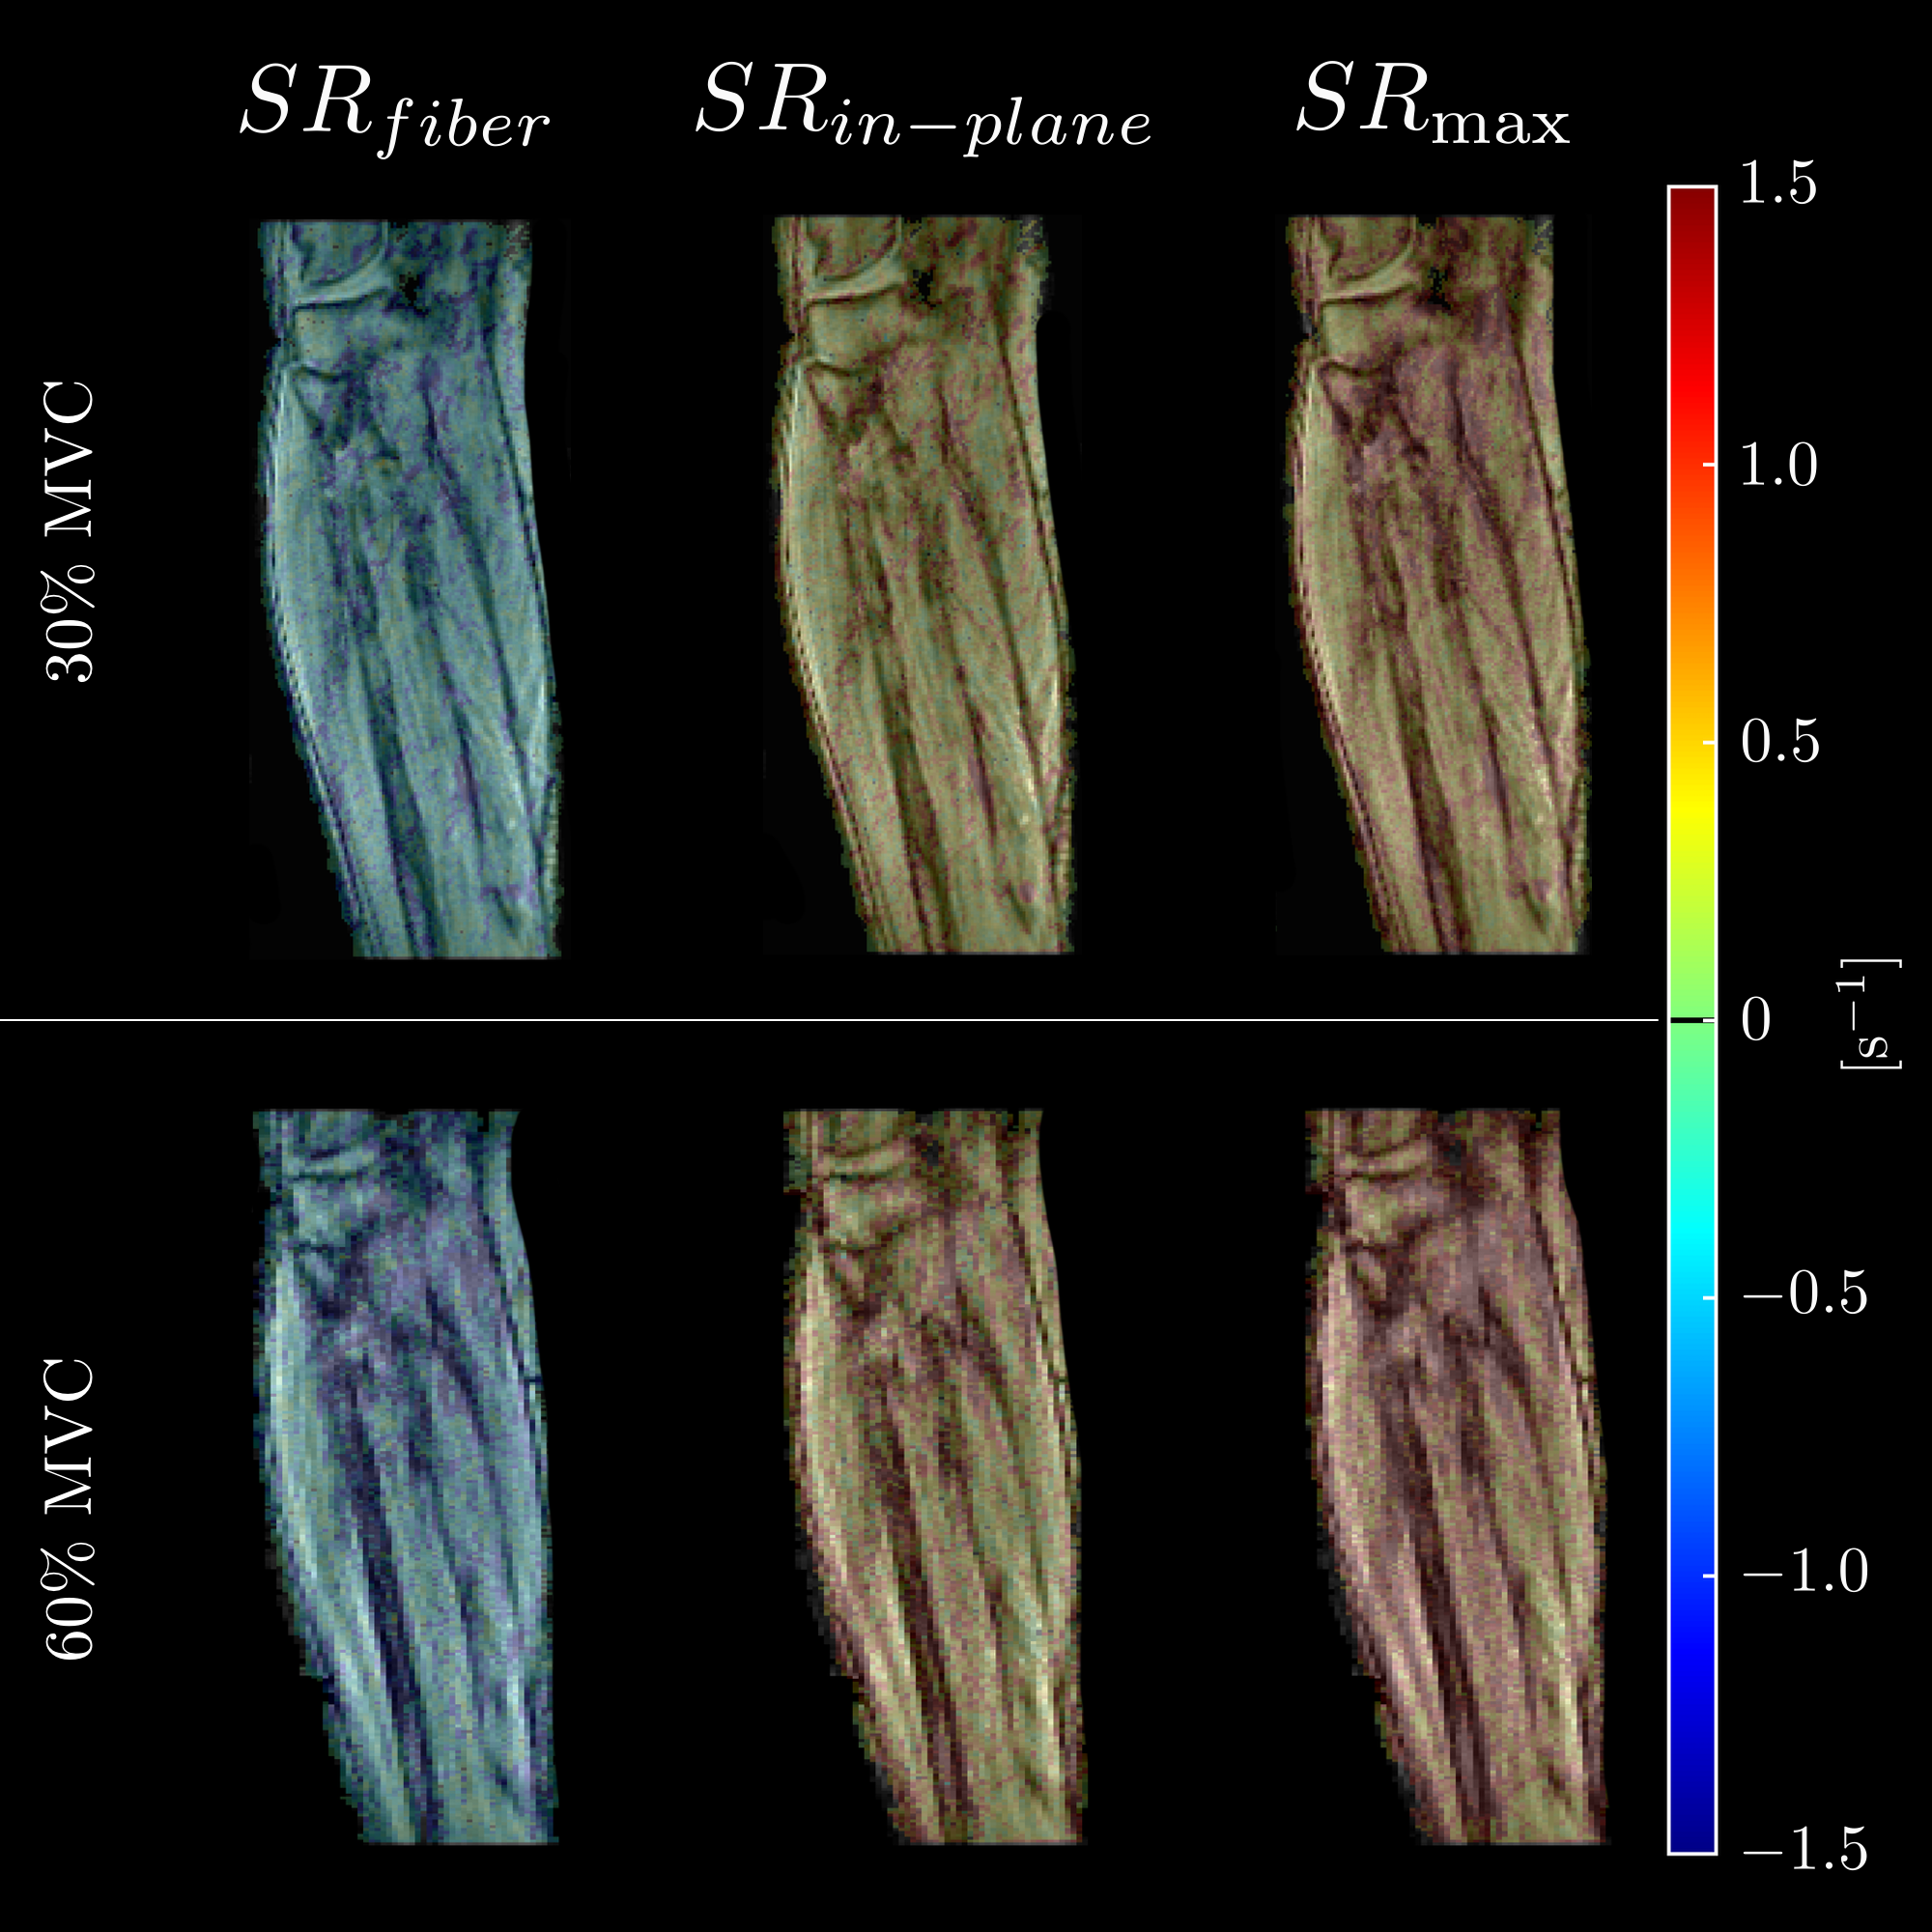
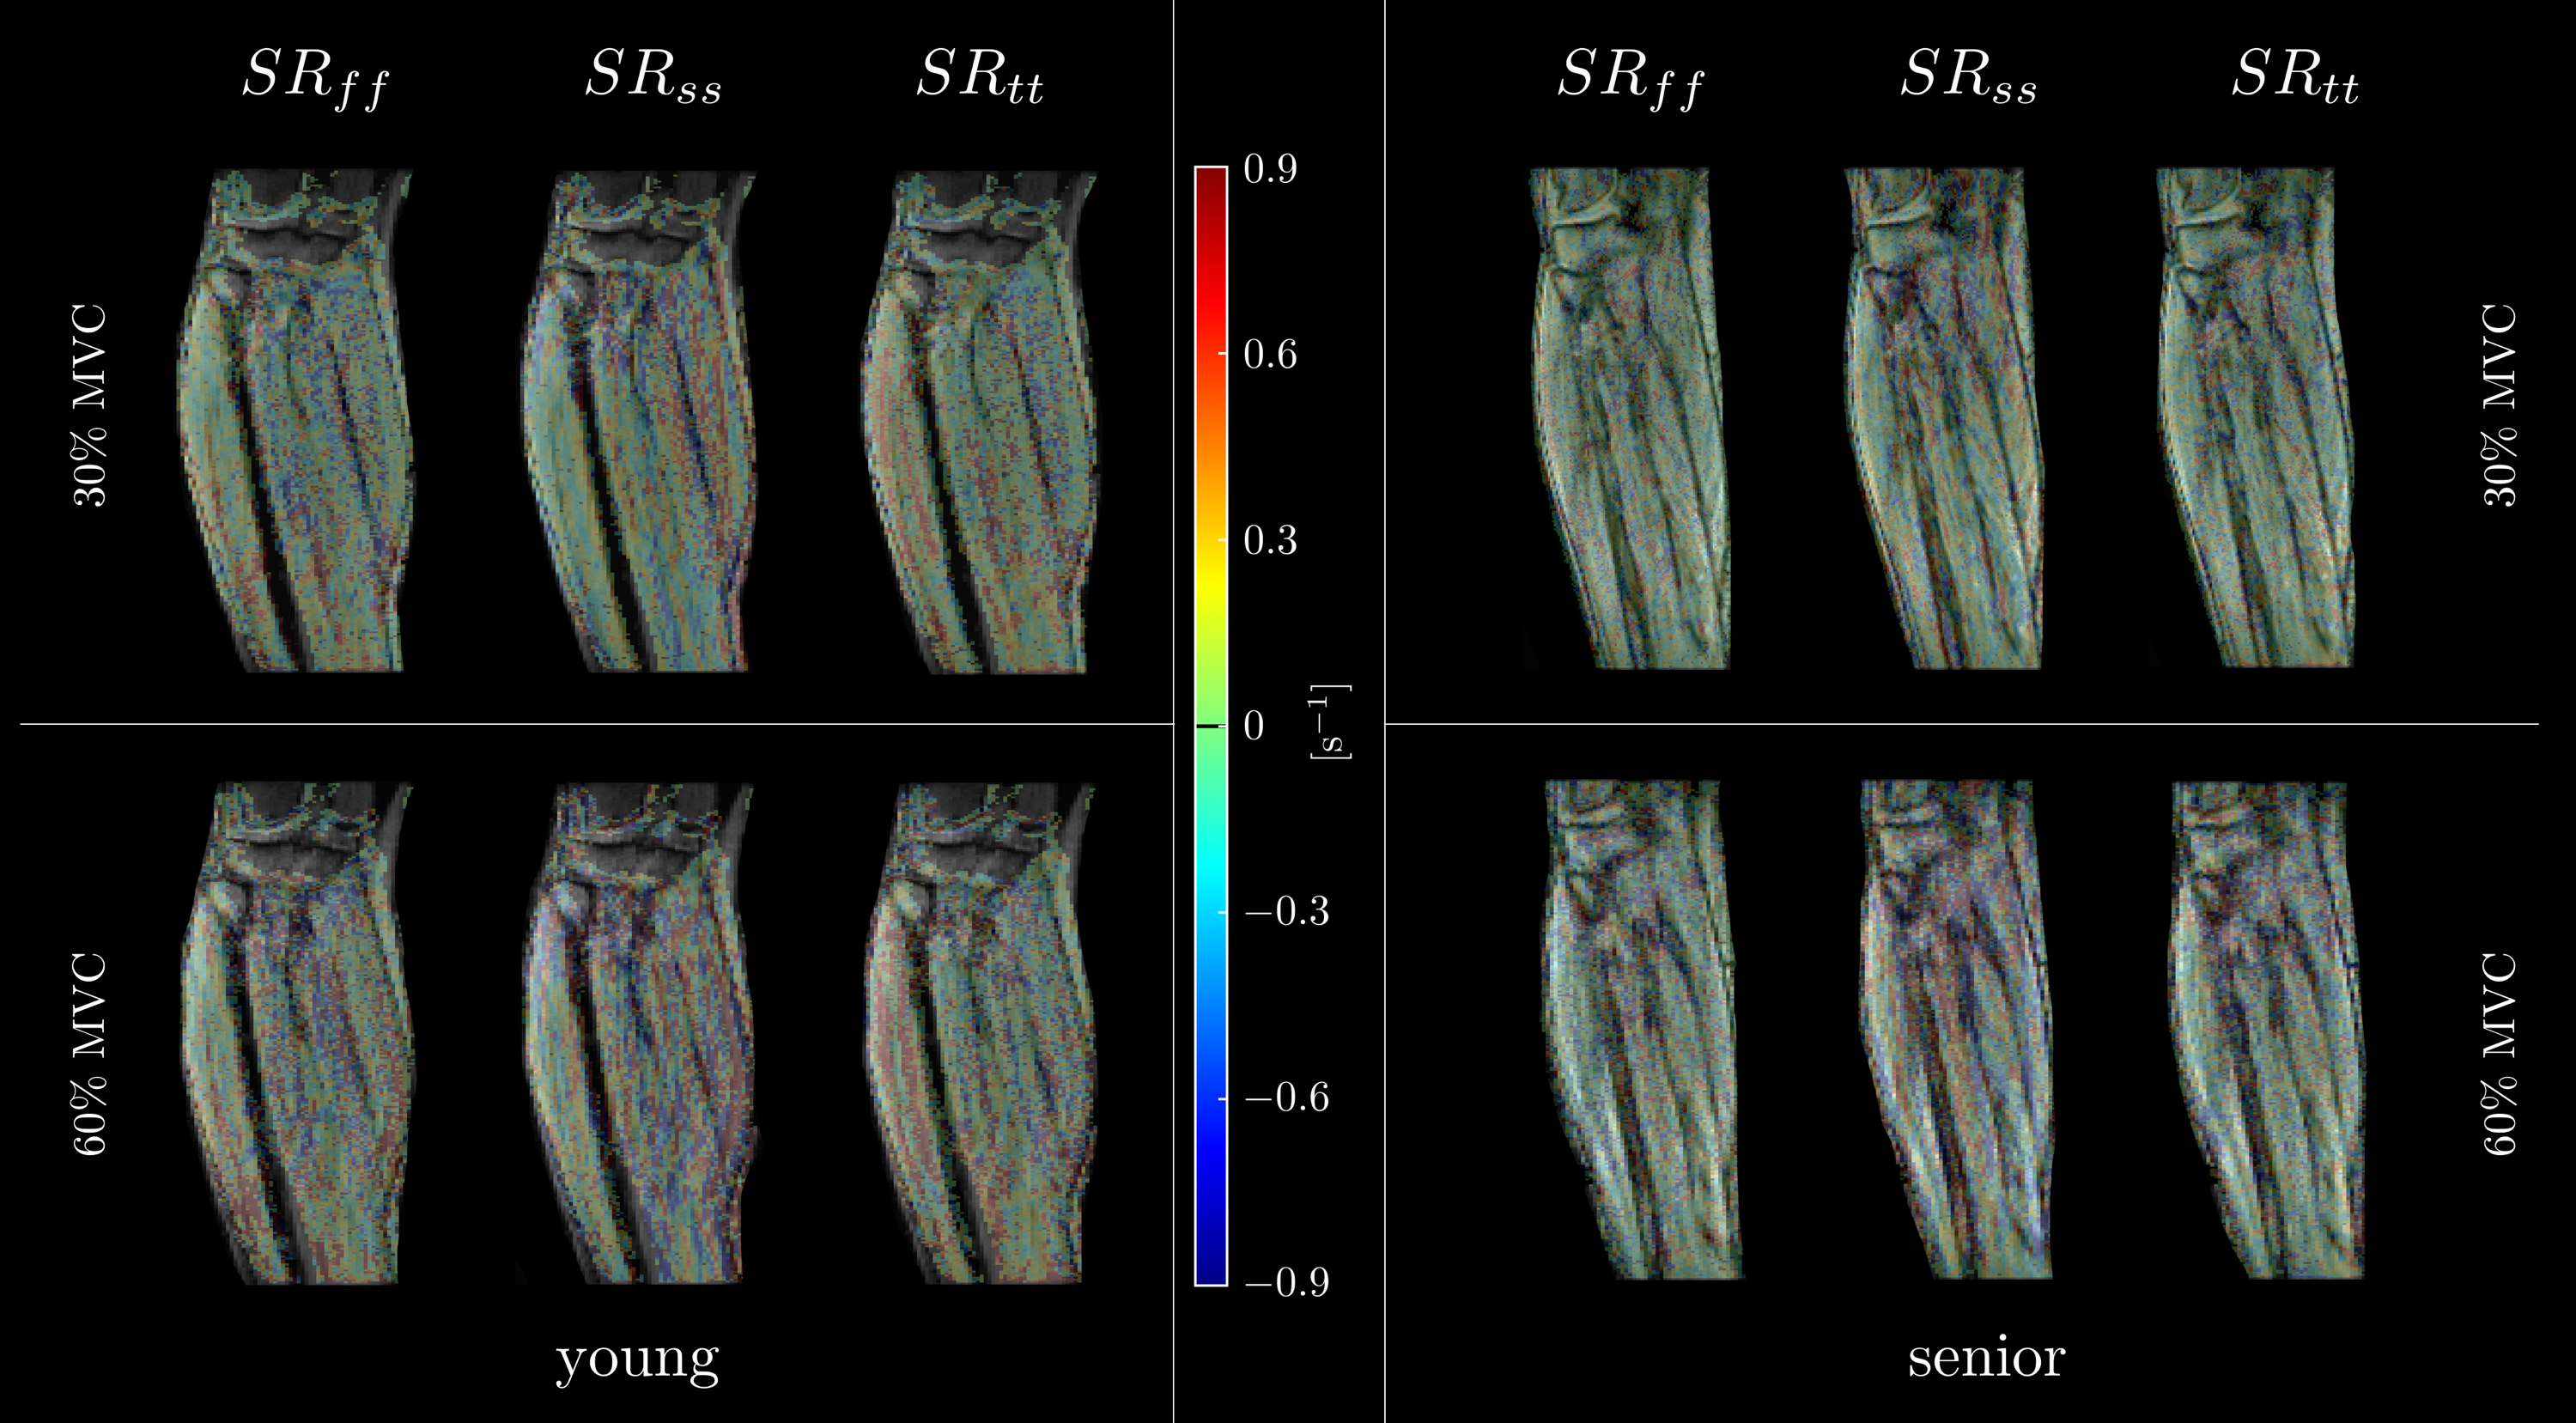
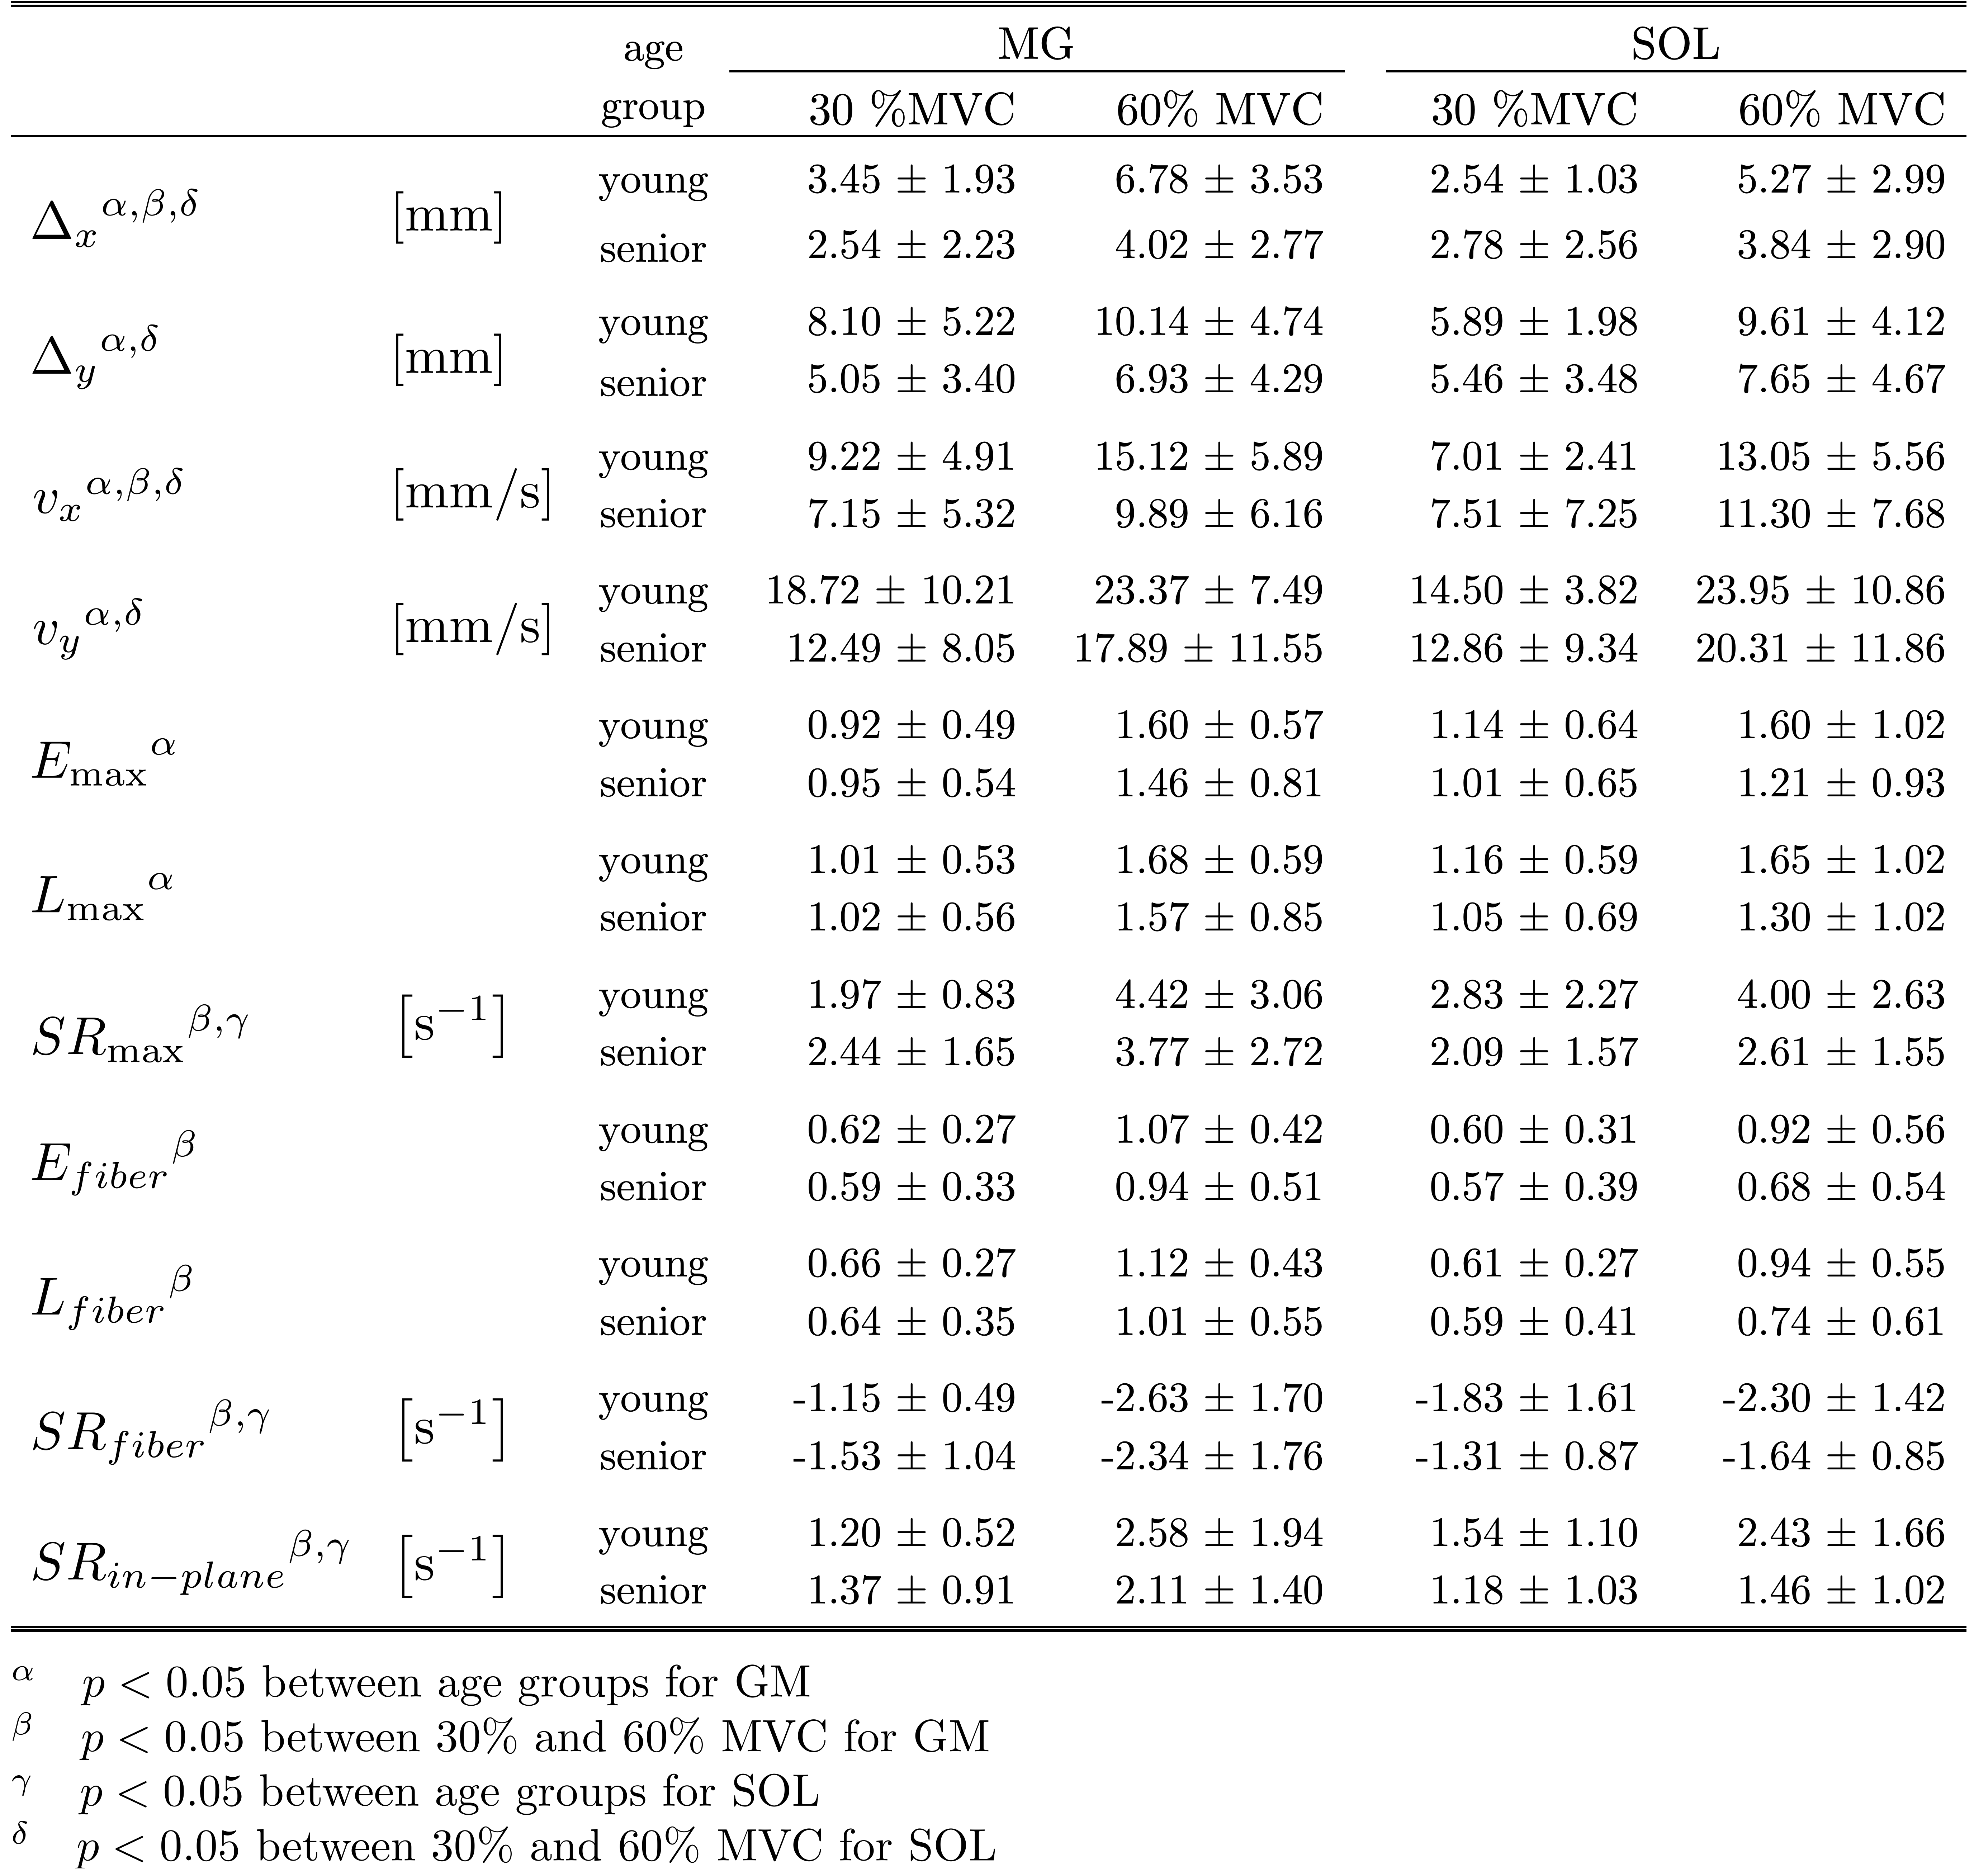
Figure 2 and 3 show the $$$SR_{fiber}, SR_{in-plane}$$$ and $$$SR_{\mathrm{max}}$$$ maps respectively at 30 and 60%MVC effort for one young and one senior subject; the maps correspond to the temporal frame at max $$$SR_{fiber}$$$ in the contraction cycle. The quality of the $$$\mathbf{SR}$$$ eigenvalue colormaps underlines the efficiency of the CS reconstruction. Increase in eigenvalues with the increase in level of MVC can be visually appreciated for subjects in both age groups. Figure 4 shows colormaps of the diagonal components of $$$\mathbf{SR}$$$ in the fiber frame of reference for young and senior subject at the peak of the contraction. Much smaller values of $$$\mathbf{SR}$$$ are seen in the fiber frame of reference and differences between young and senior are less than for components in principle frame. Table 1 lists only the strain and strain rate indices (ROIs placed in the Medial Gastrocnemius and Soleus) that were either significantly different between age groups and/or %MVC; no significant age*MVC effect was seen.Discussion:
Maximum shear strain rate $$$SR_{\mathrm{max}}$$$ (and shear strains), $$$SR_{fiber}$$$ and $$$SR_{in-plane}$$$ (and strains in-plane) were significantly lower with age and with %MVC (30 and 60%MVC). The source of the shear strain is hypothesized (based on computational models) to be the shear in the extracellular matrix; these models have also shown that shear strain is the mechanism of lateral transmission of force. The in-plane strain and $$$SR_{in-plane}$$$ reflect the deformation in the fiber cross-section and will change with the mechanical properties of the extracellular matrix (stiffer ECM will restrict the in-plane deformation).Conclusion:
Compressed sensing VE-PC enables dynamic acquisition of multi-slice / multiple levels of submaximal contraction in young and senior subjects. Significant differences with age seen in shear strains and in shear strain rates imply that the significant remodeling with age may occur in the extracellular matrix which could be a contributor to force loss.Acknowledgements
This work was supported by the National Institute of Arthritis and Musculoskeletal and Skin Diseases Grant R01AG056999-01References
[1] Malis V, et al. Magn Reson Med. 2017; 79(2): 912-922.
[2] Kim D, et al. Magn Reson Med. 2012; 67: 1054-1064.
[3] Sinha S, et al. J Magn Reson Imaging. 2012; 36(2): 498–504.
[4] Perona P, et al. IEEE Transactions. 1990; 12(7): 629–639.
Figures