0347
Repeated Muscle Contraction increases Creatine Kinase Reaction Rate and Shortens Phosphocreatine Recovery in Mouse Skeletal Muscle1Department of Biomedical Engineering, Case Western Reserve University, Cleveland, OH, United States, 2Electrical and Computer Engineering, University of Illinois at Urbana-Champaign, Urbana, IL, United States, 3Beckman Institute for Advanced Science and Technology, University of Illinois at Urbana-Champaign, Urbana, IL, United States, 4Case Center for Imaging Research, Case Western Reserve University, Cleveland, OH, United States
Synopsis
This study examined the effects of muscle contraction, induced by electrical stimulation, on creatine kinase (CK) reaction rate and the rate of phosphocreatine (PCr) recovery after its transient depletion in mouse skeletal muscle using phosphorous-31 (31P) magnetic resonance fingerprinting and dynamic 31P magnetic resonance spectroscopy. Our results showed that electrical stimulation induced a significant increase in CK reaction rate by ~14%, as well as an increased in PCr recovery rate by 26%, suggesting a positive preconditioning effect induced by electrical stimulation.
Introduction:
Daily physical activity remains an effective strategy to improve insulin sensitivity in type 2 diabetes [1]. However, individuals respond to exercise differently and our understanding of the determinants in response to exercise remains incomplete. It is widely recognized that exercise training is a highly potent stimulator of mitochondrial biogenesis leading to increased mitochondrial oxidative capacity. Indeed, molecular analyses of skeletal muscle biopsy specimens have also identified increased mRNA expression of mitochondrial markers and transcription factors in response to exercise training [2]. Metabolic adaptation to chronic training have also been evaluated in vivo using 31P magnetic resonance spectroscopy (31P-MRS) [3]. However, few studies have evaluated metabolic phenotypes in response to acute exercise.31P magnetic resonance spectroscopy (MRS) offers direct, in vivo quantification of high-energy phosphate metabolites such as adenosine triphosphate (ATP) and phosphocreatine (PCr), as well as inorganic phosphate (Pi) [4]. Monitoring the depletion and re-synthesis of PCr during an exercise-recovery protocol by dynamic 31P-MRS allows for the assessment of mitochondrial oxidative capacity in skeletal muscle. Further, the activity of creatine kinase (CK), an enzyme that catalyzes the exchange of a high-energy phosphate group between PCr and ATP, can be quantified using various magnetization-transfer (MT) techniques [5].
In this study, we evaluated the acute effects of muscle contraction on CK activity and PCr recovery kinetics in mouse hindlimb. A 31P magnetic resonance fingerprinting (MRF) method was developed for fast quantification of CK reaction rate constant. Our results show that electrical stimulation induced muscle contraction can significantly increase CK reaction rate constant, leading to fast PCr recovery after its depletion.
Methods:
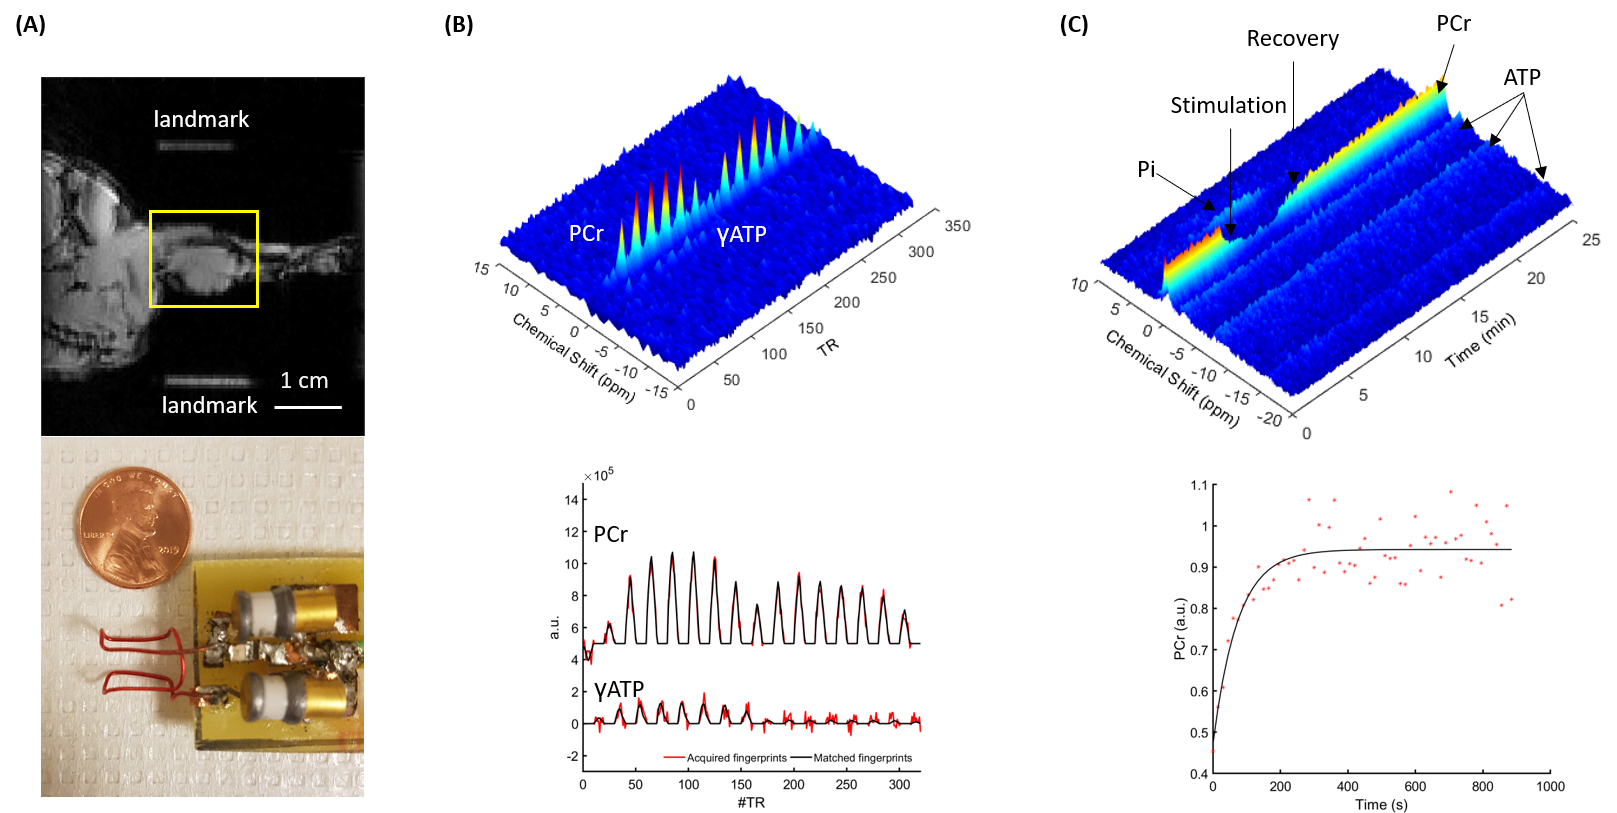
Experimental protocol: Animal studies were performed at 9.4T using custom-built 31P saddle coil. C57BL/6 mice (n=7) were anesthetized with isoflurane (1.5–2.5%) and placed in a cradle in lateral position. Two needle electrodes were placed subcutaneously over the third lumbar vertebrae and the greater trochanter, respectively. Muscle contraction was induced by applying square-wave pulses with a 2-V amplitude and 1-ms pulse duration at a rate of 3 Hz. For each mouse, two rounds of electrical stimulation (4 min each) were performed with a 30-min interval between the two rounds.CK-MRF: CK rate constant was quantified at baseline and after the two rounds of stimulation using a 31P-MRF method described previously [6]. 20 fingerprints were acquired and averaged for each measurement, corresponding to ~7 min acquisition time. The pseudo-first order forward CK reaction rate constant (kf,CK) was determined by matching the averaged fingerprints to a dictionary constructed using a MATLAB-based Bloch-McConnell simulator.
Dynamic 31P-MRS: For each round of stimulation, dynamic 31P-MRS data were acquired to quantify the rate of PCr recovery after its depletion induced by electrical stimulation. Acquisition used 30° excitation pulses with a TR of 500 ms. Each acquisition lasted for 25 min, covering the baseline (5 min), stimulation (4 min), and recovery (16 min) phases. The rate constant of PCr recovery was quantified using in-house developed, MATLAB-based software.
Results:
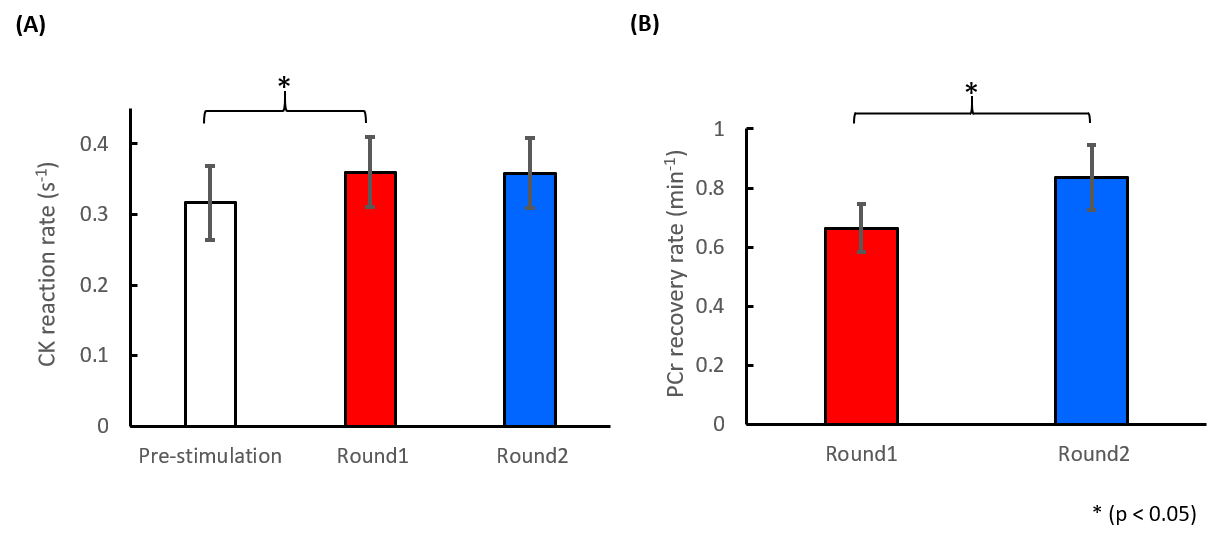
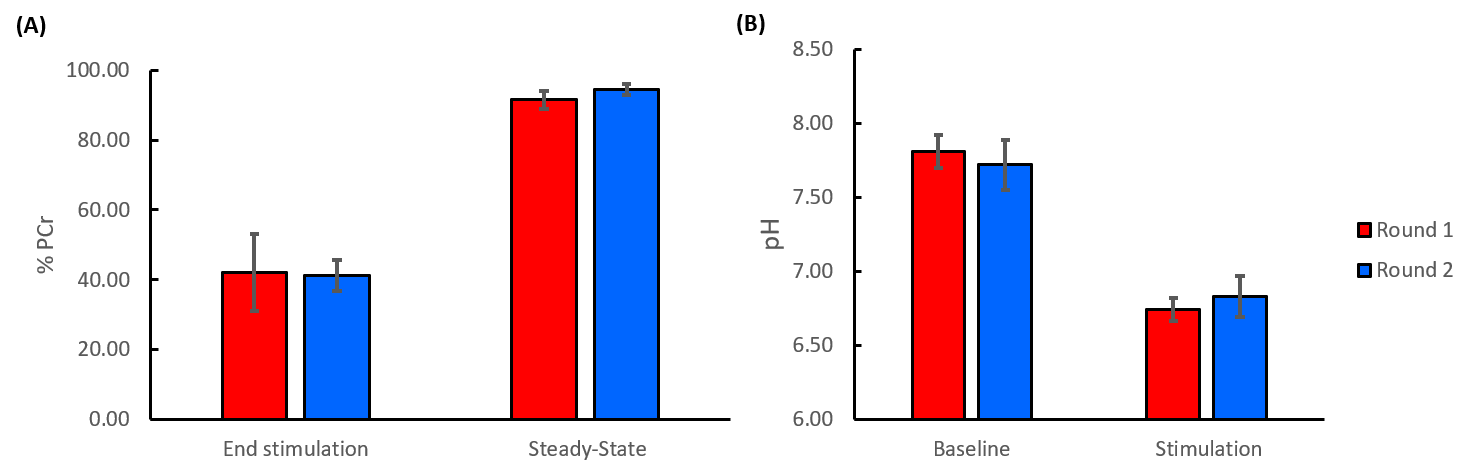
Figure 1 shows a representative 31P-MRF fingerprint and dynamic 31P spectra acquired from the entire mouse hindlimb. The average CK rate constant was 0.32±0.048 s-1 before stimulation, it increased significantly by ~14% (0.36±0.046 s-1) after the first round of stimulation (p<0.05), and remained at the same level (0.36±0.047 s-1) after the second round of stimulation (Fig. 2A). Consistent with this increase in CK rate constant, PCr recovery rate also increased significantly by 26%, from 0.66±0.081 min-1 after the first round to 0.84±0.11 min-1 after second round (p<0.05, Fig. 2B).Figure 3A shows baseline-normalized PCr levels at the end of stimulation and the steady-state phase of recovery. Both rounds of stimulation induced ~60% depletion of PCr (42.0±11.0% vs 41.4±4.40%). At steady-state, PCr levels recovered to 91.5±2.51% and 94.5±1.45% of the baseline level in round 1 and round 2, respectively. There were no statistical differences in % PCr depletion and recovery between the two rounds. Figure 3B shows baseline and end-stimulation tissue pH derived from the chemical shift of Pi. Baseline pH was 7.81±0.11 and 7.72±0.17 for the two rounds respectively. Both rounds of electrical stimulation induced significantly decreased pH. While end-stimulation pH in the second round was slightly higher (6.83±0.14 vs 6.74±0.08), there was no statistical significance between the two rounds.
Discussion and conclusion:
In this study we observed an increase in CK reaction rate and PCr recovery rate after electrical stimulation. These observations suggest a positive preconditioning effect on muscle metabolism by stimulation-induced muscle contraction. Methodologies established in this study may provide a valuable means for investigating the effect of both acute and chronic exercise on muscle metabolism in laboratory animal models.Acknowledgements
This work was supported by a grant from the National Institute of Health (R01 EB23704).References
[1] S. R. Colberg et al., “Exercise and type 2 diabetes: The American College of Sports Medicine and the American Diabetes Association: Joint position statement,” Diabetes Care, vol. 33, no. 12, 2010.
[2] M. E. Osler, T. Fritz, K. Caidahl, A. Krook, J. R. Zierath, and H. Wallberg-Henriksson, “Changes in gene expression in responders and nonresponders to a low-intensity walking intervention,” Diabetes Care, vol. 38, no. 6, pp. 1154–1160, 2015.
[3] K. Moll, A. Gussew, M. Nisser, S. Derlien, M. Krämer, and J. R. Reichenbach, “Comparison of metabolic adaptations between endurance- and sprint-trained athletes after an exhaustive exercise in two different calf muscles using a multi-slice 31 P-MR spectroscopic sequence,” NMR Biomed., vol. 31, no. 4, pp. 1–15, 2018.
[4] Y. Liu, Y. Gu, and X. Yu, “Assessing tissue metabolism by phosphorous-31 magnetic resonance spectroscopy and imaging: a methodology review,” Quant. Imaging Med. Surg., vol. 7, no. 6, pp. 707–716, Dec. 2017.
[5] C. Y. I. Wang and C. Y. Wang, “High Energy Phosphate Metabolism Measurement By Phosphorus-31 Magnetic Resonance,” 2018.
[6] C. Y. Wang, Y. Liu, S. Huang, M. A. Griswold, N. Seiberlich, and X. Yu, “31P magnetic resonance fingerprinting for rapid quantification of creatine kinase reaction rate in vivo,” NMR Biomed., vol. 30, no. 12, pp. 1–14, 2017.
Figures