0346
Non Invasive Imaging of Human Motor Units1Newcastle University, Newcastle upon Tyne, United Kingdom, 2Newcastle Biomedical Research Centre, Newcastle upon Tyne, United Kingdom, 3Regional Medical Physics, Newcastle upon Tyne, United Kingdom
Synopsis
Motor units are fundamental components in the process of contraction of skeletal muscle. Motor unit morphology changes in response to pathologies including motor neurone disease and sarcopenia. Currently the clinical method to investigate motor unit morphology and activity is invasive needle electromyography. Here we present a novel diffusion weighted imaging technique, motor unit MRI (MUMRI). MUMRI has been used to investigate the morphology of single human motor units, producing quantitative data on cross sectional area and dimensions of human motor units. This data agrees with current literature. MUMRI has detected statistically significant changes in the morphology of motor units.
Abstract
Introduction:A motor nerve connects with many separate muscle fibres allowing the brain to control muscle contraction. Collectively, these fibres and the innervating nerve are known as a motor unit (MU). The size of these MUs have been measured in animals using glycogen depletion experiments, and inferred in humans using invasive needle scanning electromyography1. MU size is of fundamental importance in muscle physiology since its size influences the resulting force that is generated. It is also of diagnostic importance since the size of MUs is altered in aging and many neuromuscular diseases. Recently, it has been shown that MU activation by electrical muscle stimulation, which results in muscle fibre contraction leads to signal voids on diffusion weighted (DW) images, a technique called MUMRI2. Here, we aim to estimate the size and shape of human MUs non-invasively using MUMRI.
Methods:
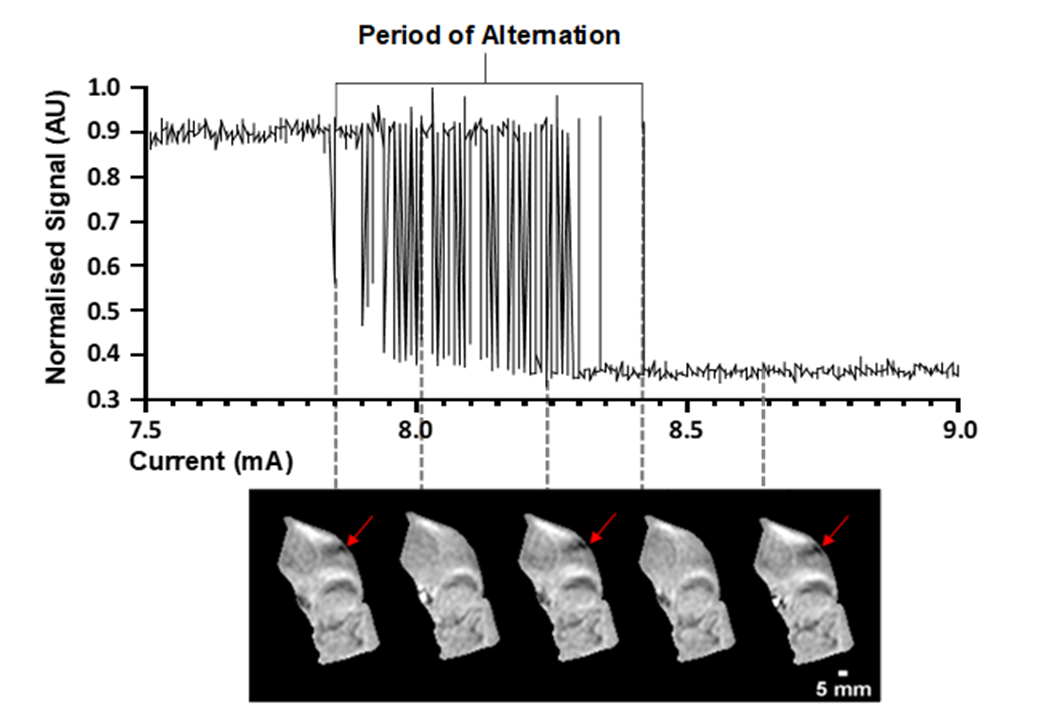
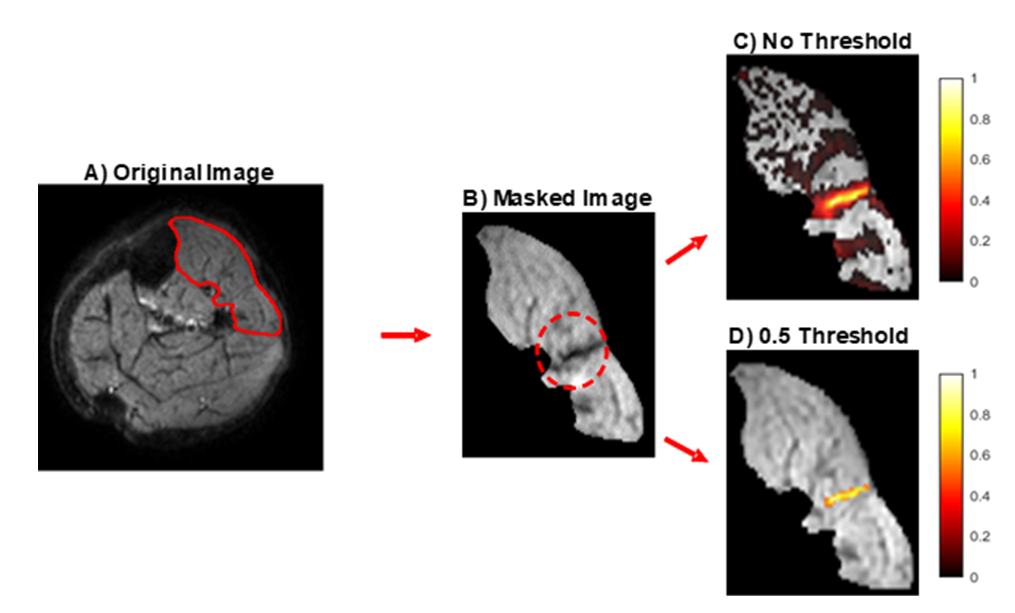
Leg muscles of ten healthy volunteers were scanned using a 3T Philips MR scanner with a pair of FlexM coils. The left peroneal or tibial nerve were electrically stimulated and DWI images were acquired time-locked to this electrical stimulation (SE-EPI, b = 20s/mm2, voxel size=1.5x1.5x7.5mm,TR/TE=1000/36ms, Δ/δ=18.5/4.5ms, sensitisation along muscle fibre axis). The stimulation protocol consisted of a ramp-down experiment starting at a current causing significant MU activity, and was then decreased in 0.01 mA steps until no signal voids were seen. At a certain current threshold a motor nerve will fire and the connected muscle fibres will contract in an all or nothing manner. However, as the current strength approaches this threshold, the particular nerve will fire on some occasions, but on others. This is known as MU alternation and this behaviour can be used as a criteria to identify MU from the images (Fig.1). Using this principle, MU activity maps were created by taking the difference between images where the MU was firing (presence of a signal void), and the MU was not firing (no signal void). Maps were normalised to the maximal signal intensity and all voxels with a signal intensity smaller than 0.5 were removed (Fig.2). Cross sectional area (CSA) and Feret diameters of the remaining region reflecting the MU were then determined.
Results:
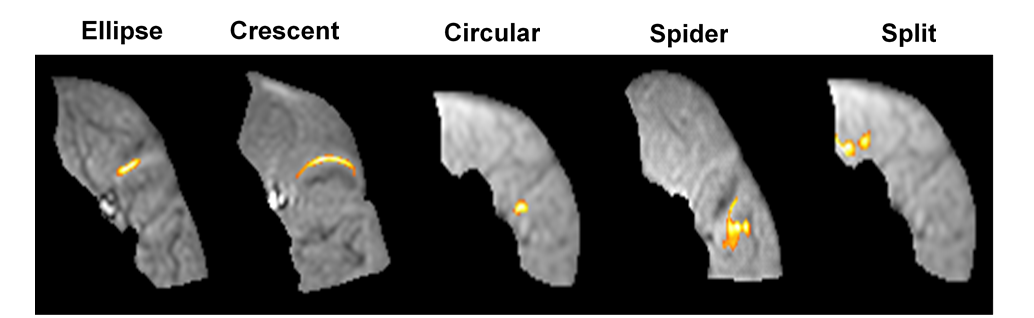
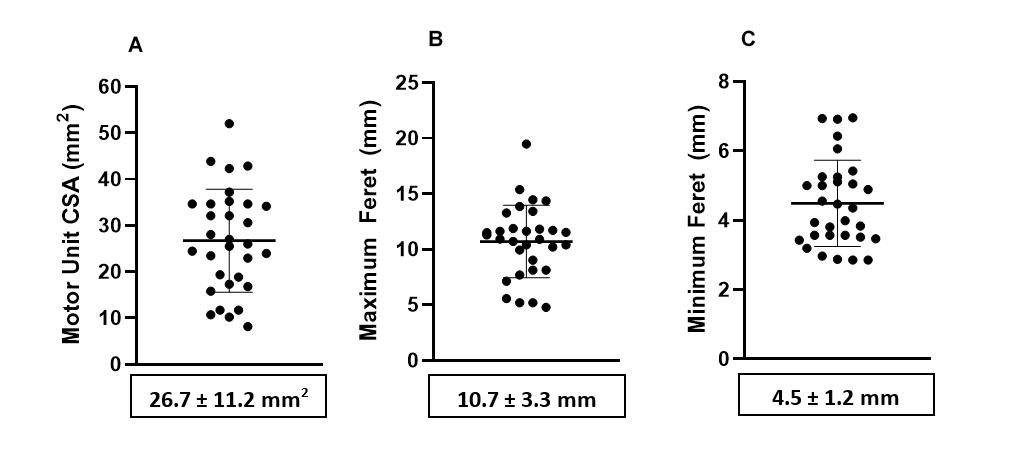
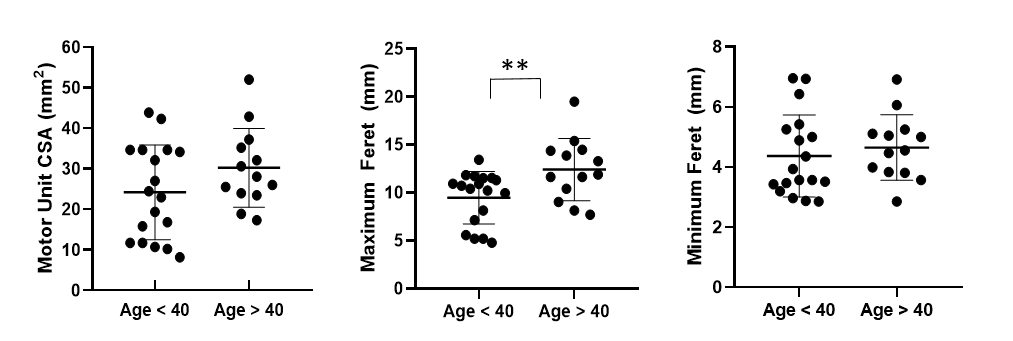
We analysed 31 MUs from 6 different types of muscles, classifying them into five shape groups: elliptical, crescent, circular, spider and split (into two or more parts) (Fig. 3). Observed MUs were most commonly elliptical in shape, notably we observed two split motor units, areas of activity interspersed with areas of low activity. The average MU area was 26.7±11.2 mm2, average maximum and minimal Feret diameters were 10.7±3.3 mm & 4.5 ± 1.2 mm respectively (fig. 4). Dividing volunteers into two different age groups > 40 yrs. and < 40 yrs. and comparing these metrics demonstrated a statistically significant difference in the maximum Feret diameter for volunteers > 40 yrs. (p = 0.011) (fig. 5).
Discussion:
The majority of motor units were elliptical in shape and this agrees with data on motor unit outlines from glycogen depletion experiments2. Silent zones are areas of low activity within a motor unit territory when performing scanning EMG. The two split motor units observed, further supports existence of silent zones and is evidence that human motor units may have more complex anatomy than those in lower animals. In our group of healthy controls the maximum and minimum motor unit dimensions agreed with current literature from scanning electromyography (3 – 10 mm)3. However, in contrast to scanning EMG, up to 8 motor units can be detected simultaneously using MUMRI, the technique is entirely non-invasive, and rather than revealing activity from a single corridor produces a 2D image of the entire motor unit cross-section. It is known that as individuals’ age there is a loss of motor units4, with a compensatory attempt to re-innervate from surviving motor units, leading to an increase in their size. We have observed an age related increase in the maximum Feret diameter of motor units demonstrating that motor units undergo heterogeneous remodelling with age.
Conclusion:
Motor unit MRI (MUMRI) is a novel technique capable of revealing the size, shape and position of multiple motor units in human muscles. It is reproducible, non-invasive, and sufficiently sensitive to detect physiologically relevant changes in motor unit morphology with age. To our knowledge, these results provide the first direct measurement of human motor unit morphology. The technique shows promise both as a diagnostic tool and as a biomarker in longitudinal studies of disease progression.
Acknowledgements
The authors would like to thank the following:
Funders - Medical Research Council - Confidence in Concept Award, Newcastle Biomedical Research Centre.
Research radiographers who scanned the participants.
All the participants in the study.
References
1Guéritaud JP, Horcholle-Bossavit G, Jami L, et al. Resistance to glycogen depletion of motor units in the cat rectus lateralis muscle. 1985; 60(3); 542-50. 10.1007/bf00236940.
2 Whittaker R, Porcari P, Braz L, et al. Functional magnetic resonance imaging of human motor unit fasciculation in amyotrophic lateral sclerosis. Annals of Neurology. 2019; 85: 455-9. https://doi.org/10.1002/ana.25422.
3Stålberg E, Dioszeghy P. Scanning EMG in normal muscle and in neuromuscular disorders. Electroencephalography and Clinical Neurophysiology. 1991; 81(6); 403-16. 10.1016/0013-4694(91)90001-k.
4Piasecki M, Ireland A, Jones D, McPhee J. Age-dependent motor unit remodelling in human limb muscles. Biogerontology. 2016; 17; 485-96. 10.1007/s10522-015-9627-3.
Figures