0345
The effect of intramuscular fat on the large strain mechanical properties of skeletal muscle as measured by anisotropic MRE1Neuroscience Research Australia, Randwick, Australia, 2University of New South Wales, Kensington, Australia, 3University of Melbourne, Parkville, Australia
Synopsis
Intramuscular fat (IMF) increases with BMI and age, but it is unknown how it affects skeletal muscle viscoelastic properties, despite the key role skeletal muscle mechanical properties play in our capacity to move. We studied the effects of IMF on the anisotropic mechanical properties under large deformation of the calf muscles in healthy and obese participants, using an advanced approach incorporating diffusion tensor imaging data into magnetic resonance elastography reconstructions. Results show that intramuscular fat had no significant effect on muscle shear moduli, but stretching or shortening muscle altered the parallel and/or perpendicular stiffness and viscosity of some muscles.
Introduction
Intramuscular fat (IMF) is a form of ectopic adipose tissue which has been shown to increase with BMI1 and age2. With an increasingly overweight and ageing population, it is important to understand the effects that this under-researched tissue is having on our bodies. A number of studies have investigated the metabolic properties of IMF3, but no experimental studies have investigated the effect of IMF on the mechanics of skeletal muscles. This is significant as the mechanical properties of skeletal muscle govern our capacity to ambulate, interact with the world and move, affecting all aspects of our daily lives.Most previous studies investigating the mechanical properties of soft tissues have only captured small deformation effects, and assume mechanical isotropy, where skeletal muscle is distinctly anisotropic and regularly undergoes very large deformations. Recent studies have developed methods for reconstructing the anisotropic mechanical properties of soft tissues4 and for the determination of large deformation effects on soft tissue5, but no studies have sought to combine these methods.
The aim of this study is to determine the effect of intramuscular fat and of large deformations on the anisotropic viscoelastic properties of skeletal muscle in vivo using newly developed methods to combine magnetic resonance elastography (MRE) and diffusion tensor imaging (DTI). The hypothesis of the study is that large deformation muscle anisotropic properties will vary with muscle fat content.
Methods
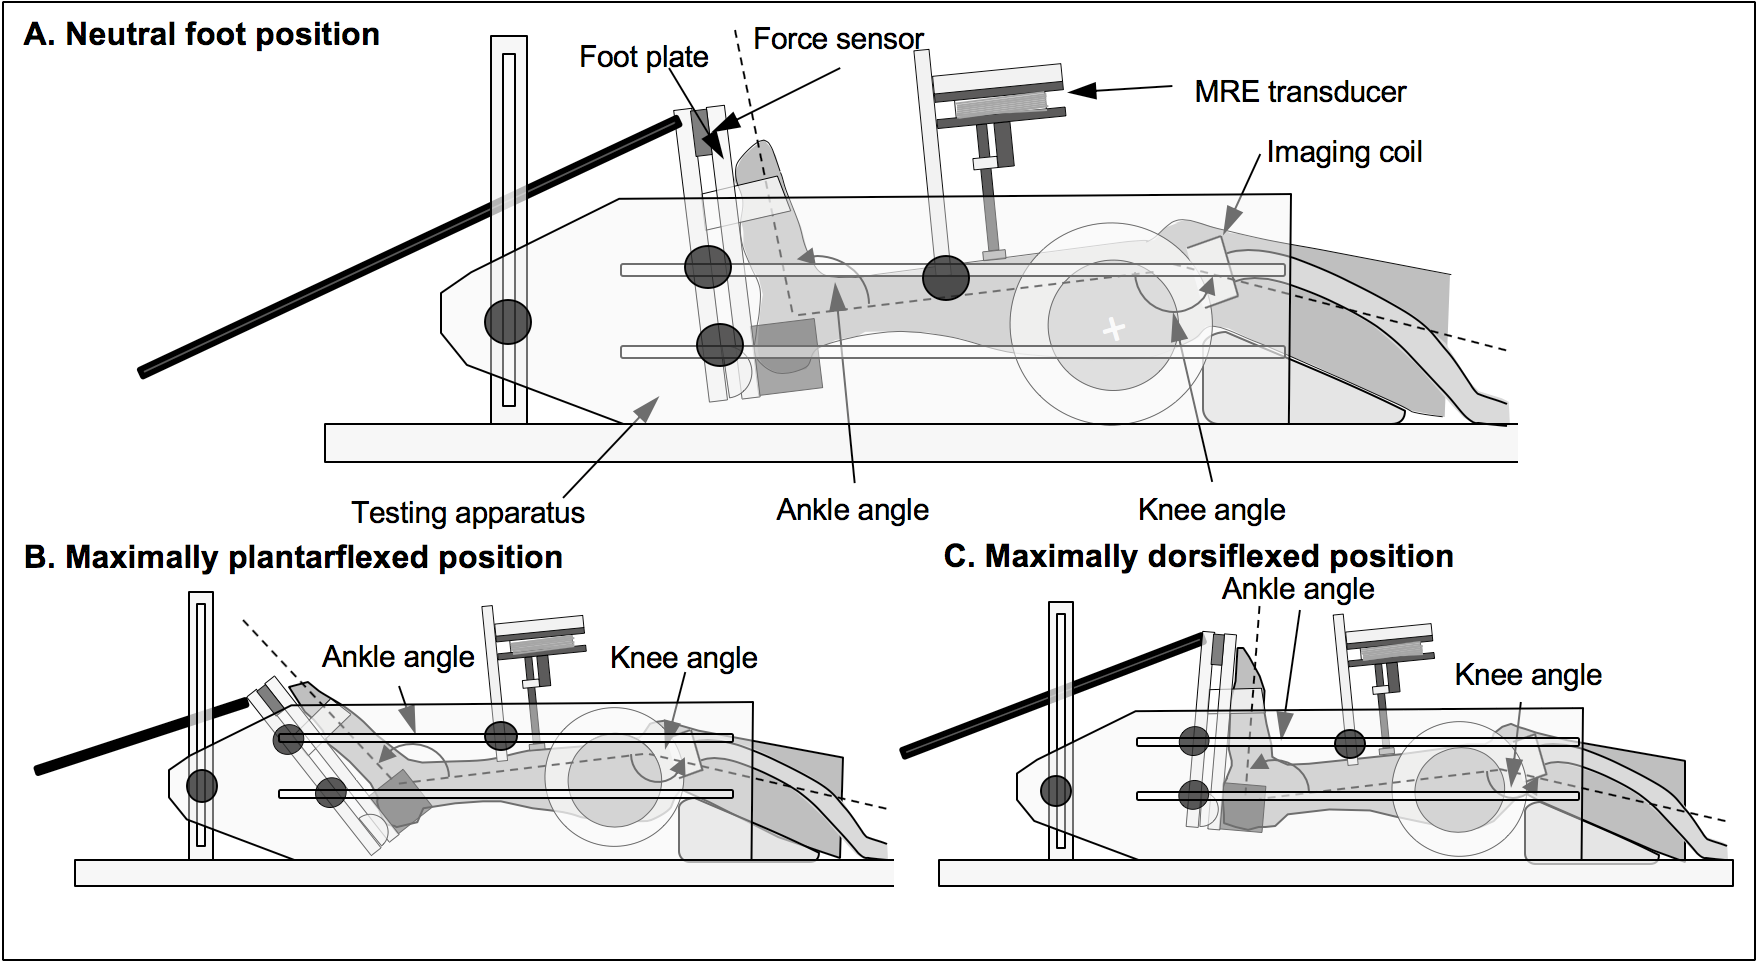
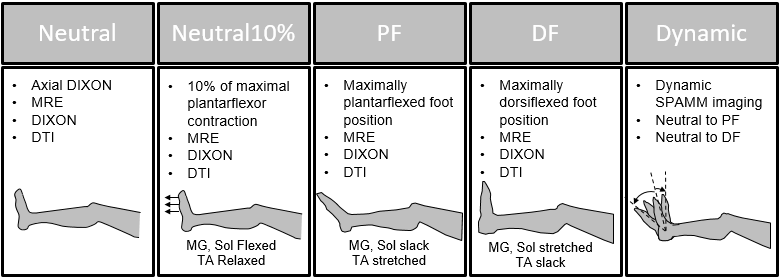
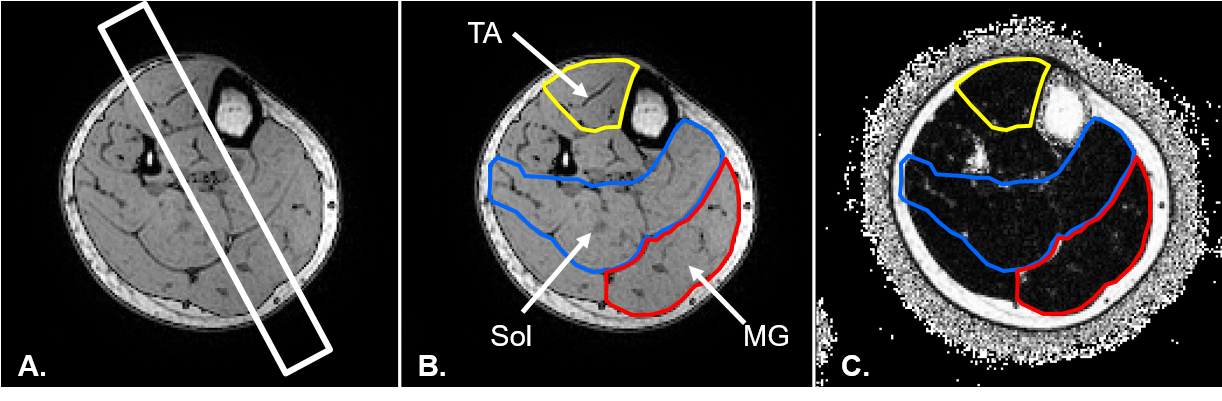
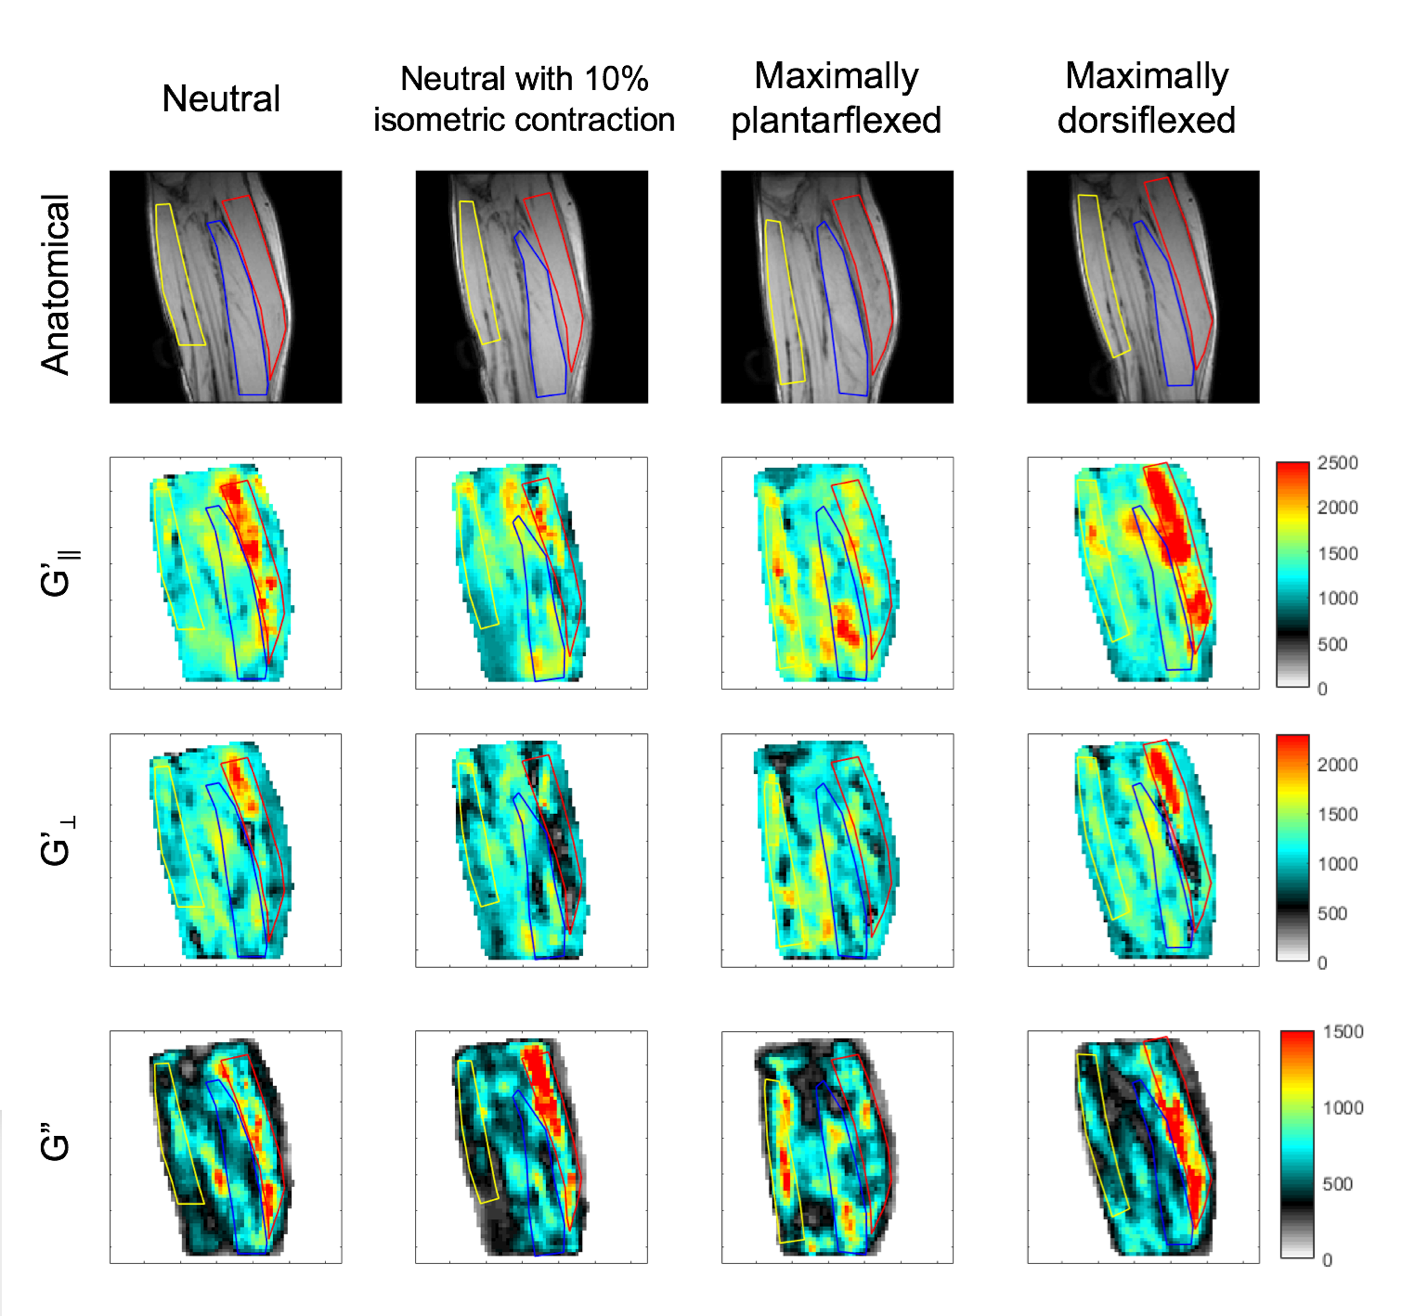
Ten obese participants ( BMI >30kg/m2, 5 women) with a sedentary lifestyle, and 10 control subjects matched individually for age and gender with a normal BMI (<25kg/m2) and active lifestyle were scanned on a 3T MRI (Philips Achieva 3TX). Images were collected in a plane obliquely through the right calf in three ankle positions (neutral, maximally dorsiflexed, maximally plantarflexed) and in the neutral position during an isometric plantarflexion contraction of 10% of maximum, to investigate the large deformation mechanical behaviour of the the Medial Gastrocnemius (MG), Soleus (Sol) and Tibialis Anterior (TA) (Figures 1 and 2). In each condition, oblique-sagittal Magnetic Resonance Elastography (MRE), Diffusion Tensor Imaging (DTI) and two-point gradient echo mDixon were collected. Imaging parameters used were: MRE : 50Hz excitation applied to the Tibia, TR/TE = 182.5/9.21ms, voxel size 3x3x3mm, FOV 192x192mm2, nine slices, flip angle 30°. DTI: Single-shot EPI sequence, 33 gradient direction, b factor = 500s/mm2 and TR/TE = 360ms/51.48ms with matching field of view (FOV) and voxel size as the MRE scans. mDixon: TR/TE = 4.152/2.37 ms, flip angle = 5°, resolution = 128x128mm and 3mm slice thickness. An axial mDixon scan of the whole calf was collected to determine the fat fraction of each muscle (MG, Sol, TA) (Figure 3). Out-of-phase mDixon images were used to define regions of interest for the MG, Sol and TA stiffness maps (Figure 4A). The first eigenvector of the diffusion tensor from DTI scans was combined with isotropic viscoelastic properties derived from MRE in a previously described process4 to determine the transversely isotropic stiffness (G'∥,G’⊥) and the isotropic viscosity of each voxel (G"). Repeated measured two-way ANOVAs were used to investigate change in mechanical properties with strain for each muscle.Results
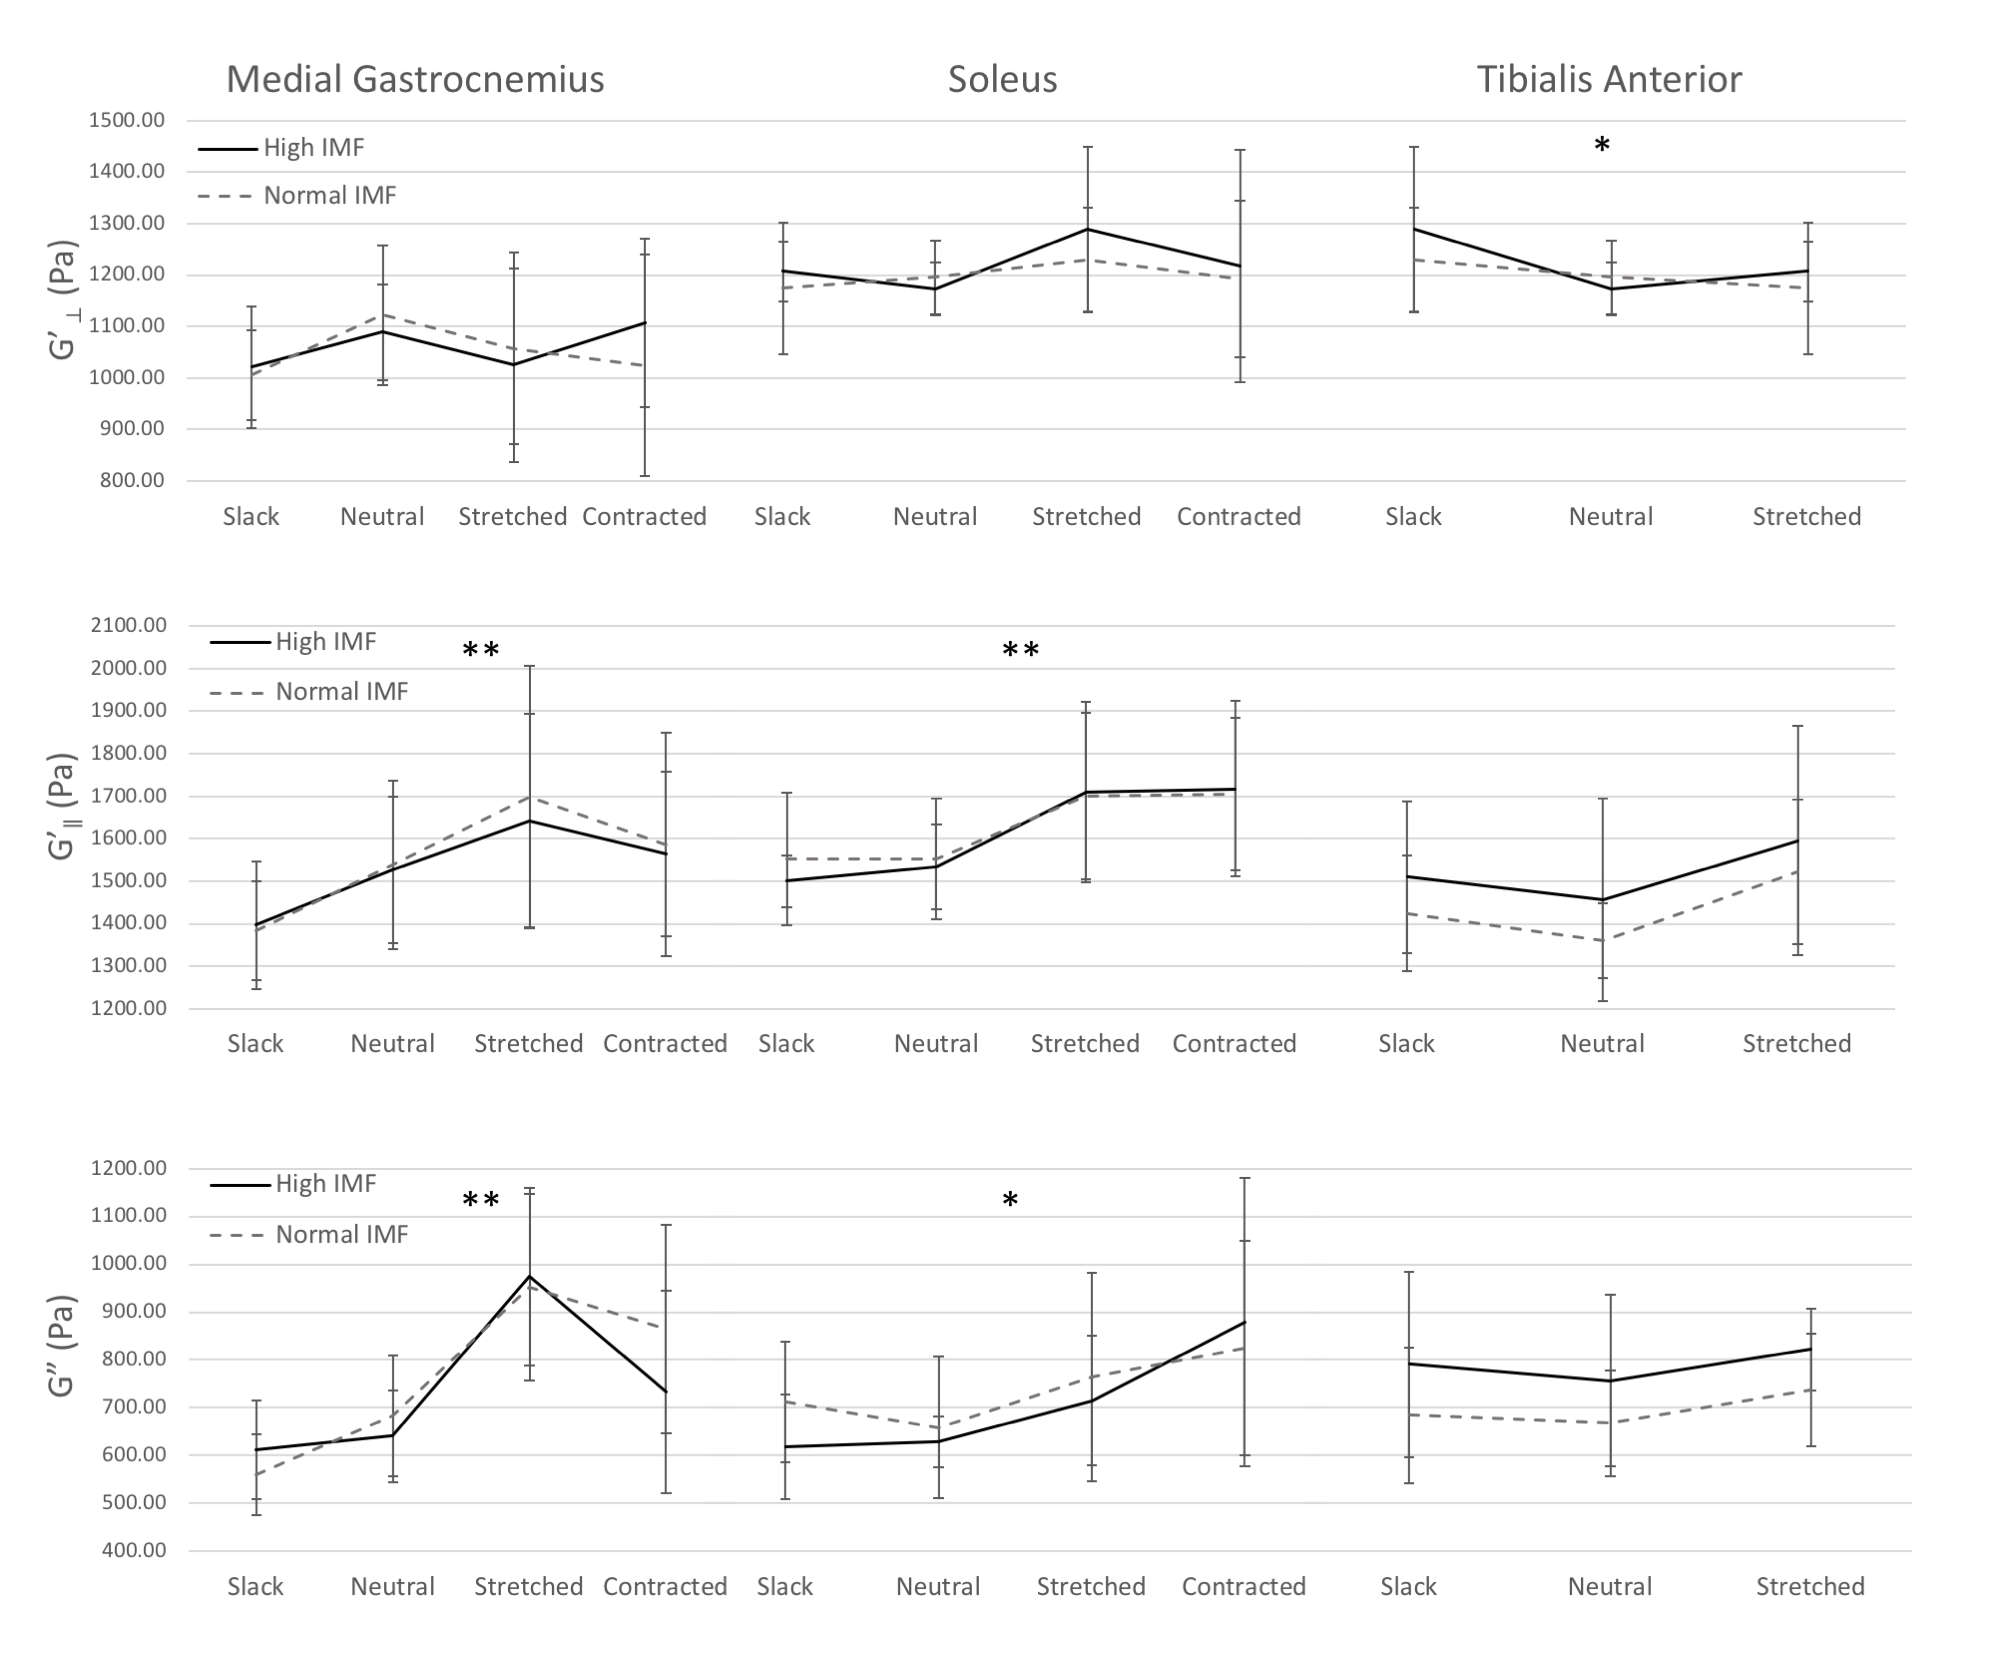
Muscle shear moduli varied significantly with deformation. Specifically, muscle stretch resulted in significant increases in storage and loss moduli both parallel and perpendicular to the muscle fibre direction, although the effects varied between muscles (Figures 4 and 5) (MG G'∥ & G" p<0.005; Sol G'∥ p<0.005, G" p=0.046; TA G’⊥ p=0.018). No statistically significant interaction was found between the effects of IMF group (normal mean ~6%, high mean ~9%) and muscle strain (slack, neutral or stretched) or contraction (neutral or 10% plantarflexion) on muscle shear moduli.Conclusion
Muscle deformation, especially stretch, has a substantial effect on the apparent stiffness of the muscle as measured by anisotropic MRE, while intramuscular fat appears to have minimal effect on stiffness. Specifically, when under tension, whether from flexion or passive stretching, skeletal muscles become significantly more stiff parallel to the muscle fibre’s axis, and this increase is greater than that observed in the direction perpendicular to the muscle fibres. This suggests that skeletal muscle becomes more anisotropic under tension.Acknowledgements
The authors of this study would like to thank the staff at the i-Med Imaging facility at NeuRA, in particular radiographers Mardi Salvestrin and Adrian Hudson. We would also like to thank Dave Menardo and Artemij Iberzanov in the NeuRA workshop for their assistance with building the equipment used in this study, and Bart Bolsterlee for his input into the analysis of DTI data.References
1. T. N. Hilton, L. J. Tuttle, K. L. Bohnert, et al. Excessive Adipose Tissue Infiltration in Skeletal Muscle in Individuals With Obesity, Diabetes Mellitus, and Peripheral Neuropathy: Association With Performance and Function. Physical Therapy, vol. 88, no. 11, pp. 1336-1344, 2008.
2. R. L. Marcus, O. Addison, J. P. Kidde, et al. Skeletal Muscle Fat Infiltration: Impact of Age, Inactivity, and Exercise. The Journal of Nutrition, Health & Aging, vol. 14, no. 5, pp. 362-366, 2010.
3. O. Addison, R. L. Marcus, P. C. LaStayo, et al. Intermuscular Fat: A Review of the Consequences and Causes. International Journal of Endocrinology, vol. 2014, p. 11, 2014, Art. no. 309570.
4. E. C. Qin, et al. Combining MR elastography and diffusion tensor imaging for the assessment of anisotropic mechanical properties: A phantom study. Journal of Magnetic Resonance Imaging, vol. 37, no. 1, pp. 217-226, 2013.
5. K. Tan, L. Jugé, A. Hatt, et al. Measurement of large strain properties in calf muscles in vivo using magnetic resonance elastography and spatial modulation of magnetization. NMR in Biomedicine, 31:e3925, 2018.
Figures