0344
Quantitative MRI of skeletal muscle in a cross-sectional cohort of spinal muscular atrophy type 2 and type 31Neurology, UMC Utrecht Brain Center, University Medical Center, Utrecht, Utrecht, Netherlands, 2Neurology, BG-University Hospital Bergmannsheil, Ruhr-University Bochum, Bochum, Germany, 3Neurology and Child Neurology, UMC Utrecht Brain Center, University Medical Center, Utrecht, Utrecht, Netherlands, 4Biostatistics & Research Support, Julius Center for Health Sciences and Primary Care, University Medical Center Utrecht, Utrecht, Netherlands, 5Child Development and Exercise Center, UMC Utrecht Brain Center, University Medical Center, Utrecht, Utrecht, Netherlands, 6Radiology, UMC Utrecht Brain Center, University Medical Center, Utrecht, Utrecht, Netherlands
Synopsis
qMRI of skeletal muscle has shown promising results in other neuromuscular diseases, but multi-parametric imaging has not been executed in Spinal Muscular Atrophy. We investigated a cohort of 31 patients and 20 controls with protocol consisting of DIXON, T2 mapping and DTI on a 3T MR scanner. All parameters differed significantly between patients and controls. DTI elucidates distinct properties of the muscle, suggesting atrophy by a lowered MD and increased FA. DTI shows correlation with muscle strength and motor function. This suggests the potential of diffusion tensor imaging of muscle in monitoring disease progression in SMA.
Background
Hereditary proximal Spinal Muscular Atrophy (SMA) is caused by Survival Motor Neuron (SMN) protein deficiency due to homozygous loss of function of the SMN1 gene.1 Treatment strategies have been developed to skew splicing of the remaining, paralogous SMN2 gene towards full length SMN protein, which is critical to alpha-motor neurons. In the absence of therapy, SMA exhibits a slowly progressive decline in muscle strength and motor function in later-onset patients.2 Outcome measures that can appreciate treatment effects of existing and future therapies are still warranted. Quantitative MRI (qMRI) of muscle has shown promising results in other neuromuscular disorders, such as Duchenne muscular dystrophy (DMD), limb girdle muscular dystrophies (LGMD), glycogen storage disorders, i.e. McArdle’s and Pompe’s disease.3–6 Data on various qMRI measures of skeletal muscle in a large cohort of SMA patients encompassing a broad range of disease severity and disease duration are still lacking.Methods
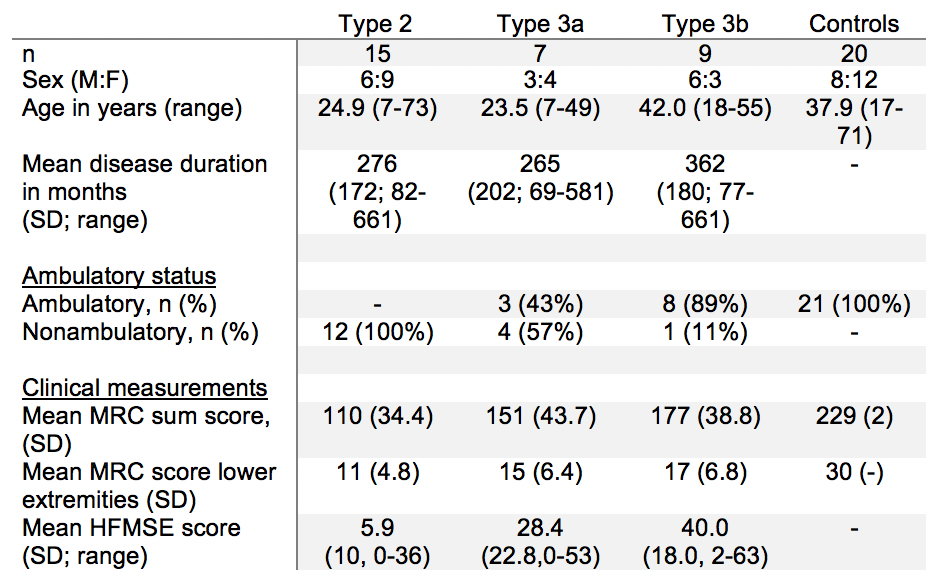
We included 20 control subjects and 31 patients with SMA type 2 (classification when highest acquired motor milestone was independent sitting) and type 3 (highest acquired motor milestone was walking independently, with symptom onset before 3 years – 3a or after – 3b), demographics are presented in figure 1.MR acquisition
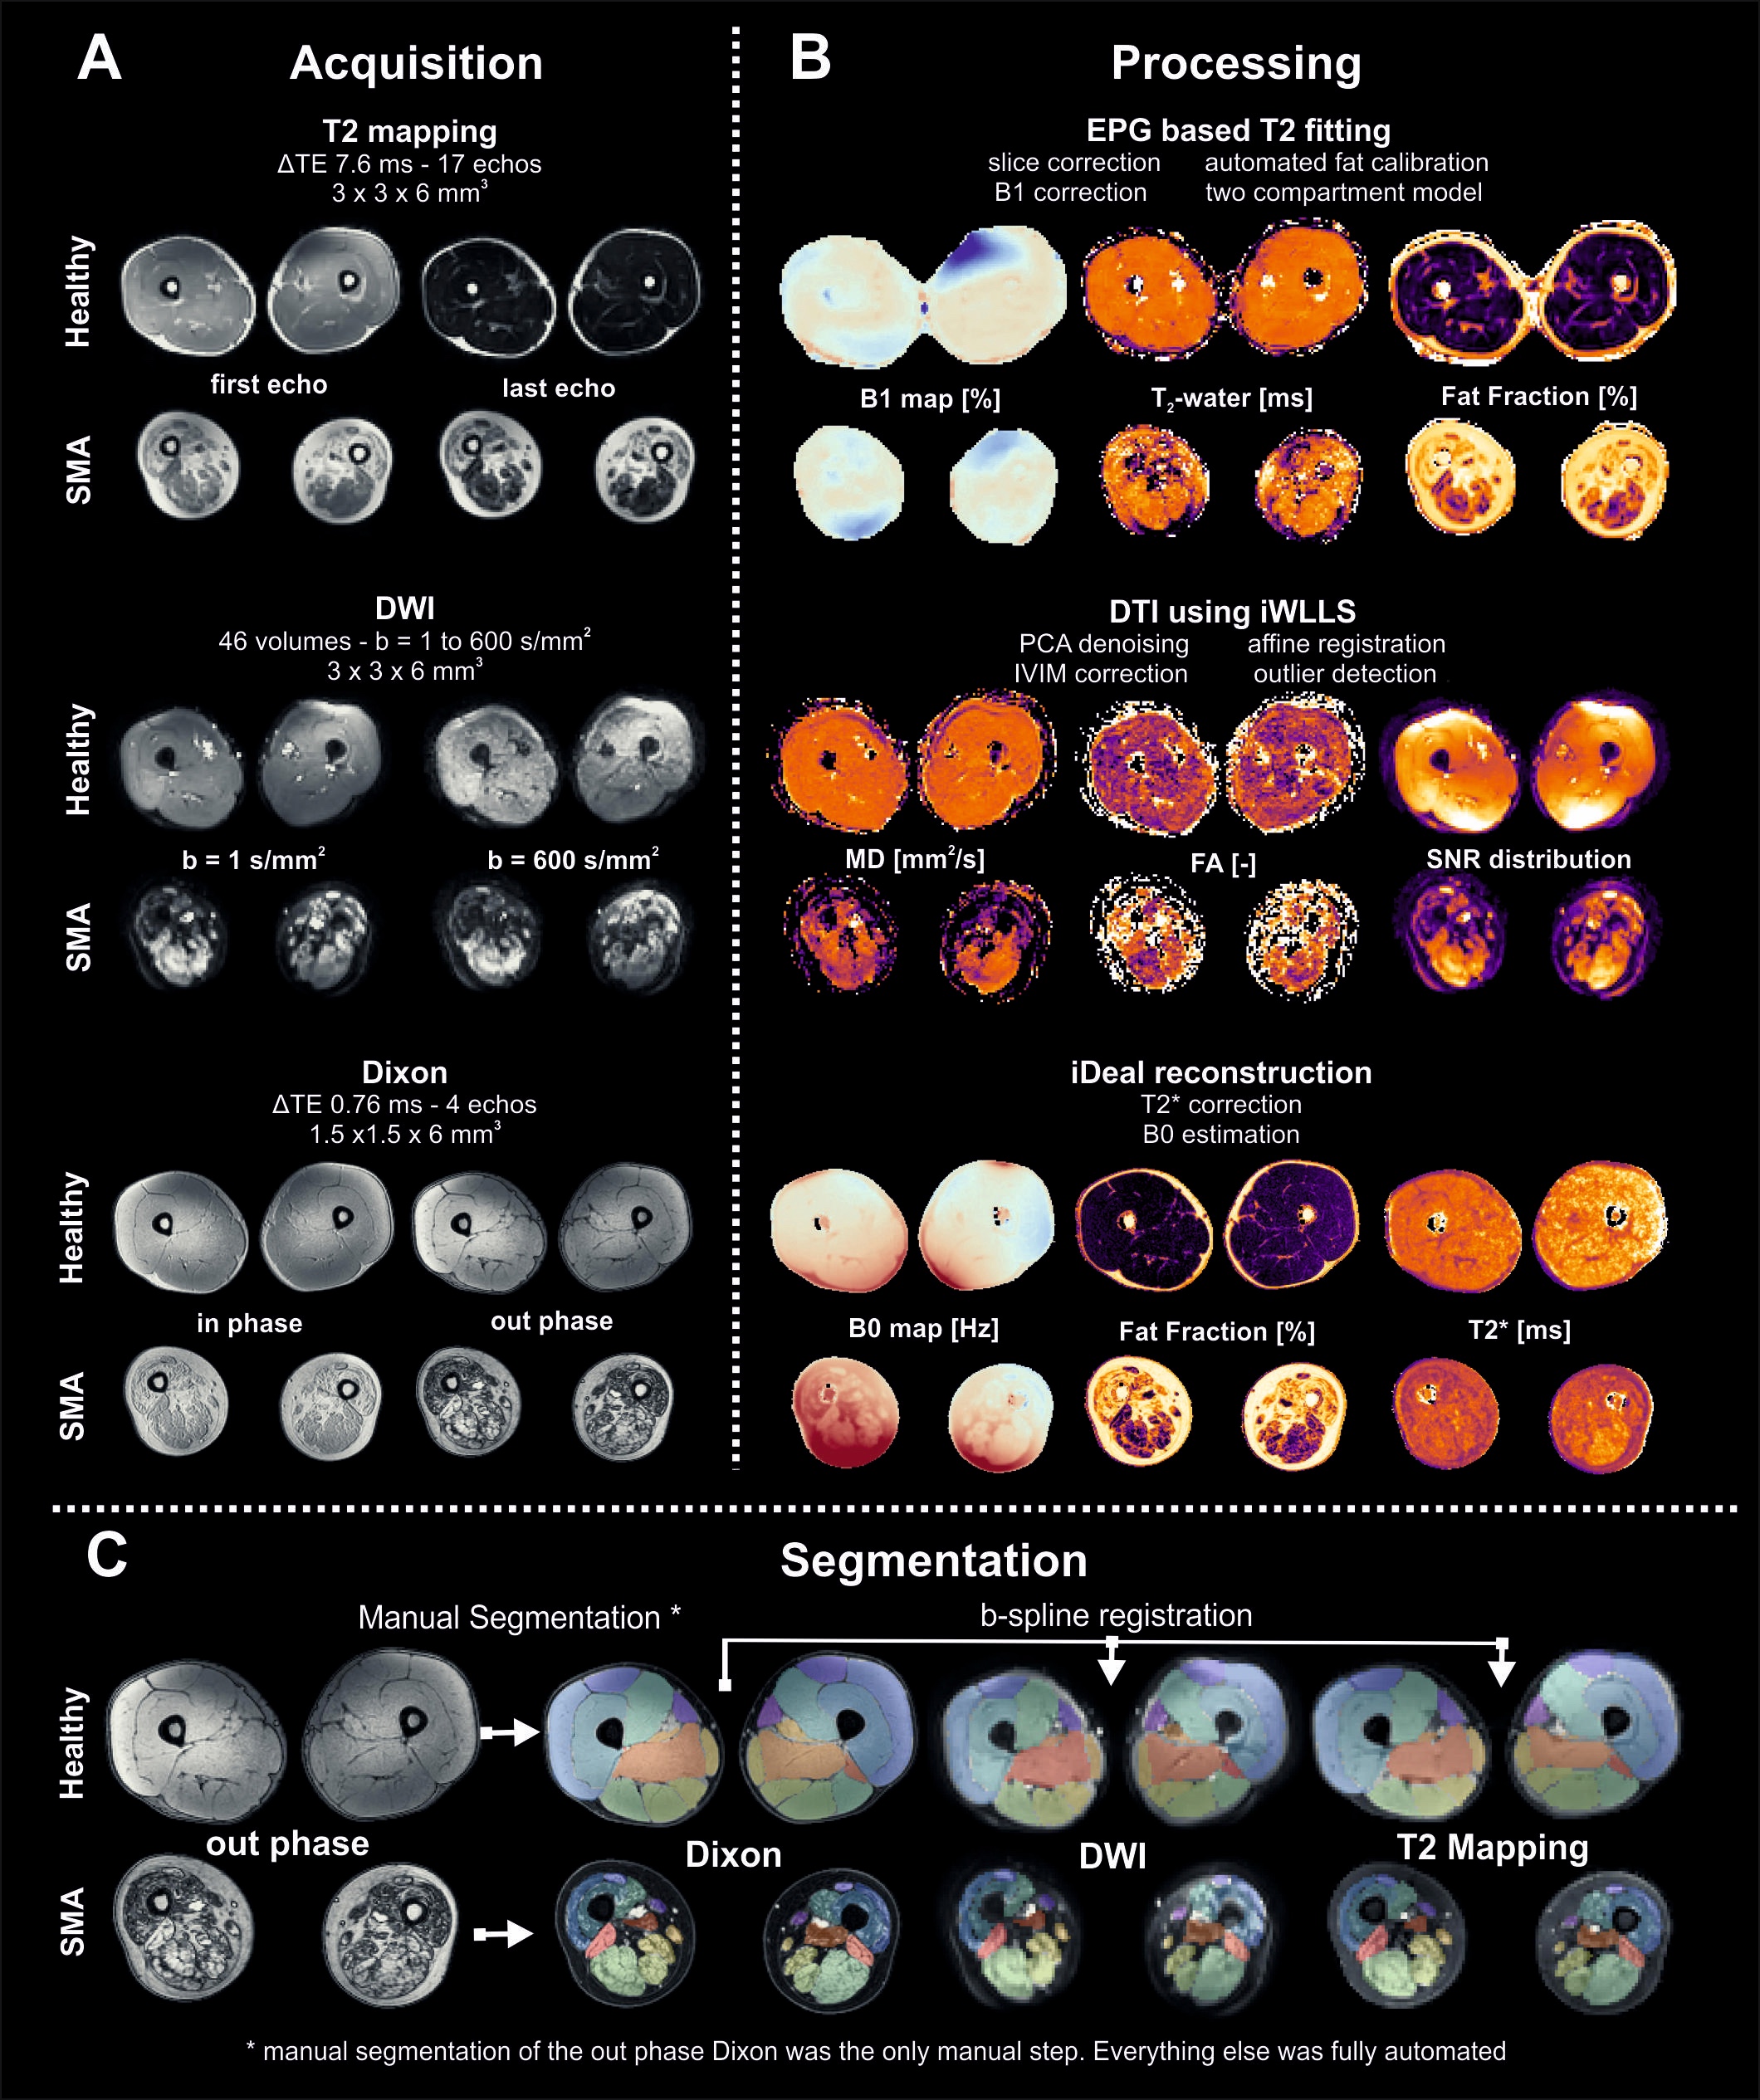
MR datasets of both legs were acquired on a 3T MR scanner (Philips Ingenia, Philips Medical Systems, the Netherlands) in supine position, with a 12-channel posterior and 16 channel anterior body coil. Images were acquired with a FOV of 15cm and aligned with the femur, starting 17,5cm from the femoral head or centered mid-femoral in case of severe contractures. The MR scanning protocol was ~10 minutes and has shown reproducibility in a previous multicenter study7 and comprised: i. 4-point DIXON (TR/TE/ 210/2.6/3.36/4.12/4.88 ms; flip angle 10°; voxel size 1x1.5x1.5; no gap; 25 slices) ii. T2 mapping (17 echoes TR/TE/ΔTE 4598/17/7.6; flip angle 90/180°; voxel size 1x3x3; slice gap 6mm; 13 slices, no fat suppression) iii. SE-EPI (TR/TE 5000/57 ms; b-value 0 s/mm2; voxel size 1x3x3; no gap; 25 slices, 8 dynamics, SPAIR and SPIR fat suppression).
MR processing
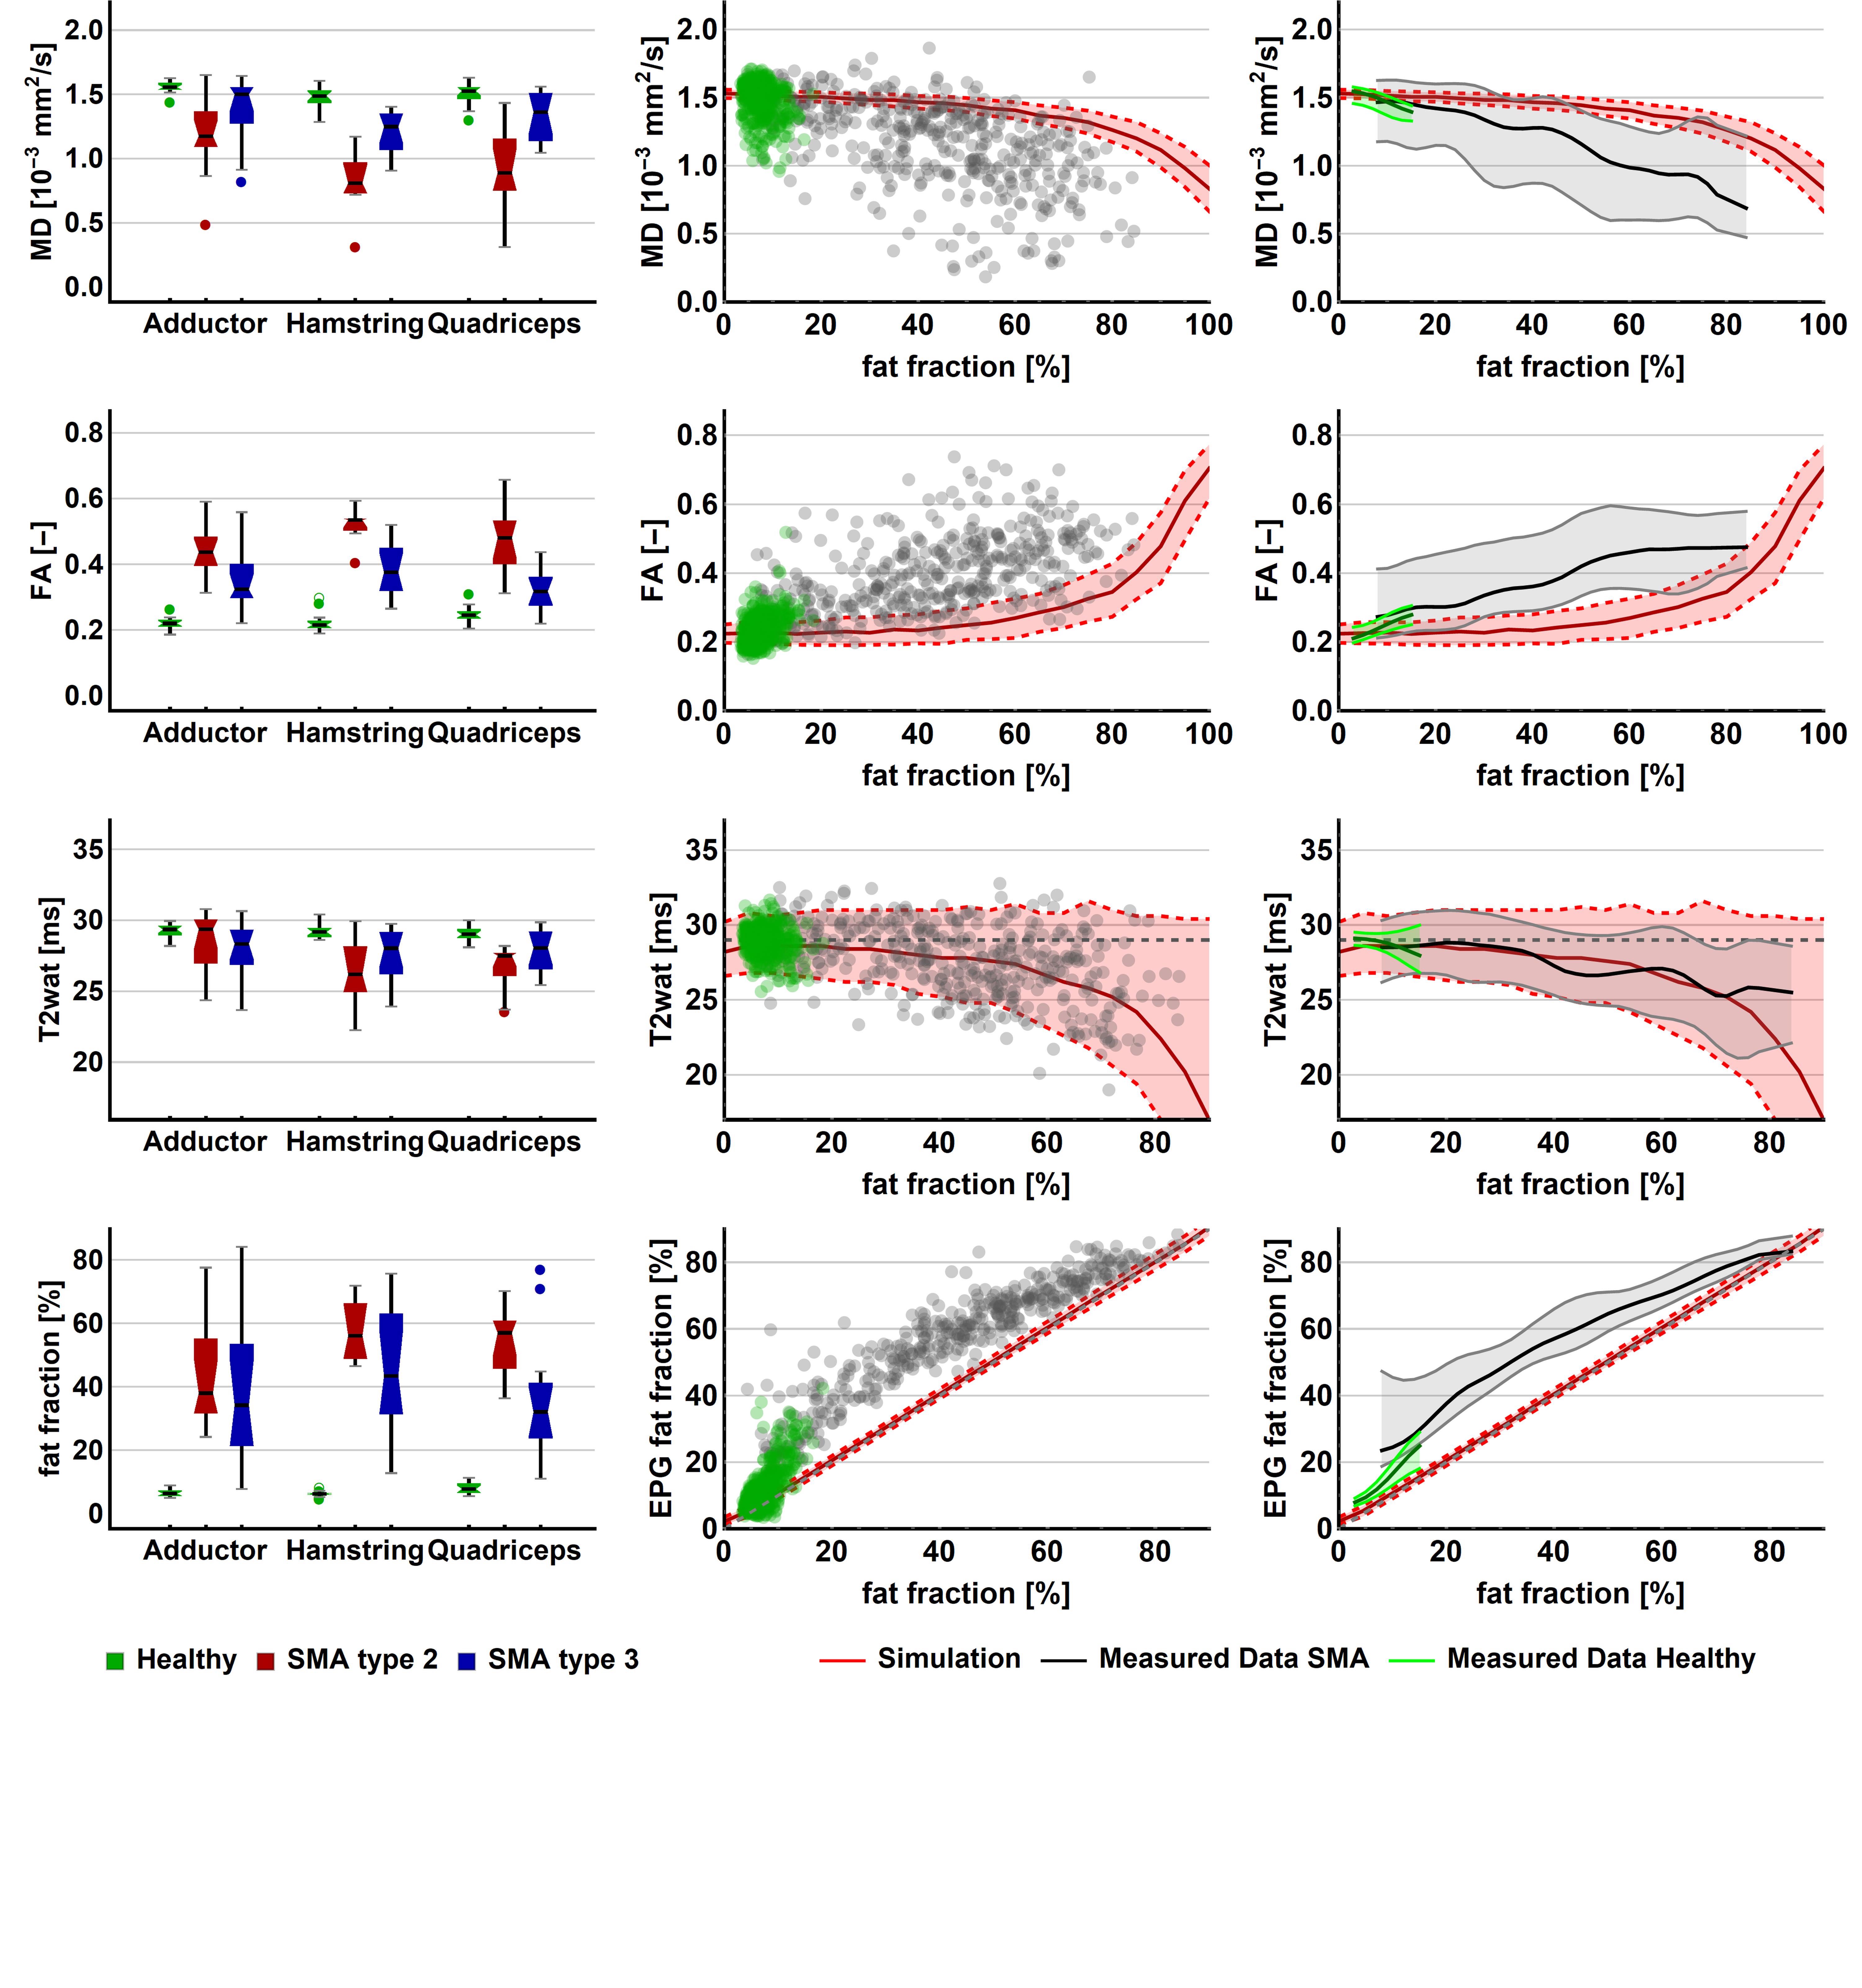
All MR data were processed using QMRITools for Mathematica (mfroeling.github.io/QMRITools)8. The processing steps for each method are summarized in figure 2. Before processing all data was visually inspected for artefacts and data quality. Manual segmentation was done based on the DIXON out-phase and fat images with open-source software (ITK-SNAP9), and transferred to the T2 and DTI data with rigid and b-spline image registration (Elastix10). Muscles with volume smaller than 10 voxels (=67.5mm3) were omitted from analyses. Since the T2 and the DTI parameters have a bias with increasing fat contribution4,11, simulations were performed to estimate this effect (figure 4).4
Statistics
Differences between patients and controls were assessed by means of an independent Student’s t-test with Welch’s correction. MR parameters were averaged across muscles per subject. Due to non-normality of the data, associations between clinical and imaging parameters were evaluated using Kendall’s tau correlation coefficient. Significance was set at p<0.05.
Results
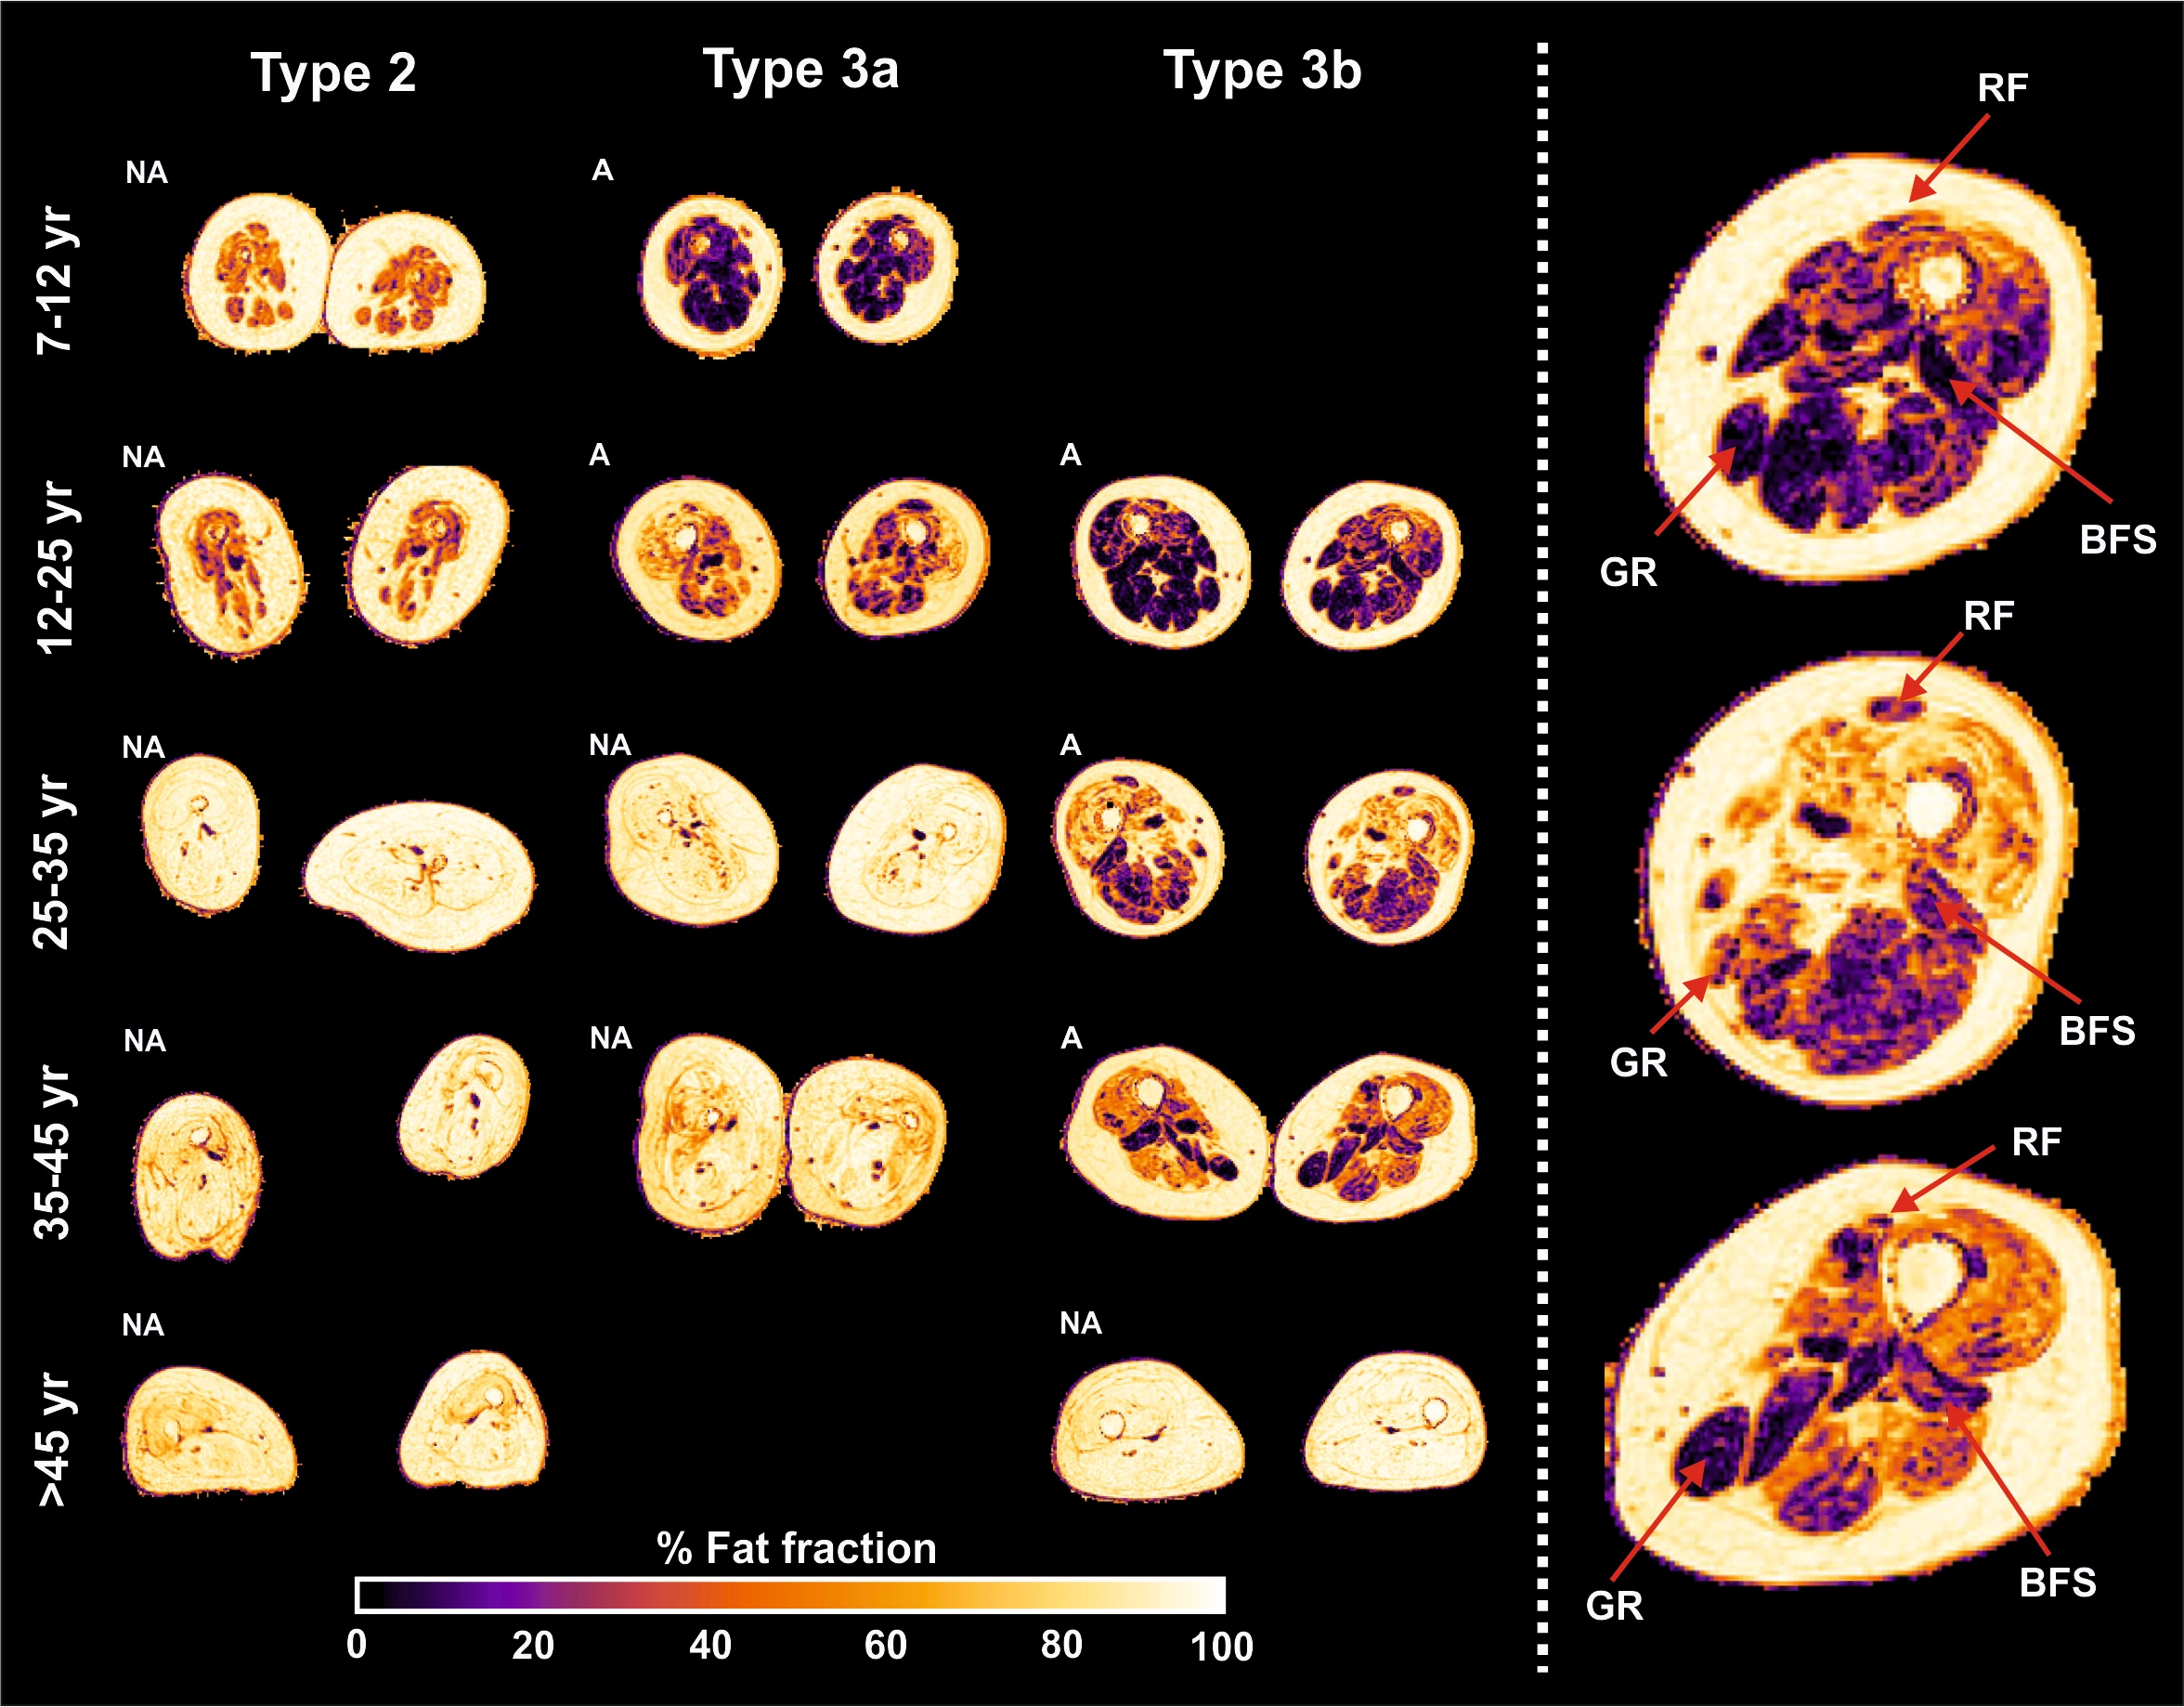
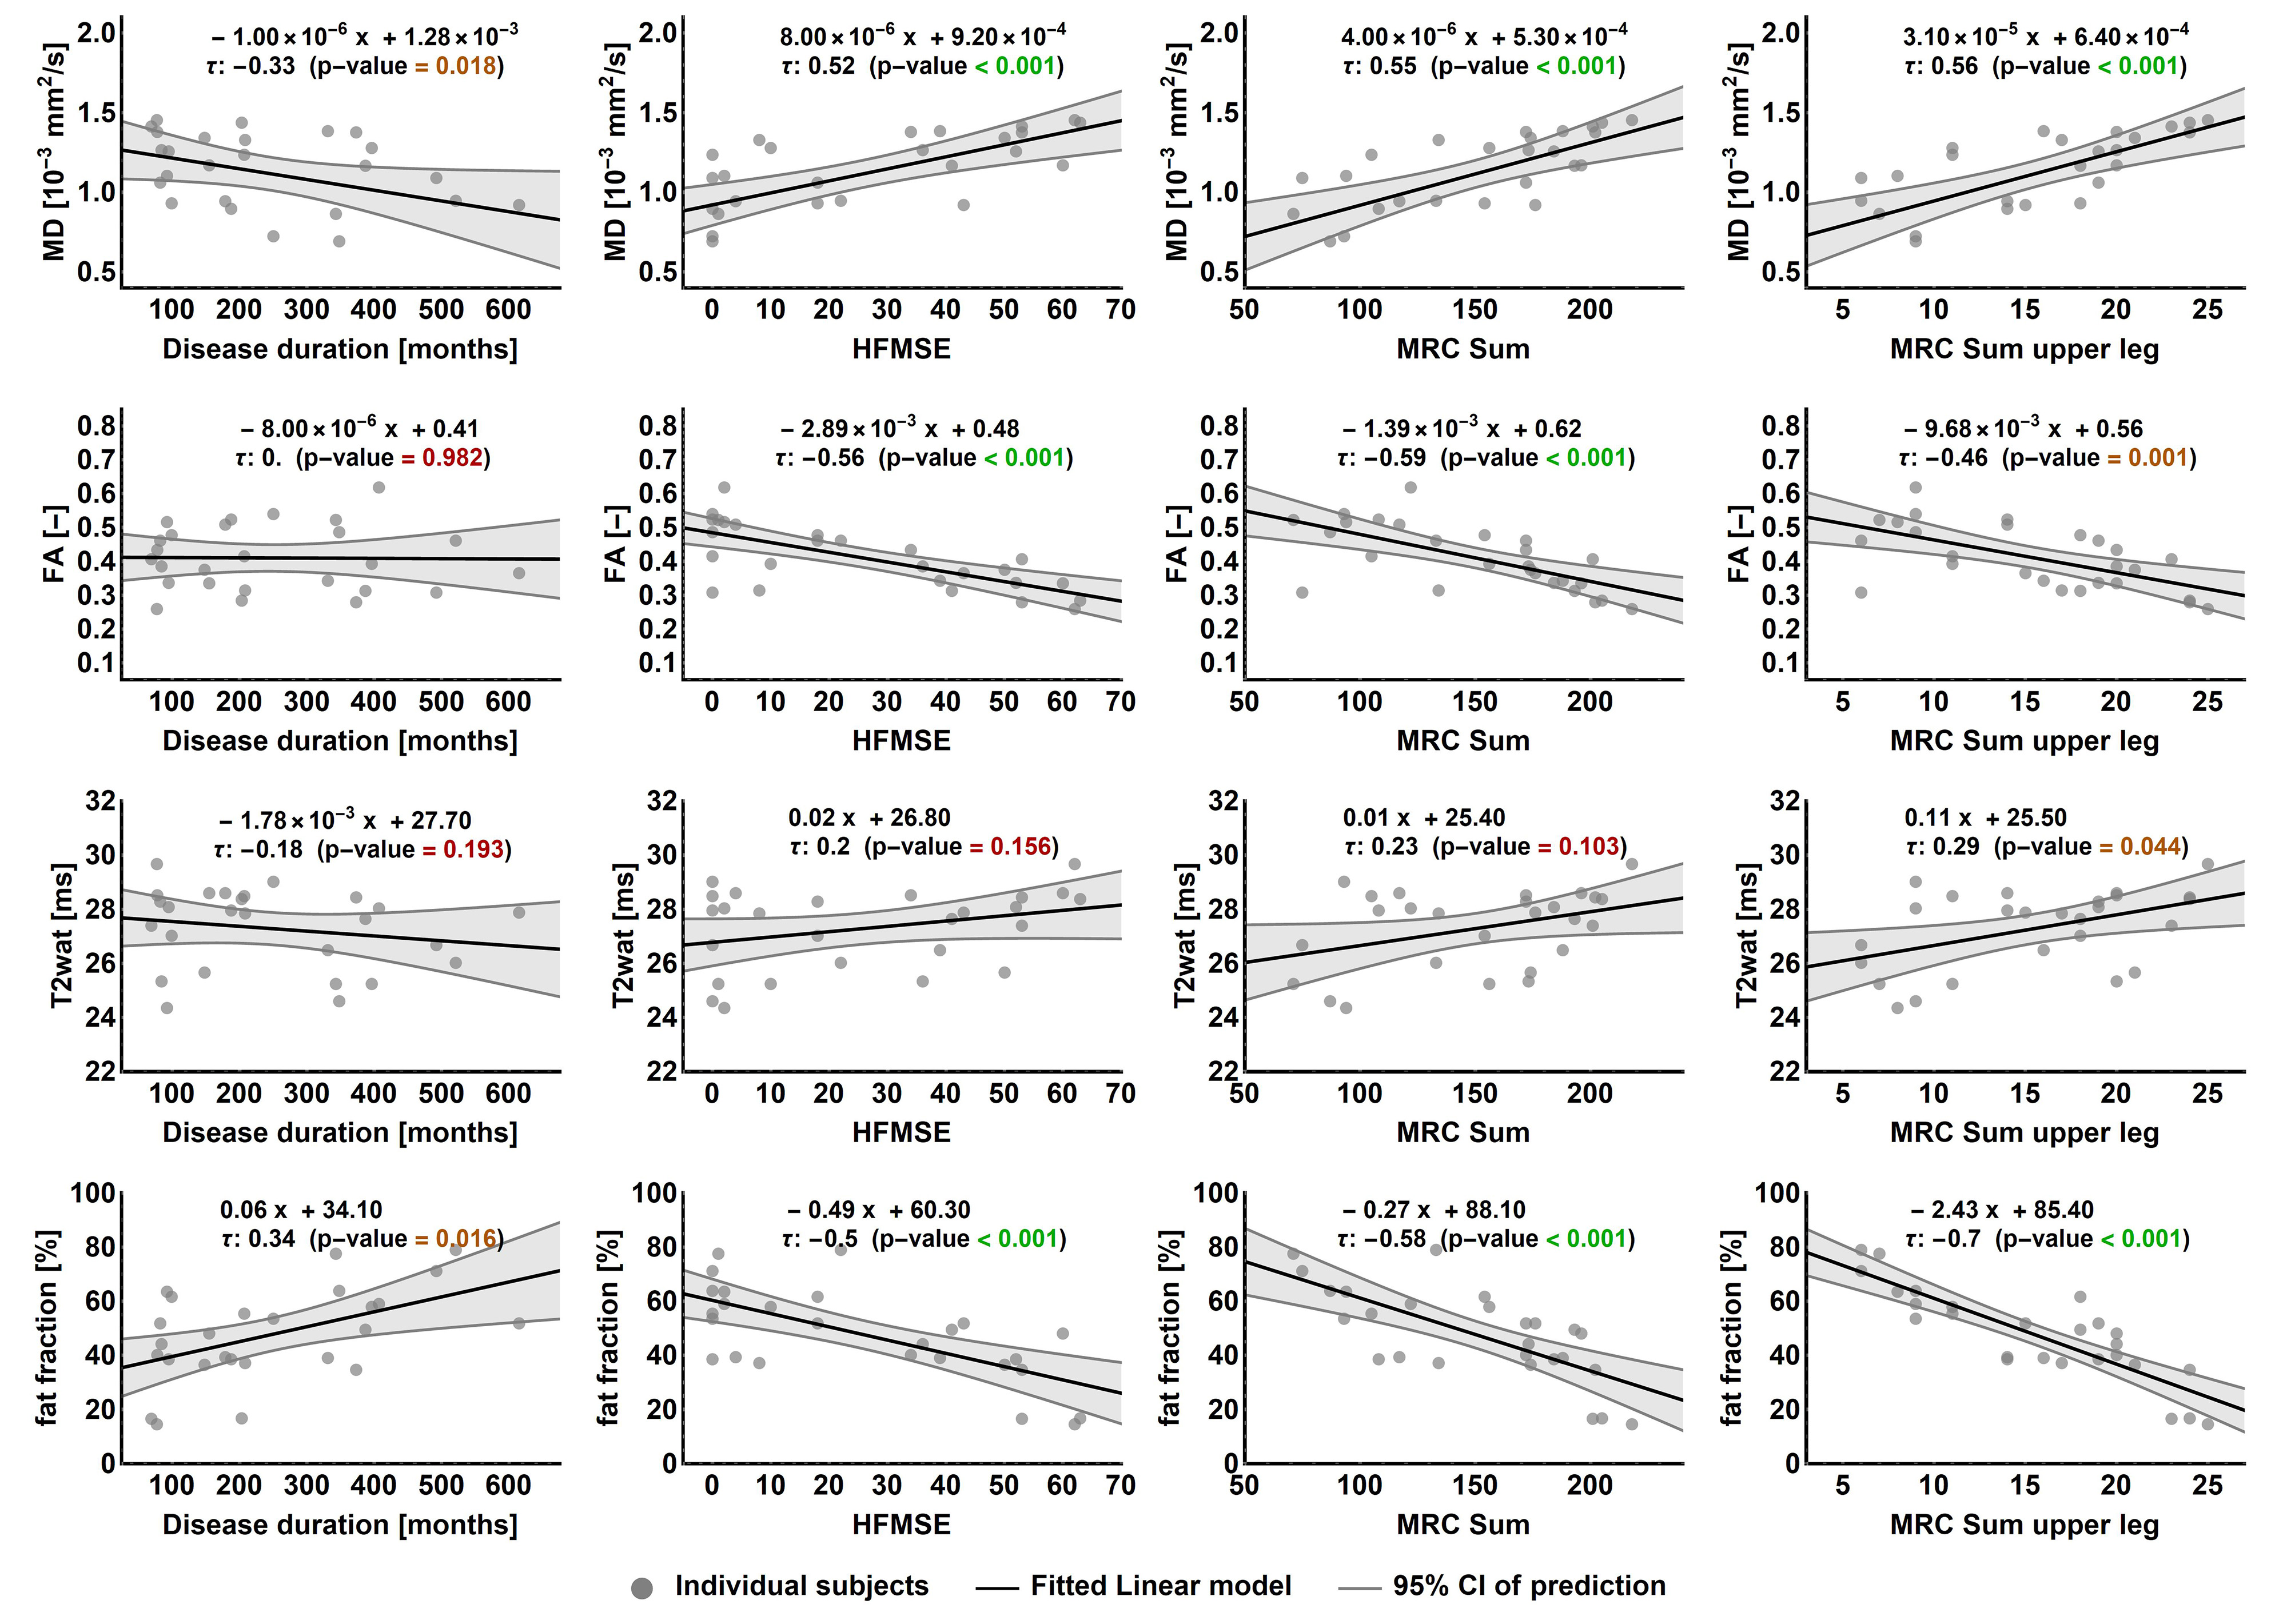
Two datasets were excluded because of image quality, resulting in 49 datasets for analysis.Mean fat fraction of all upper leg muscles was 7.6±1.5% in controls and 47.6±17.4% in patients (p<.001). Mean T2, averaged over all muscles was 27.3±1.5 in patients and 28.9±0.4 in controls (p<.001). MD is lowered in patients (1.13±.28) versus controls (1.47±.10, p<.001). FA is higher (.41±.09) in patients compared to controls (.24±.03, p<.001). The decrease of MD and increase of FA are greater than the predicted effect of an increase of partial volume effects of fat, as illustrated by the simulation experiments. Our data shows that T2 of fat infiltrated muscles follow the predicted T2 decrease due to fat partial volume effects. Overall, we observed that the estimated EPG fat fraction is different from estimated DIXON fat fraction. Fat fraction, FA and MD strongly correlate with muscle strength and motor function: fractional anisotropy is negatively associated with score on the Hammersmith Functional Motor Scale, Expanded and Medical Research Council sum score (τ =-.56 and -.59; both p<.001) whereas for fat fraction values are τ =-.50 and .58, respectively (both p<.001).
Discussion
All qMRI measures differed significantly between patients and controls. FA and MD manifest stronger effects than can be accounted for the effect of fatty replacement partial volume effect. DTI findings indirectly indicate cell atrophy and act as a measure independently of fat fraction which is in accordance with known pathology. Lastly, DTI parameters show correlation with muscle strength and motor function. This suggests the potential of diffusion tensor imaging of muscle in monitoring disease progression and to study pathogenesis of muscle in SMA. From this ongoing study longitudinal data of one-year follow-up in a subset of 10 patients without treatment and 6 children on treatment will determine the potential of qMRI as a biomarker for disease progression or treatment effect. This data is currently being acquired and under analysis.Conclusion
qMRI measures of skeletal muscle in a cohort of patients with SMA varying in type, age and disease severity exhibit potential in monitoring disease progression.Acknowledgements
We thank all SMA patients, their families and control subjects for their participation. We thank Christa van Ekris for her assistance. This work was supported by the Prinses Beatrix Spierfonds (Grant no. W.OR16-06). The Dutch SMA register is supported by stichting Spieren voor Spieren.References
1. Lefebvre S, Bürglen L, Reboullet S, et al. Identification and characterization of a spinal muscular atrophy-determining gene. Cell. 1995;80:155-165. doi:10.1016/0092-8674(95)90460-3
2. Mercuri E, Finkel R, Montes J, et al. Patterns of disease progression in type 2 and 3 SMA: Implications for clinical trials. Neuromuscul Disord. 2016;26(2):126-131. doi:10.1016/j.nmd.2015.10.006
3. Rehmann R, Schlaffke L, Froeling M, et al. Muscle diffusion tensor imaging in glycogen storage disease V (McArdle disease). Eur Radiol. 2019;29:3224-3232. doi:10.1007/s00330-018-5885-1
4. Hooijmans MT, Damon BM, Froeling M, et al. Evaluation of skeletal muscle DTI in patients with duchenne muscular dystrophy. NMR Biomed. 2015;28:1589-1597. doi:10.1002/nbm.3427
5. Willis TA, Hollingsworth KG, Coombs A, et al. Quantitative Muscle MRI as an Assessment Tool for Monitoring Disease Progression in LGMD2I: A Multicentre Longitudinal Study. PLoS One. 2013;8. doi:10.1371/journal.pone.0070993
6. Carlier PG, Azzabou N, de Sousa PL, et al. Skeletal muscle quantitative nuclear magnetic resonance imaging follow-up of adult Pompe patients. J Inherit Metab Dis. 2015;38:565-572. doi:10.1007/s10545-015-9825-9
7. Schlaffke L, Rehmann R, Rohm M, et al. Multicenter evaluation of stability and reproducibility of quantitative MRI measures in healthy calf muscles. NMR Biomed. 2019:1-14. doi:10.1002/nbm.4119
8. Froeling M. QMRTools: a Mathematica toolbox for quantitative MRI analysis. J Open Source Softw. 2019. doi:10.21105/joss.01204
9. Yushkevich PA, Piven J, Hazlett HC, et al. User-guided 3D active contour segmentation of anatomical structures: Significantly improved efficiency and reliability. Neuroimage. 2006;31(3):1116-1128. doi:10.1016/j.neuroimage.2006.01.015
10. Klein S, Staring M, Murphy K, Viergever MA, Pluim JPW. Elastix: A toolbox for intensity-based medical image registration. IEEE Trans Med Imaging. 2010;29:196-205. doi:10.1109/TMI.2009.2035616
11. Williams SE, Heemskerk AM, Welch EB, Li K, Damon BM, Park JH. Quantitative effects of inclusion of fat on muscle diffusion tensor MRI measurements. J Magn Reson Imaging. 2013;38:1292-1297. doi:10.1002/jmri.24045
Figures