0343
High-resolution phosphocreatine mapping using artificial neural network-based CEST MRI at 3T: A validation study1Department of Radiology and Radiological Science, The Johns Hopkins University School of Medicine, Baltimore, MD, United States, 2F.M. Kirby Research Center for Functional Brain Imaging, Kennedy Krieger Research Institute, Baltimore, MD, United States, 3Division of Cardiology Department of Medicine, Johns Hopkins University School of Medicine, Baltimore, MD, United States, 4Department of Biomedical Engineering, City University of Hong Kong, Hong Kong, China
Synopsis
Phosphocreatine (PCr) plays a vital role in neuron and myocyte energy homeostasis, and measurement of PCr provides a unique way to achieve insight into cellular energetics. Our previous study demonstrated that high-resolution PCr mapping of human skeletal muscle can be obtained on standard 3T clinical MRI scanner using artificial neural network-based chemical exchange saturation transfer (ANNCEST). Here, for further validation, we applied ANNCEST to measure PCr changes in exercised skeletal muscle and compared the measures with those from 31P magnetic resonance spectroscopy. The feasibility of estimating spatially resolved PCr recovery rate constants using ANNCEST was also demonstrated.
Introduction
Phosphocreatine (PCr) is a high-energy phosphate compound that is abundant in muscle and used by creatine kinase isoenzymes to generate adenosine triphosphate from adenosine diphosphate(1). To date, phosphorus-31 magnetic resonance spectroscopy (31P MRS) has been the established method for non-invasively detecting and quantifying PCr in vivo(2-4). However, the inherently low detection sensitivity and limited availability on the majority of clinical MRI scanners hinder the wide application of 31P MRS to detect PCr in clinical practice. Chemical exchange saturation transfer (CEST) is an MRI sensitivity-enhancing approach that has shown great potential in detecting several low-concentration metabolites in vivo(5-7). Our previous study demonstrated that high-resolution PCr mapping can be obtained on a standard 3T clinical MRI scanner using artificial neural network-based chemical exchange saturation transfer (ANNCEST)(8). In this study, we applied ANNCEST to detect and quantify PCr depletion and recovery in exercised human skeletal muscle, and validated these measures by comparing them with those from 31P MRS. We also demonstrate the feasibility of estimating an ANNCEST PCr recovery rate map which can be used to estimate maximal mitochondrial oxidative capacity(3).Methods
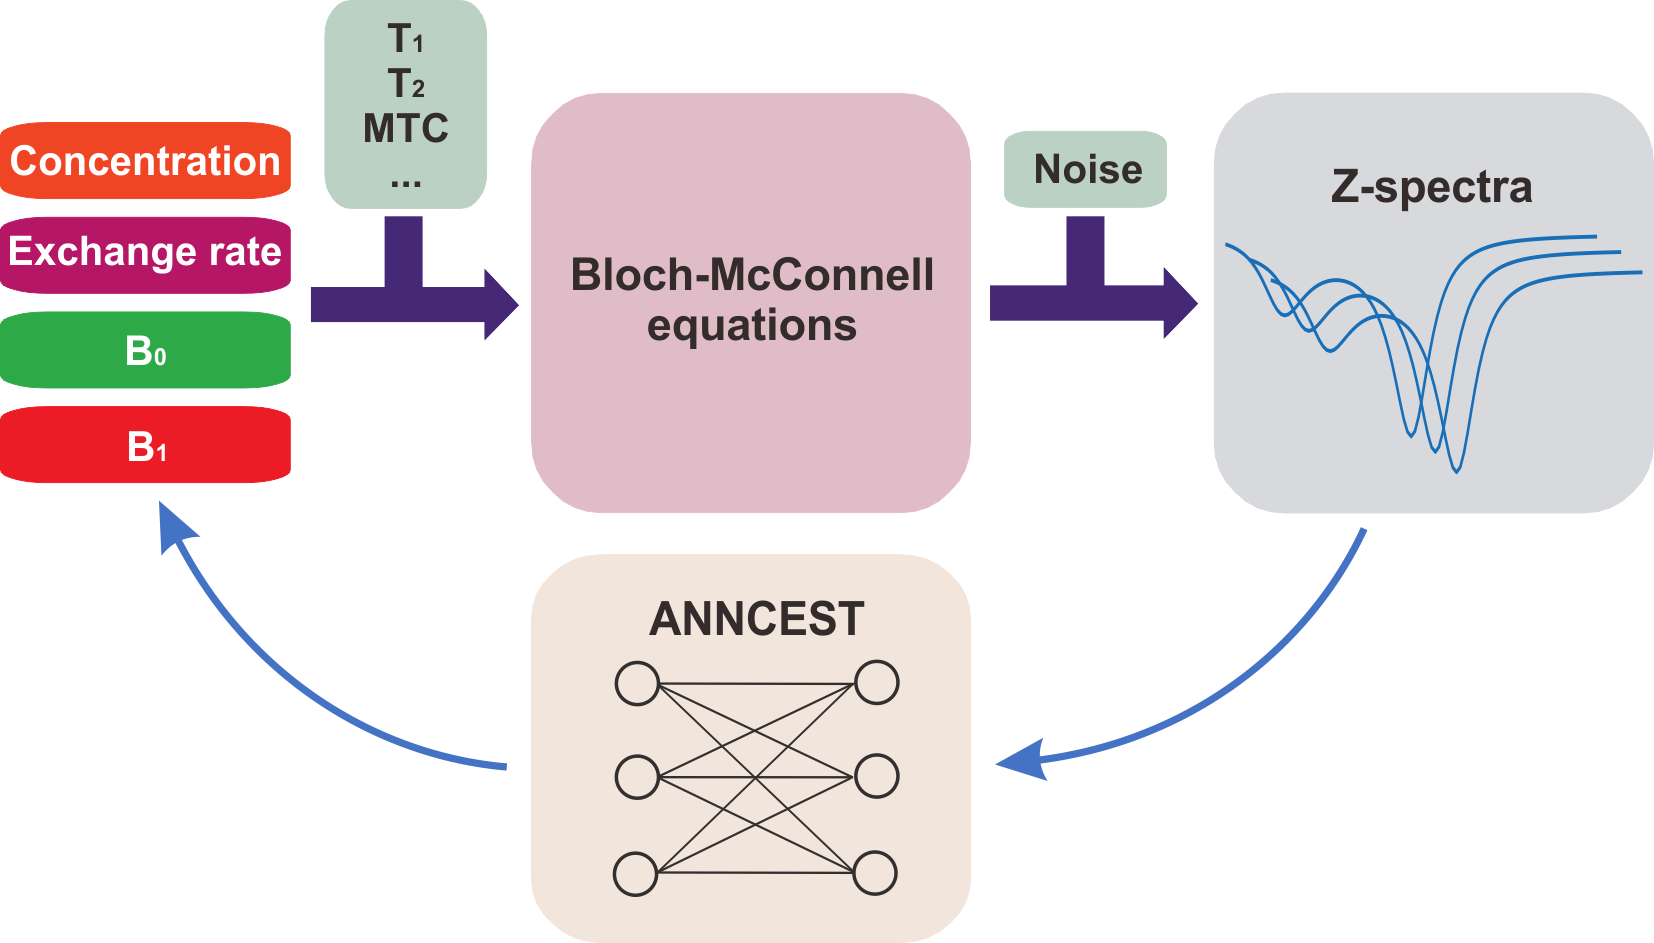
The flowchart of ANNCEST is shown in Fig. 1. The CEST experiments and 31P 2D MRS on exercised human skeletal muscle were performed on a 3T Philips MRI system equipped with a 2-channel surface coil for 1H imaging and a 31P transmitting/receiving coil placed beneath the calf muscle of the lower extremity for 31P 2D MRS respectively. Four healthy subjects (age 27± 5 years) were recruited for in-magnet plantar flexion exercise (PFE). CEST images were acquired using a single-shot TSE sequence with TR = 3 s, TE = 9.3 ms, TSE factor = 37, a matrix size of 72 × 72, and a resolution of 2.2 × 2.2 × 20.0 mm3. The Z-spectra between 1.3 ppm and 3.5 ppm were sampled with saturation offset number of 30 and a total scan time of 1.5 min. The 31P 2D MRS was performed with TR = 1.5 s, TE = 1.44 ms and a total scan time of 1.5 min. The k-space data were then reconstructed on a 16 × 16 grid leading to a voxel size of 10 × 10 mm2. The slice thickness of 31P 2D MRS was determined by the excitation profile of the 31P coil, which is in the order of 80 mm. The exercise protocol involved PFE with repetitively lifting a 16 lb weight at a rate of 1 Hz for 80 s, and then holding the load for 90 s before stopping all exercise to allow subsequent measures of post-exercise PCr recovery.Linear regression analysis was performed to compare PCr maps obtained by ANNCEST and 31P 2D MRS using linear model , where b refers to the linear regression coefficient. ANNCEST results were downsampled to match the matrix size of 31P 2D MRS. To remove the motions during ANNCEST experiments, image registration was applied to CEST images using Medical Imaging Registration Toolbox (9).
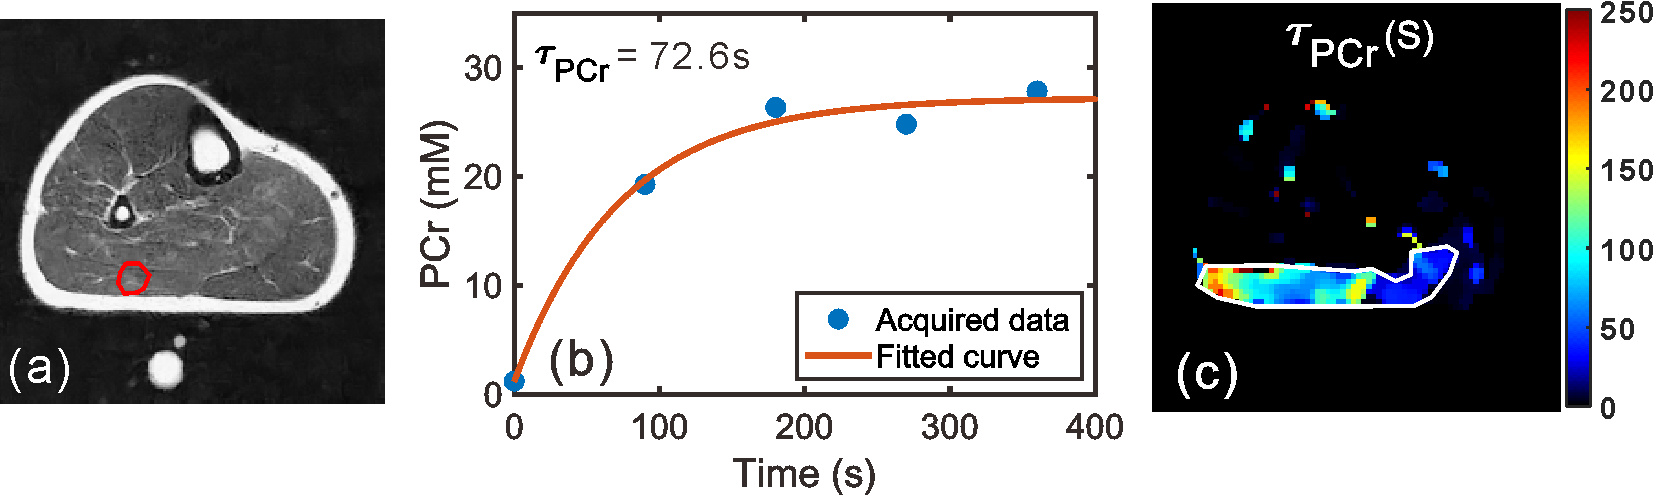
The PCr recovery time constant $$$\tau_{PCr} $$$ was fitted using the following equation(10):
$$PCr(t) = PCr_{0}+\triangle PCr\cdot(1-e^{-t/\tau_{PCr}})[1]$$
where PCr0 is the PCr concentration at the end of exercise, $$$\triangle$$$ PCr refers to the difference in PCr concentration between resting and end of exercise.
Results and Discussion
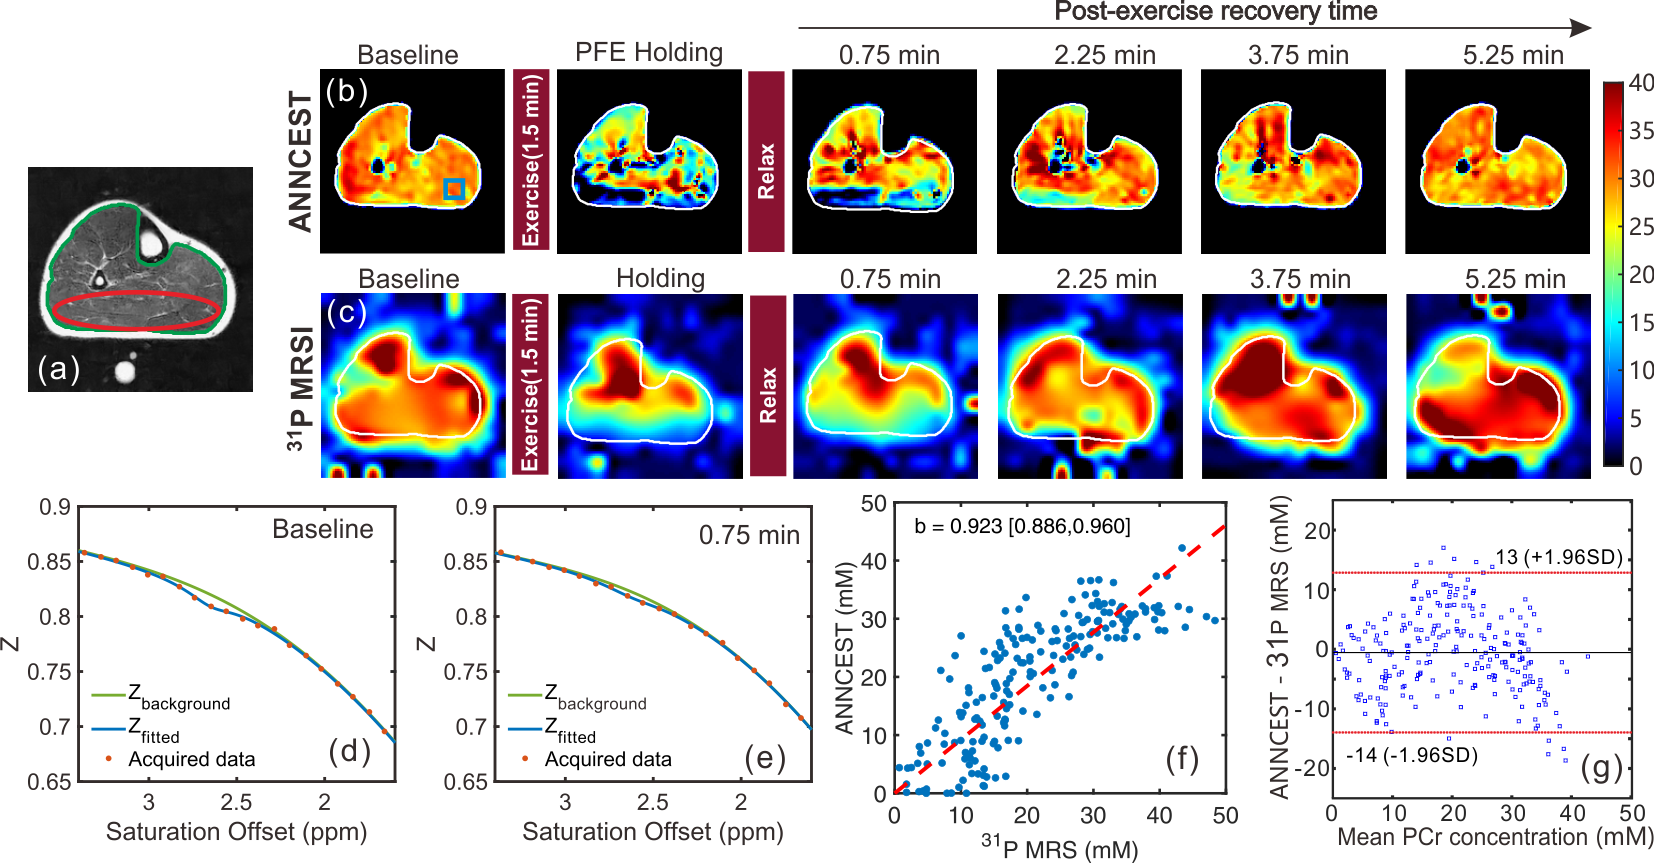
The PCr mapping using ANNCEST was validated by comparison with 31P 2D MRS measures obtained before and during in-magnet PFE. Subjects underwent the same exercise protocol, once with CEST acquisitions and once with 31P 2D MRS, in varied order. Shortly after the exercise, the PCr depletion in the gastrocnemius muscles recovered to basal values on the PCr maps obtained by both ANNCEST and 31P 2D MRS as shown by the representative results in Figs. 2b,c. The Z-spectra for a region of interest in the gastrocnemius muscles obtained at two-time points are also plotted and demonstrate the decrease of the PCr CEST peak after the exercise (Figs. 2d,e), namely from 30.4 mM to 15.4 mM. The PCr depletion observed in the muscle regions is in good agreement with those reported previously in healthy volunteers using 31P MRS, in which the gastrocnemius muscle showed significantly greater PCr depletion than other muscle groups during PFE(11-13). PCr concentrations obtained by ANNCEST during exercise agreed very well with those measured by 31P 2D MRS, as indicated by the linear regression coefficient (b = 0.923 with 95% confidence intervals from 0.886 to 0.960) and Bland-Altman analyses between two methods in Figs. 2f,g, respectively.A preliminary result of estimating spatially resolved map of PCr recovery rate constant using ANNCEST is shown in Fig. 3 and a recovery time constant of 70.7±55.4 s was obtained, which is consistent with that reported in the previous study (63.1 ± 25.9 s)(14). However, the temporal resolution of PCr ANNCEST in the current study (i.e. 90 s) was too low to capture very detailed dynamic changes. Future possibilities for reducing the scan time of PCr ANNCEST are adopting fewer saturation offsets or utilizing fast CEST sequences(15-17), which needs further study.
Conclusion
Bland Altman analysis shows that the PCr ANNCEST MRI measures agree with those from 31P MRS, suggesting that ANNCEST has potential as a cost-effective and widely available method for measuring PCr and diagnosing related diseases.Acknowledgements
This work was supported by the grants from NIH: R01EB015032, P41EB015909, R01 HL61912, R01HL63030, R03NS109664, 1S10OD021648, and DOD W81XWH-18-1-0797.References
1. Wyss M, Kaddurah-daouk R. Creatine and Creatinine Metabolism. Physiol Rev 2000;80:1107.
2. Hoult DI, Busby SJ, Gadian DG, Radda GK, Richards RE, Seeley PJ. Observation of tissue metabolites using 31P nuclear magnetic resonance. Nature 1974;252(5481):285-287.
3. Arnold DL, Matthews PM, Radda GK. Metabolic recovery after exercise and the assessment of mitochondrial function in vivo in human skeletal muscle by means of 31P NMR. Magn Reson Med 1984;1(3):307-315.
4. Kemp GJ, Radda GK. Quantitative interpretation of bioenergetic data from 31P and 1H magnetic resonance spectroscopic studies of skeletal muscle: an analytical review. Magn Reson Q 1994;10(1):43-63.
5. Ward KM, Aletras AH, Balaban RS. A New Class of Contrast Agents for MRI Based on Proton Chemical Exchange Dependent Saturation Transfer (CEST). J Magn Reson 2000;143(1):79-87.
6. Haris M, Nanga RP, Singh A, Cai K, Kogan F, Hariharan H, Reddy R. Exchange rates of creatine kinase metabolites: feasibility of imaging creatine by chemical exchange saturation transfer MRI. NMR Biomed 2012;25(11):1305-1309.
7. van Zijl PCM, Lam WW, Xu J, Knutsson L, Stanisz GJ. Magnetization Transfer Contrast and Chemical Exchange Saturation Transfer MRI. Features and analysis of the field-dependent saturation spectrum. NeuroImage 2018;168:222-241.
8. Chen L, Schär M, Chan KWY, Huang J, Qin Q, Weiss RG, van Zijl PCM, Xu J. High-resolution phosphocreatine mapping of human skeletal muscle by artificial neural network-based chemical exchange saturation transfer MRI at 3T. ISMRM 27th Annual Meeting & Exhibition, Montreal, 11-16 May 2019.
9. Myronenko A, Song X. Intensity-based image registration by minimizing residual complexity. IEEE Trans Med Imaging 2010;29(11):1882-1891.
10. Isbell DC, Berr SS, Toledano AY, Epstein FH, Meyer CH, Rogers WJ, Harthun NL, Hagspiel KD, Weltman A, Kramer CM. Delayed calf muscle phosphocreatine recovery after exercise identifies peripheral arterial disease. J Am Coll Cardiol 2006;47(11):2289-2295.
11. Fiedler GB, Meyerspeer M, Schmid AI, Goluch S, Schewzow K, Laistler E, Mirzahosseini A, Niess F, Unger E, Wolzt M, Moser E. Localized semi-LASER dynamic (31)P magnetic resonance spectroscopy of the soleus during and following exercise at 7 T. Magma 2015;28(5):493-501.
12. Valkovic L, Chmelik M, Meyerspeer M, Gagoski B, Rodgers CT, Krssak M, Andronesi OC, Trattnig S, Bogner W. Dynamic (31) P-MRSI using spiral spectroscopic imaging can map mitochondrial capacity in muscles of the human calf during plantar flexion exercise at 7 T. NMR Biomed 2016;29(12):1825-1834.
13. Khegai O, Madelin G, Brown R, Parasoglou P. Dynamic phosphocreatine imaging with unlocalized pH assessment of the human lower leg muscle following exercise at 3T. Magn Reson Med 2018;79(2):974-980.
14. Schmid AI, Meyerspeer M, Robinson SD, Goluch S, Wolzt M, Fiedler GB, Bogner W, Laistler E, Krssak M, Moser E, Trattnig S, Valkovic L. Dynamic PCr and pH imaging of human calf muscles during exercise and recovery using (31) P gradient-Echo MRI at 7 Tesla. Magn Reson Med 2016;75(6):2324-2331.
15. Zhang Y, Heo H-Y, Lee D-H, Jiang S, Zhao X, Bottomley PA, Zhou J. Chemical exchange saturation transfer (CEST) imaging with fast variably-accelerated sensitivity encoding (vSENSE). Magn Reson Med 2017;77(6):2225-2238.
16. Heo H-Y, Zhang Y, Lee D-H, Jiang S, Zhao X, Zhou J. Accelerating chemical exchange saturation transfer (CEST) MRI by combining compressed sensing and sensitivity encoding techniques. Magn Reson Med 2017;77(2):779-786.
17. Zhang S, Liu Z, Grant A, Keupp J, Lenkinski RE, Vinogradov E. Balanced Steady-State Free Precession (bSSFP) from an effective field perspective: Application to the detection of chemical exchange (bSSFPX). J Magn Reson 2017;275:55-67.
Figures