0341
T2 mapping in healthy and diseased muscle using optimized extended phase graph algorithms in four clinical cohorts
Kevin Keene1,2, Jan-Willem Beenakker1,3, Melissa Hooijmans4, Karin Naarding2,5, Erik Niks2, Louise Otto6, Ludo van der Pol6, Martijn Tannemaat2, Hermien Kan1,5, and Martijn Froeling7
1Department of Radiology, C.J. Gorter center for high field MRI, Leiden University Medical Center, Leiden, Netherlands, 2Department of Neurology, Leiden University Medical Center, Leiden, Netherlands, 3Department of Ophthalmology, Leiden University Medical Center, Leiden, Netherlands, 4Amsterdam University Medical Center, Amsterdam, Netherlands, 5Duchenne Center Netherlands, Utrecht, Netherlands, 6Department of Neurology, UMC Utrecht Brain Center, University Medical Center Utrecht, Utrecht, Netherlands, 7Department of Radiology, University Medical Center Utrecht, Utrecht, Netherlands
1Department of Radiology, C.J. Gorter center for high field MRI, Leiden University Medical Center, Leiden, Netherlands, 2Department of Neurology, Leiden University Medical Center, Leiden, Netherlands, 3Department of Ophthalmology, Leiden University Medical Center, Leiden, Netherlands, 4Amsterdam University Medical Center, Amsterdam, Netherlands, 5Duchenne Center Netherlands, Utrecht, Netherlands, 6Department of Neurology, UMC Utrecht Brain Center, University Medical Center Utrecht, Utrecht, Netherlands, 7Department of Radiology, University Medical Center Utrecht, Utrecht, Netherlands
Synopsis
Multi-echo spin-echo transverse relaxometry mapping using multi-component models is used to study disease activity in neuromuscular disease. A recent model using extended phase graphs (EPG) was introduced to obtain separate T2 values for water and fat, accounting for B1 and stimulated echoes. We improved this model and showed the importance of including flip angle slice profiles with a chemical shift displacement in the slice direction and correct calibration methods for the T2 of the fat component. We showed its performance in four clinical cohorts, and showed a gradual decline in T2water with increasing fat fractions.
Introduction
Quantitative MRI is showing increasing promise as a biomarker in the follow-up of disease progression in neuromuscular diseases (NMD).1 Transverse relaxometry maps from multi-echo spin-echo (MSE) can be separated into different relaxation components for water (T2water) and fat (T2fat), where T2water has been proposed as a marker for disease activity.2 Originally, bi-exponential3 or tri-exponential4,5 methods were introduced to separate water and fat signal contributions at successive echo times. Later, an extended phase graph (EPG)6 algorithm was introduced, which accounts for B1 and stimulated echoes.7 However, this model is not optimized for high fat fractions above 50%7 and the effect of inaccuracies in the T2fat calibration remain unexplored. In the present work, we aimed to improve the performance of EPG fitting methods over a large range of fat fractions, by including the slice selection flip angle profile, a chemical shift displacement correction and optimized calibration of T2fat.Methods
An EPG signal model including a flip angle slice profile with chemical shift displacement was used to fit MSE signals with a dictionary method.7–9 Simulation experiments were used to study the influence of the flip angle slice profile with chemical shift (simulation 1) and the influence of the assumed T2fat (simulation 2). Next, in vivo data from four patient cohorts (92 patients and 56 healthy controls (HC) in total) were used to evaluate the performance of different T2fat calibration methods. The patient cohorts comprised data from: arm scans from 18 Duchenne muscular dystrophy (DMD) patients and 11 HC (cohort 1, TE/ΔTE/TR/echoes/resolution 8ms/8ms/17/3000ms/2x2x10mm3), leg scans from 22 DMD patients and 12 HC (cohort 2, TE/ΔTE/TR/echoes/resolution 8ms/8ms/17/3000ms/1.6x1.6x10mm3), leg scans from 23 Becker muscular dystrophy patients and 13 HC (cohort 3, TE/ΔTE/TR/echoes/resolution 8ms/8ms/17/3000ms/1.6x1.6x10mm3) and thigh scans from 29 spinal muscular atrophy patients and 20 HC (cohort 4, TE/ΔTE/TR/echoes/resolution 7.6ms/7.6ms/17/4598ms/3x3x6mm3). All cohorts were scanned at 3T using multi-slice acquisition, and data from one ROI encompassing all muscles was evaluated. The T2fat was calibrated for each subject on subcutaneous fat using three different methods. Method A assumed one pure fat component, method B estimated T2fat using a two-component model with a fat fraction of 90%10, and method C, was the same as method B but additionally the T2 of the water component was fixed to 20ms, to stabilize fitting with low water signal. Trend lines in figures were drawn using LOWESS regression and T2water values between different calibration methods were compared using paired t-tests.Results
Excluding the effect of flip angle slice profiles resulted in an overall underestimation of fat fractions and overestimation of T2water, with a median error of 10ms (Simulation 1A, figure 1). Not taking the chemical shift in the flip angle slice profile into account led to an overestimation of T2water of 4ms for a large simulated shift (Simulation 1B, figure 2). Furthermore, a wrongly calibrated T2fat strongly influenced the estimation of the T2water (Simulation 2, figure 3). For the in vivo data, histograms of in vivo calibrated T2fat showed that a one-component model leads to a relatively low T2fat compared to the two-component methods (figure 4). When comparing this to fat fractions, the one-component calibration resulted in a decrease in T2water for all cohorts with increasing fat fractions (figure 5). With two-component calibration, the negative correlation between T2water and the fat fraction was reduced in cohort 1-3, and absent in cohort 4. Average T2water for HCs in each cohort was comparable between the one-component (27.4±1.0ms, 28.8±0.6ms, 28.7±1.1ms and 28.5±0.7ms, for cohort 1 until 4 respectively) and the two-component calibration (27.5±1.0ms, 29.2±0.6ms, 29.2±1.0ms and 29.2±0.7ms, for cohort 1 until 4 respectively). For the patients, T2water in the one-component calibration (19.6±4.7ms, 25.5±4.9ms, 26.6±3.4ms and 20.6±4.2ms, for cohort 1 until 4 respectively) was lower (p<0.001, paired t-test) than the two-component calibration (24.0±2.2ms, 28.8±3.9ms, 27.7±3.0ms and 27.1±3.4ms, for cohort 1 until 4 respectively).Discussion
Our simulations showed that not including flip angle profiles introduces an overestimation of the T2water of 10ms and an up to 20% underestimation of the fat fraction, which is in line with previous work in the brain.8,9 Ignoring slice profiles can result in wrongly estimated T2water values. Within the same study, this bias might not be an issue, however, when comparing between studies with different acquisition protocols this can result in wrong interpretation of the results. Since T2fat calibration can have a large influence on the estimation of T2water, it is important that the calibration is done accurately. Here we have shown that the calibrated T2fat cannot be translated between studies and between subjects. Assuming one general T2fat without specific calibration is therefore not recommended. We hypothesize that the T2fat differs between scanners and acquisition protocols due to J-coupling of fat protons that is sensitive to small deviations in B1 and fat composition.Conclusion
We recommend using an EPG based model for fitting T2water from the MSE signal with calibration of the T2fat assuming two components. Moreover, we recommend including the slice flip angle profile in the model with correction for chemical shift displacements. In vivo data showed a gradual decline in T2water for increasing fat fractions, which has important implications for clinical studies, especially in a multi-center setting, using T2water as an outcome parameter.Acknowledgements
No acknowledgement found.References
- Strijkers GJ, Araujo ECA, Azzabou N, et al. Exploration of New Contrasts, Targets, and MR Imaging and Spectroscopy Techniques for Neuromuscular Disease – A Workshop Report of Working Group 3 of the Biomedicine and Molecular Biosciences COST Action BM1304 MYO-MRI. J Neuromuscul Dis. 2019;6(1):1-30. doi:10.3233/JND-180333
- Carlier PG. Global T2 versus water T2 in NMR imaging of fatty infiltrated muscles: Different methodology, different information and different implications. Neuromuscul Disord. 2014;24(5):390-392. doi:10.1016/j.nmd.2014.02.009
- Dula AN, Gochberg DF, Does MD. Optimal echo spacing for multi-echo imaging measurements of Bi-exponential T2 relaxation. J Magn Reson. 2009;196(2):149-156. doi:10.1016/j.jmr.2008.11.002
- Azzabou N, Loureiro de Sousa P, Caldas E, Carlier PG. Validation of a generic approach to muscle water T2 determination at 3T in fat-infiltrated skeletal muscle. J Magn Reson Imaging. 2015;41(3):645-653. doi:10.1002/jmri.24613
- Mankodi A, Azzabou N, Bulea T, et al. Skeletal muscle water T2 as a biomarker of disease status and exercise effects in patients with Duchenne muscular dystrophy. Neuromuscul Disord. 2017;27(8):705-714. doi:10.1016/j.nmd.2017.04.008
- Weigel M. Extended phase graphs: dephasing, RF pulses, and echoes - pure and simple. J Magn Reson Imaging. 2015;41(2):266-295. doi:10.1002/jmri.24619
- Marty B, Baudin P-Y, Reyngoudt H, et al. Simultaneous muscle water T 2 and fat fraction mapping using transverse relaxometry with stimulated echo compensation. NMR Biomed. 2016;29(4):431-443. doi:10.1002/nbm.3459
- Lebel RM, Wilman AH. Transverse relaxometry with stimulated echo compensation. Magn Reson Med. 2010;64(4):1005-1014. doi:10.1002/mrm.22487
- McPhee KC, Wilman AH. Transverse relaxation and flip angle mapping: Evaluation of simultaneous and independent methods using multiple spin echoes. Magn Reson Med. 2017;77(5):2057-2065. doi:10.1002/mrm.26285
- THOMAS LW. The chemical composition of adipose tissue of man and mice. Q J Exp Physiol Cogn Med Sci. 1962;47:179-188. http://www.ncbi.nlm.nih.gov/pubmed/13920823. Accessed July 3, 2019.
Figures
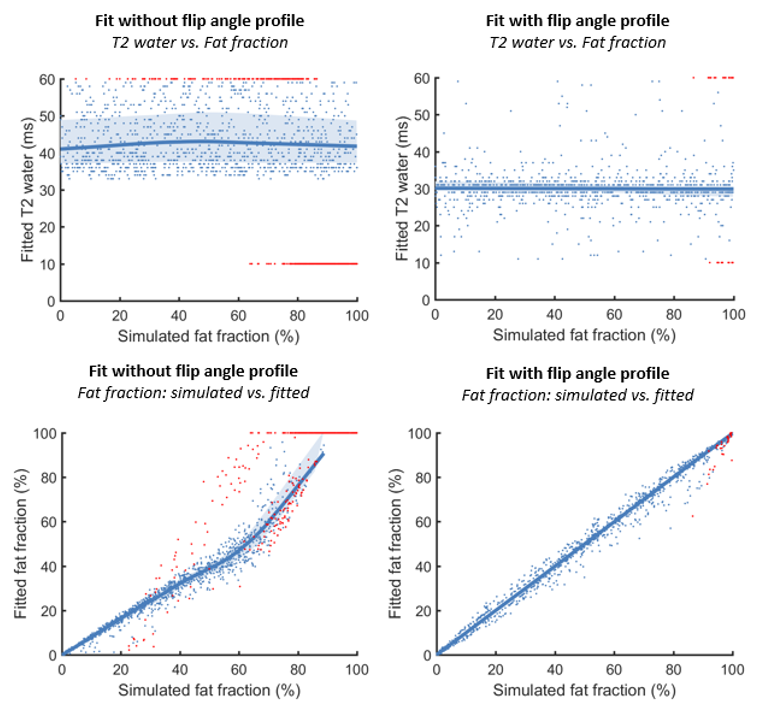
Figure 1: Simulation 1A shows the
relationship between the simulated FF and the fitted T2water for
simulation with incorporation of the flip angle profile (T2water:
median: 30ms [26ms – 35ms], out of bounds: 1.5%) and fitted without
incorporating the flip angle profile (top row) (T2water: median:
40ms [34ms – 57ms], out of bounds:30%). In the bottom row, the relation between
the simulated fat fraction and fitted fat fraction is shown with and without
flip angle profile.
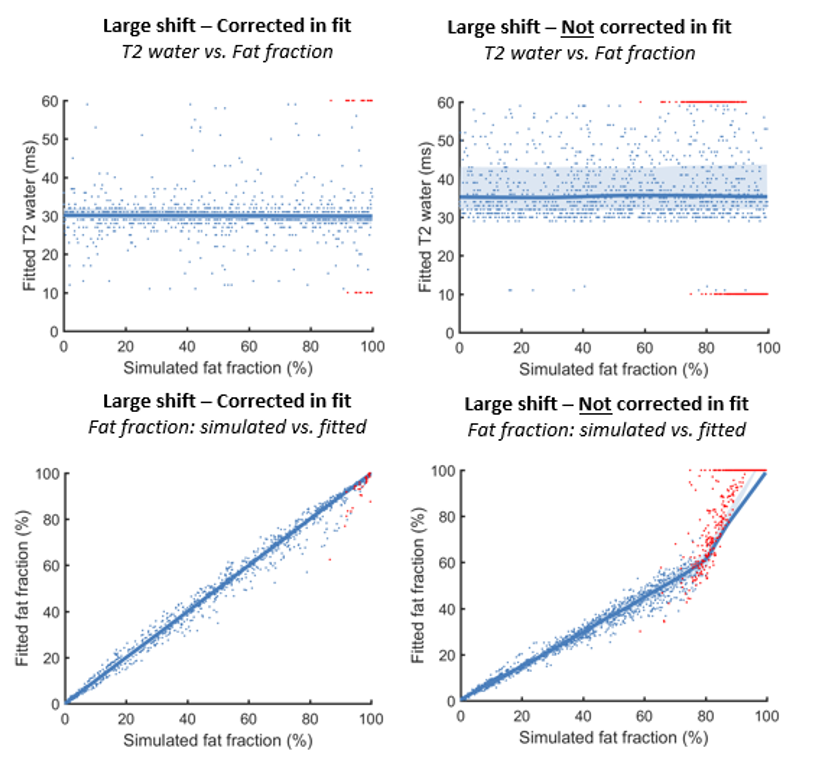
Figure 2: Simulation 1B shows the effect of simulating data with a large
chemical shift and fitting with or without incorporating the chemical shift.
The top row shows the relationship between the simulated FF and the fitted T2water
with (T2water: median: 30ms [26ms – 35ms], out of bounds: 1.5%) and without (T2water:
median: 34ms [30ms – 53ms], out of bounds: 22%) incorporation of the chemical
shift, and the bottom row shows the relationship between the simulated FF and fitted FF.
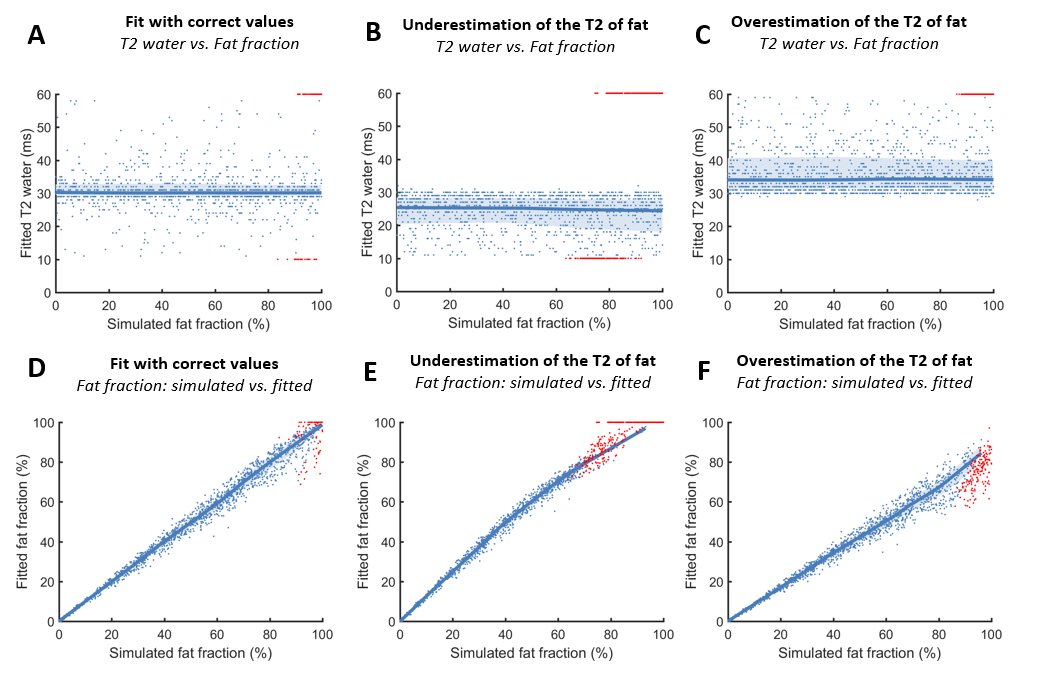
Figure 3: Simulation 2 shows the effect of fitting
simulated data with different assumed T2fat values. The top row shows
the T2water for assuming the correct T2fat (T2water:
median: 30ms [23ms – 38ms], out of bounds: 4%, fig. A), an underestimation of T2fat
(T2water: median: 26ms [14ms – 30ms], out of bounds: 26%, fig. B) and
an overestimation of T2fat (T2water: median: 33ms [30ms –
51ms], out of bounds: 9%, fig C.). Fig. D, E and F show the relationship
between the simulated FF and fitted FF.
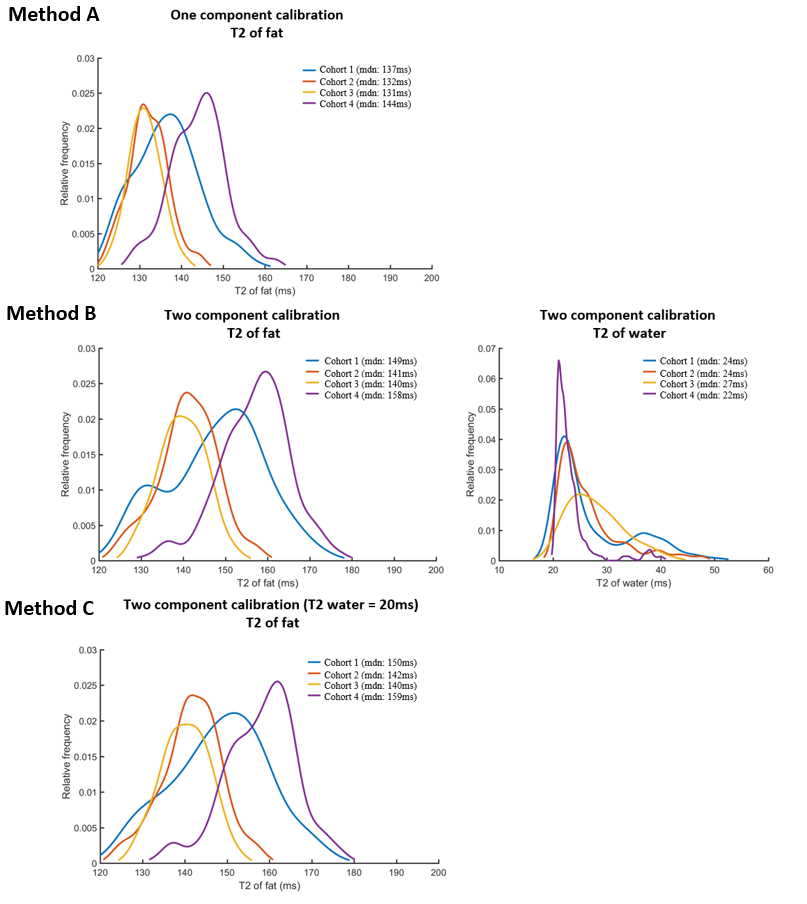
Figure 4: Outcome of
the calibration of the T2fat on subcutaneous fat for the methods A,
B and C. Method A with one component calibration leads to a lower T2fat
(137ms, 132ms, 131ms, 144ms, for cohort 1-4 respectively) than method B with two
component calibration (149ms, 141ms, 140ms, 158ms, for cohort 1-4 respectively).
The calibrated T2fat is comparable for method B without a fixed T2water
and method C with a fixed T2water (150ms, 142ms, 140ms, 159ms,
for cohort 1-4 respectively).
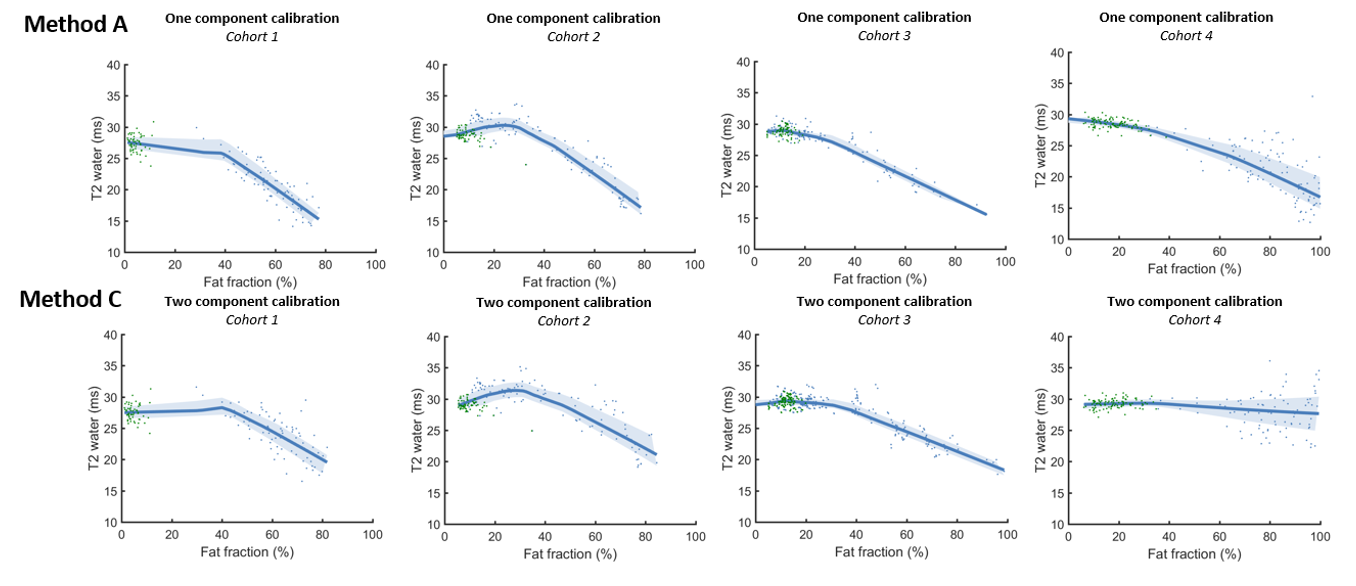
Figure 5: The
association between the fat fraction and the T2 of the water component in vivo in
four cohorts for the two calibration methods A and C. Healthy controls are
depicted in green and patients in blue.