0340
Water T1: a quantitative biomarker of disease activity in neuromuscular disorders1NMR Laboratory, Neuromuscular Investigation Center, Institute of Myology, Paris, France, 2NMR Laboratory, CEA/DRF/IBFJ/MIRCen, Paris, France, 3Consultants for Research in Imaging and Spectroscopy, Tournai, Belgium
Synopsis
Recently, MR fingerprinting with water and fat separation was proposed to quantify water T1 (T1H2O) in the muscles of patients with neuromuscular disorders. In this study, we investigated the sensitivity of T1H2O as a quantitative biomarker of disease activity, by comparing it with fat suppressed T2-weighted (FatSup-T2w) imaging and quantitative water T2 (T2H2O) mapping, in a dataset of 61 subjects with different NMDs. We observed a significant increase of T1H2O values in muscles with FatSup-T2w signal hyperintensities. We also investigated different hypothesis explaining the moderate correlation (ρ = 0.54) observed between T1H2O and T2H2O in the muscles of these patients.
INTRODUCTION
Intramuscular edema, inflammation and necrosis are different pathophysiological processes leading to intra- and/or extracellular water accumulation in muscles of patients with neuromuscular disorders (NMDs). These events, often referred to as “disease activity”, can be detected, sometimes before intramuscular fat infiltration begins, using muscle NMR imaging. Indeed, they are associated with hyperintense signals on fat suppressed T2 weighted (FatSup-T2w) images, which is currently part of the routine radiological examination performed in patients with suspected NMDs1. Because this qualitative approach has some limitations (i.e. a low sensitivity when the involvement is homogeneous, a high sensitivity to B1 inhomogeneities and to proton density), water T2 (T2H2O), as measured by multi spin echo (MSE) sequences, is considered as a reference biomarker of disease activity2, and is often used in longitudinal clinical trials. However, the long acquisition time of MSE sequences restricts T2H2O quantification to small volumes, which limits a more systematic use of this method. Recently, we have proposed MR fingerprinting with water and fat separation (MRF T1-FF) to quantify water T1 (T1H2O) in the skeletal muscles of NMD patients3. This acquisition is fast, and could potentially tackle the limitations of MSE sequences. Because T1H2O is tightly linked to water mobility, its value also increases when water accumulates in the intra or extracellular compartments. Here, we investigated the sensitivity of T1H2O as a quantitative imaging biomarker of disease activity, by comparing it with qualitative FatSup-T2w and quantitative T2H2O mapping, in a large dataset of patients with different NMDs.METHODS
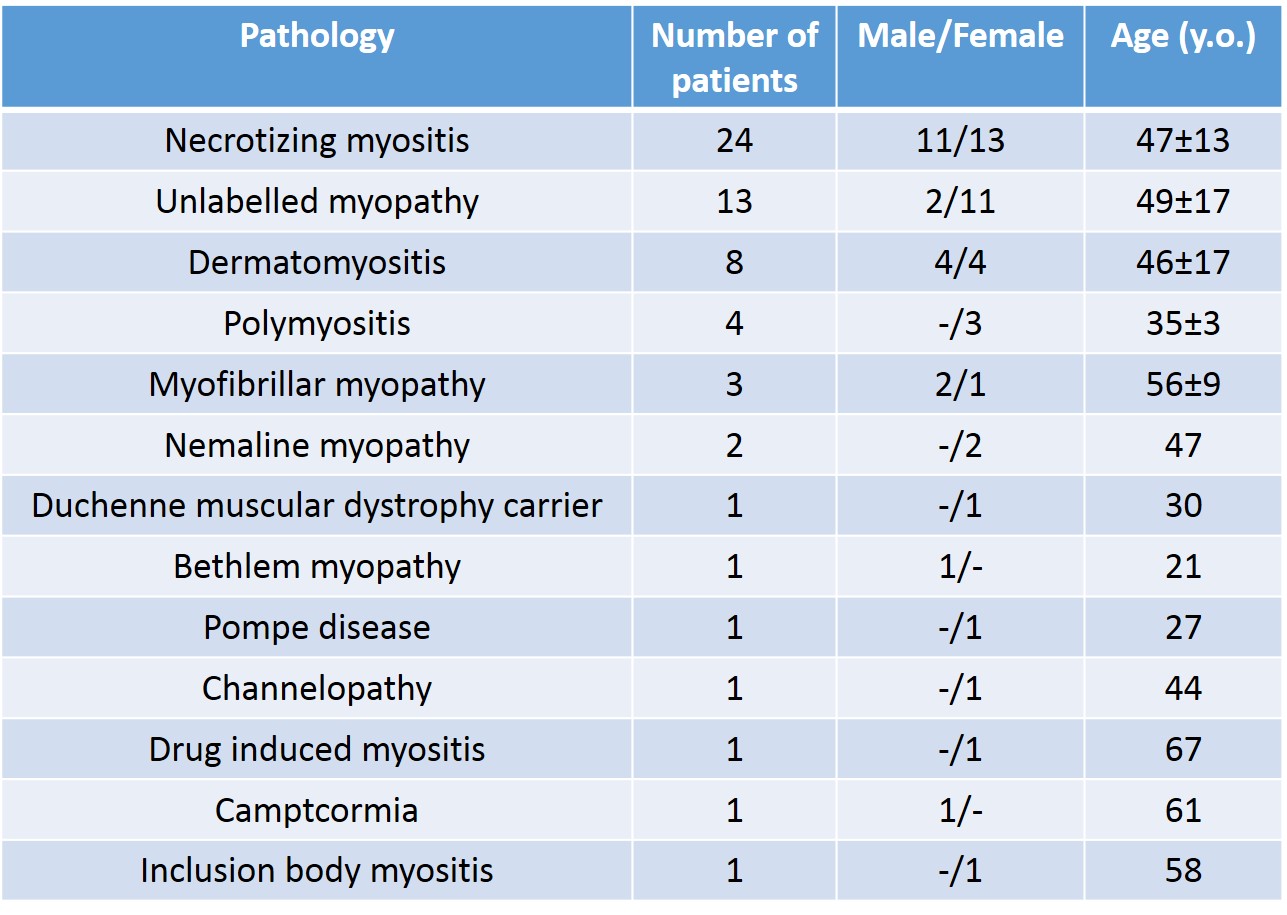
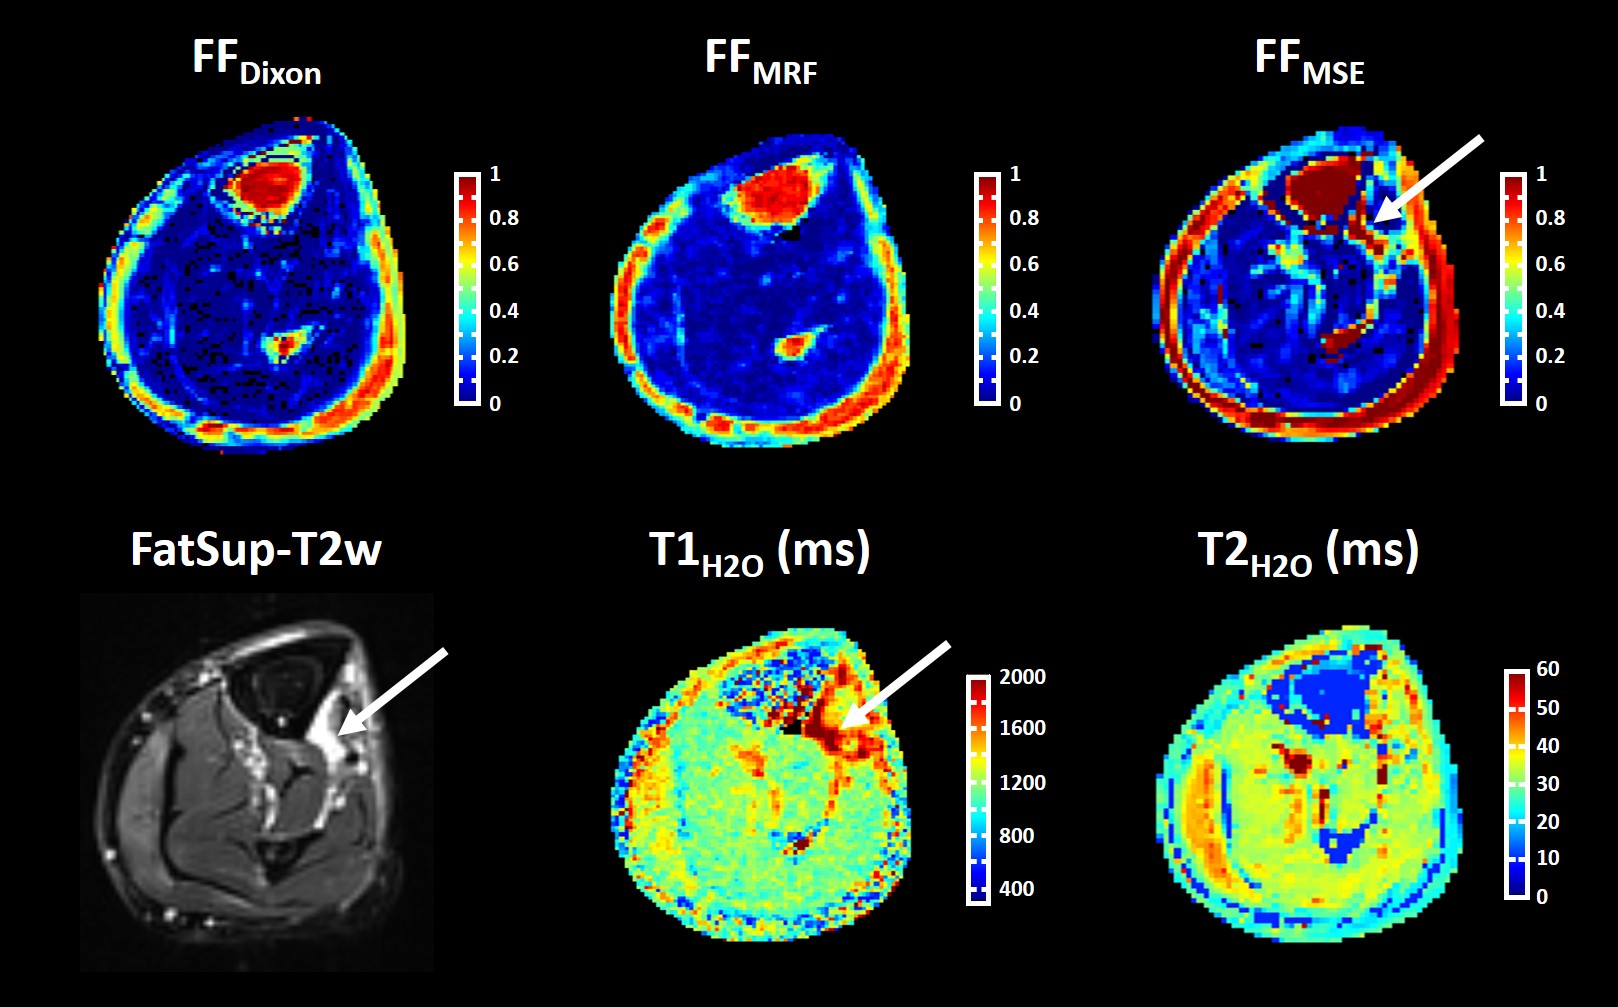
We scanned the legs of 61 patients with different NMDs (Figure 1) at 3T (PrismaFit, Siemens). The MRF T1-FF sequence was acquired with the following parameters: 1400 spokes, varying TE, TR and FA, 5 slices, Tacq = 10s/slice3. A bi-component fitting was applied to generate T1H2O and fat fraction (FFMRF) maps. A MSE sequence was acquired (17 echoes from 9.5 ms to 165.5 ms) from which T2H2O and FF (FFMSE) maps were obtained by fitting the signal decay with a bi-component EPG model4. Reference FF were obtained using a 3-pt Dixon sequence (FFDixon). Finally, a FatSup-T2w (short tau inversion recovery, TI = 220ms) Turbo Spin Echo was acquired with the following parameters: TE/TR = 47/3100ms. For each muscle, the mean T2H2O, T1H2O and different FF values (FFMRF, FFMSE and FFDixon) were measured and a binary score was attributed based on the presence of hyperintense signals on FatSup-T2w images (0: no hyperintensity, 1: presence of hyperintensities).RESULTS
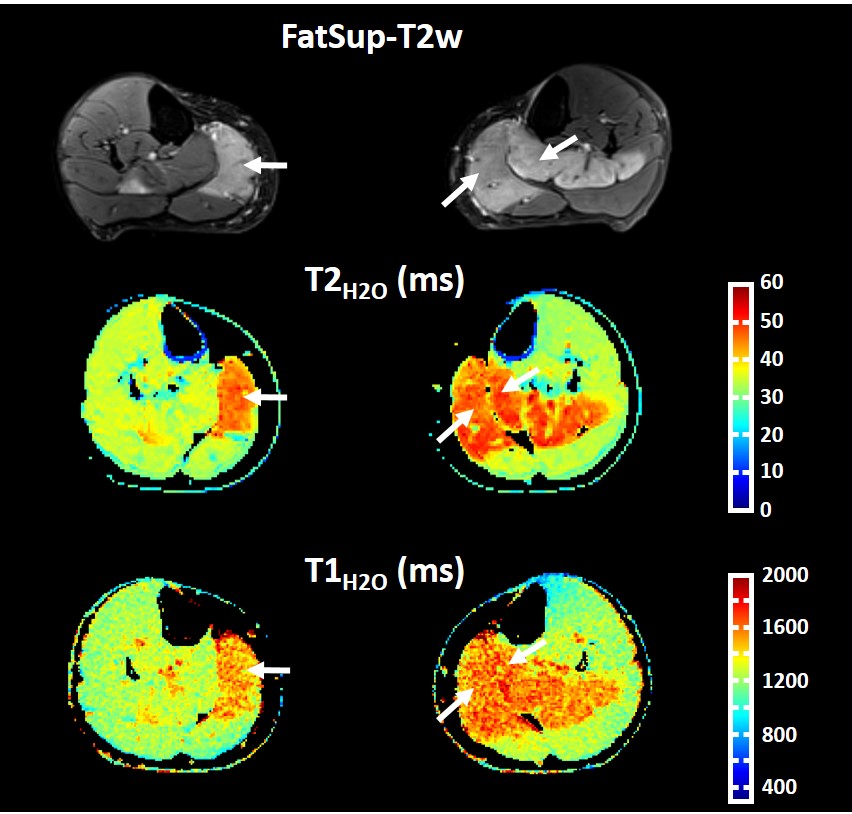
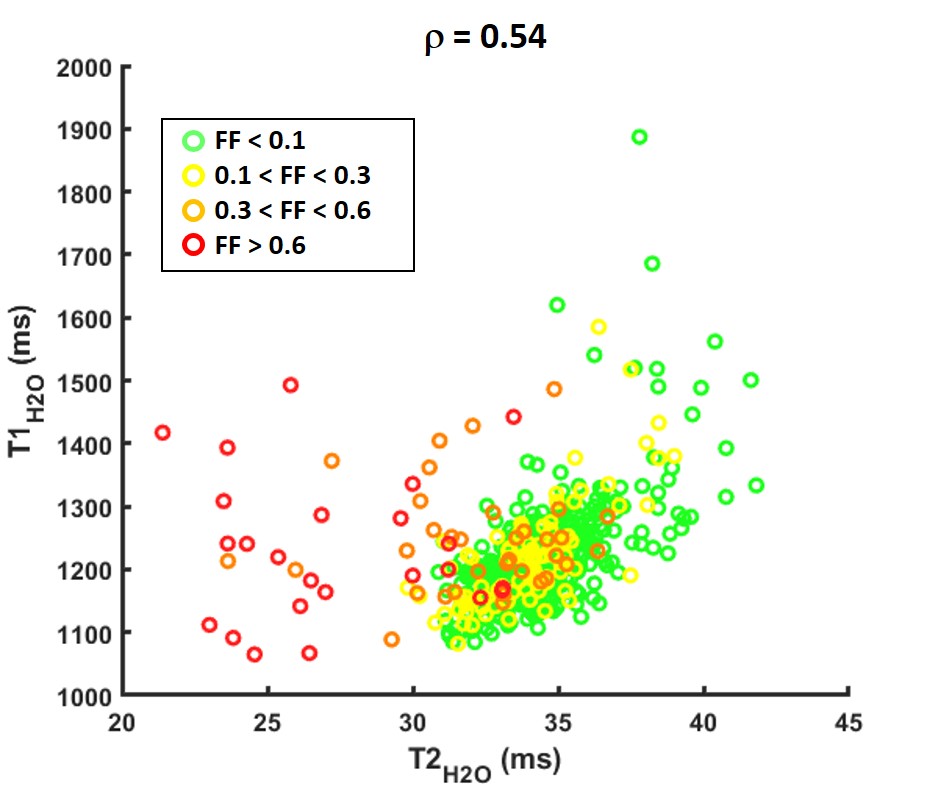
Figure 2 represents FatSup-T2w images, T2H2O and T1H2O maps obtained on a 36 year-old woman with necrotizing myositis. Hyperintense signals were detected on the FatSup-T2w images in the right and left gastrocnemius and in the left soleus muscles. These regions also had increased T2H2O and T1H2O values.For the entire patient group, we found a moderate correlation between T1H2O and T2H2O values (ρ = 0.54, p<0.001, Figure 3). Muscles were gathered in 4 groups according to their FFDixon values (Group 1: FFDixon < 0.1; Group 2: 0.1 < FFDixon < 0.3; Group 3: 0.3 < FFDixon < 0.6; Group 4: FFDixon > 0.6). The correlation level between T1H2O and T2H2O highly depended on FFDixon (ρ = 0.63, ρ = 0.68, ρ = 0.07 and ρ = -0.01 for Group 1, 2, 3 and 4, respectively).
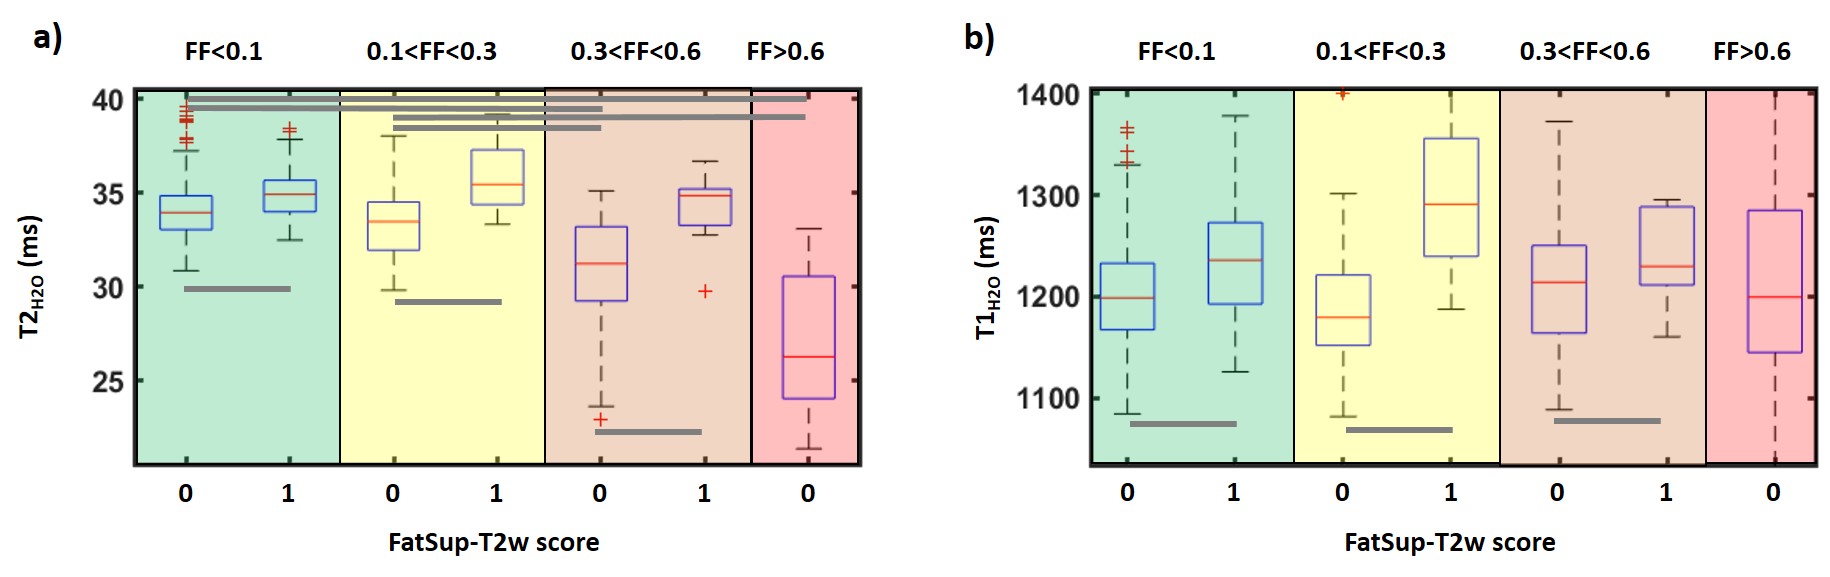
Over the 708 muscles assessed on the FatSup-T2w images, 119 had a FatSup-T2w score of 1. T1H2O and T2H2O values were significantly higher in the muscles with a FatSup-T2w score of 1 than in other muscles (T1H2O = 1296±122 ms VS 1202±57 ms and T2H2O = 35.7±2.3 ms VS 33.6±2.3 ms, p < 0.001). These difference were also observed within the different fat fraction groups (Figure 4). T2H2O in muscles with a FatSup-T2w score of 0 were significantly lower in Groups 3 and 4 than in groups 1 and 2 (p<0.05).
For some subjects, high T1H2O values were observed in muscles with normal (or slightly increased) T2H2O and low FF (< 0.3). These regions were typically characterized by strong hyperintensities on FatSup-T2w images and artificially overestimated FFMSE values compared to FFDixon and FFMRF (Figure 5).
DISCUSSION AND CONCLUSION
In this study, we quantified T1H2O and T2H2O in a broad population of patients with NMDs. We compared the quantitative information provided by these two methods to the standard semi-quantitative FatSup T2w approach to detect disease activity. We observed a significant increase of T1H2O and T2H2O values in muscles with FatSup-T2w signal hyperintensities. Contrary to T1H2O, T2H2O globally decreased at high FF, which partly explains the poor correlation between both variables in some muscles. Also, the T2 approach, which separates water and fat components based on their T2 values, can be biased in some situations and misclassify a fluid collection as fatty tissue. In conclusion, we showed that T1H2O can be considered as a robust quantitative biomarker of disease activity in patients with NMDs. The MRF T1-FF sequence, with its short acquisition time, is compatible with clinical research and could be performed on large patient cohorts to further investigate the role of T1H2O for monitoring these pathological processes in NMD patients.Acknowledgements
No acknowledgement found.References
1- Wattjes et al., Eur Radiol (2010); 20: 2447-2460.
2- Carlier et al., J Neuromuscul Dis (2016); 3: 1-28.
3- Marty et al., Magn Reson Med (2019); doi: 10.1002/mrm.27960.
4- Marty et al., NMR Biomed. (2016); 29(4):431-43.
Figures