0339
T1, T2, and T1ρ Relaxation Mapping of the Lower Leg Muscle in Diabetic Neuropathy Patients with MR-Fingerprinting (MRF): Exercise Intervention1Radiology, NYU Langone Health, New York, NY, United States, 2Physical Therapy, New York University, New York, NY, United States
Synopsis
Diabetic peripheral neuropathy (DPN) is characterized by metabolic and microvascular impairment (1) that damage peripheral nerves (2) and cause ischemic conditions and muscle degeneration in the lower extremities (3). Researchers have investigated the possibility of reversing DPN symptoms through exercise therapy (4). Such studies will benefit from quantitative biomarkers to evaluate therapeutic strategies targeting muscle function. In this work, we developed a magnetic resonance fingerprinting (MRF) technique that is insensitive to B1 imperfections for simultaneous T1, T2, and T1ρ relaxation mapping of skeletal muscle in DPN patients in response to exercise intervention at 3T.
Purpose
To develop a novel MR-fingerprinting pulse sequence technique that is insensitive to B1 and B0 imperfections for simultaneous T1, T2, and T1ρ relaxation mapping with radial volumetric encoding and to evaluate the multi-parametric mapping of lower leg skeletal muscle in healthy controls and patients with diabetic peripheral neuropathy (DPN).Methods
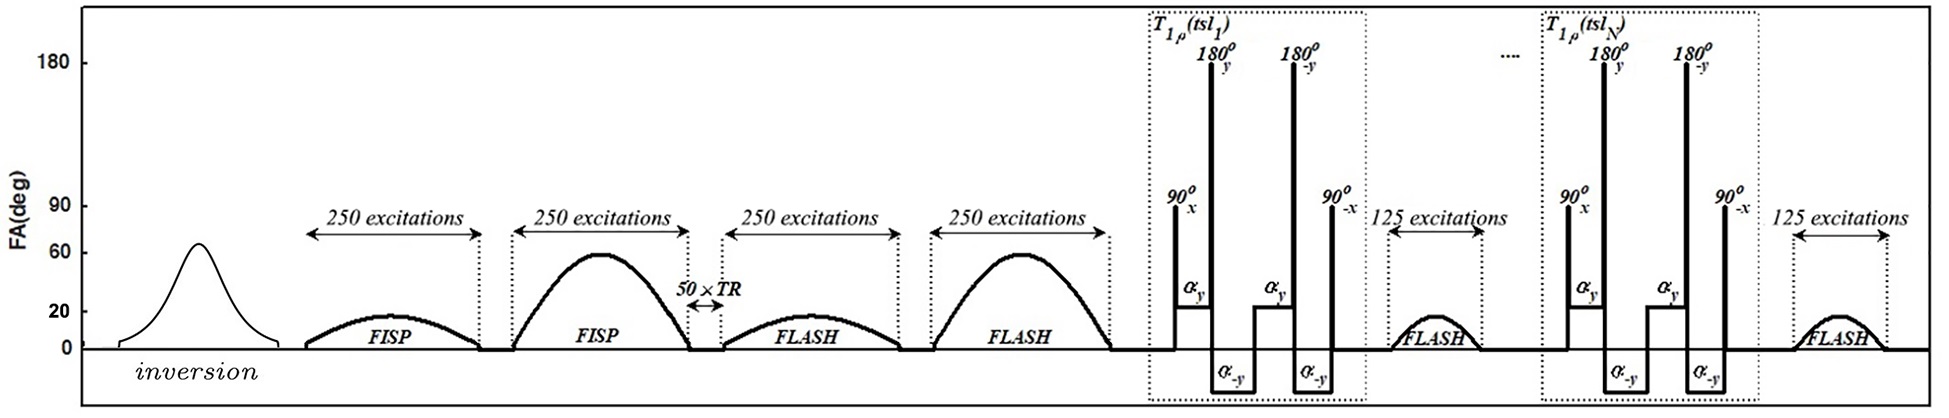
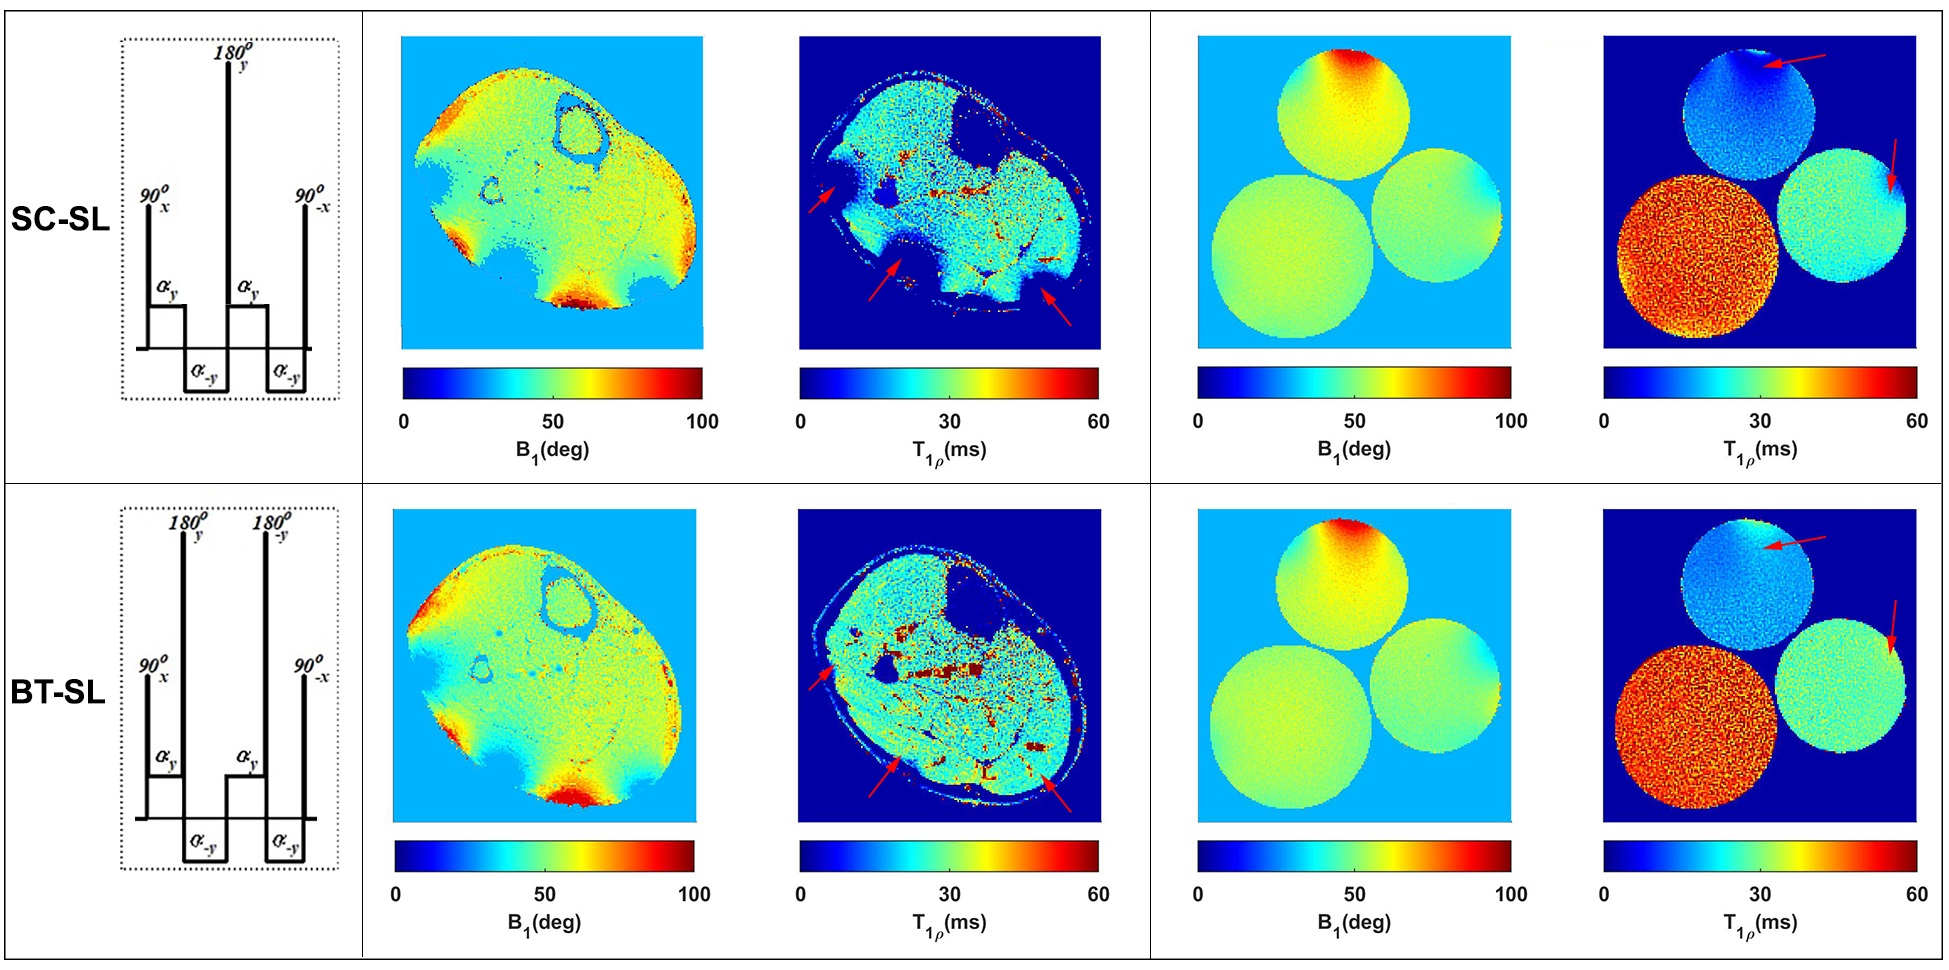
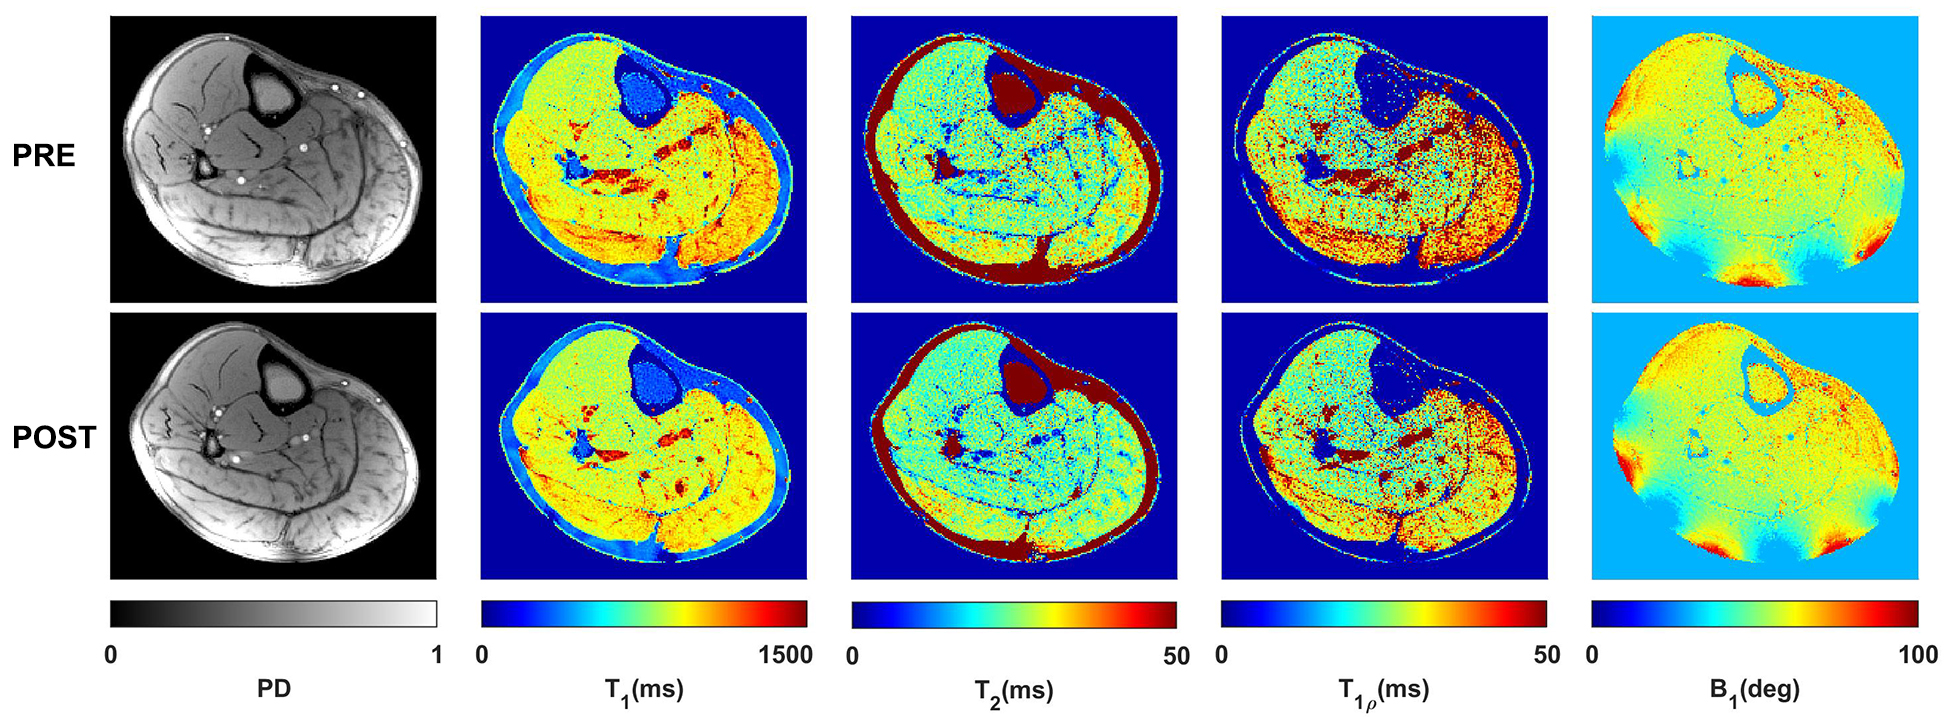
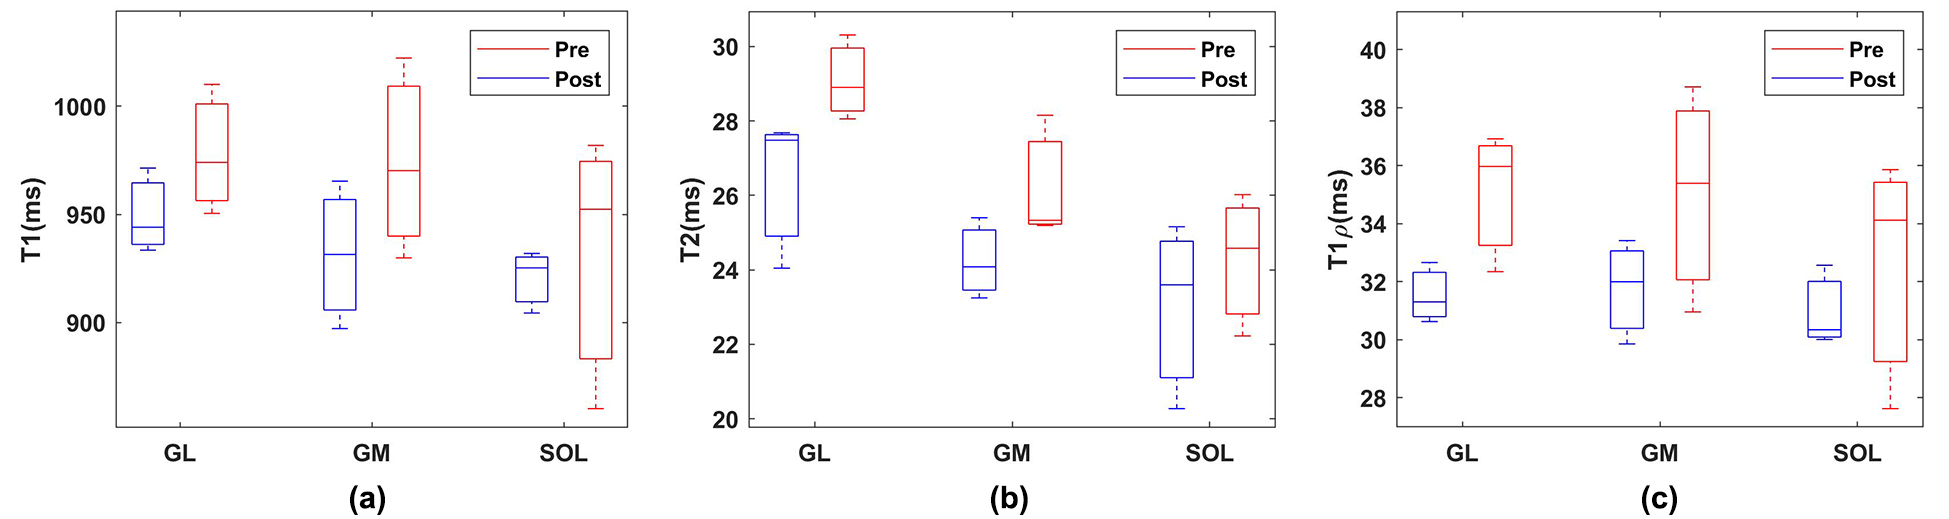
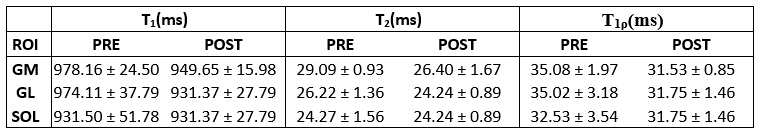
We developed an MRF-sequence, based on the method described in (5), to estimate, T1, T2, and T1ρ in less than five minutes. Similar to a previous design (5), the proposed MRF-sequence started with an adiabatic inversion pulse followed by two fast imaging with steady‐state precession (FISP) segments, which predominantly encode T1/T2, and two fast low‐angle shot (FLASH) segments, which encode T1 and B1+ (Figure 1). Each segment contains 250 radiofrequency (RF) excitations with a time-bandwidth product of three. There was a delay equal to 50 repetition times (TRs) between segments for partial recovery of the magnetization and enhancing T1 encoding. The peak flip angle for this part was 60°(3). To encode the T1ρ, totally balanced spin-lock preparation modules (TB-SL) (6) with different spin-lock duration (tsl = 2, 3.75, 7, 13, 24, 45ms) were added at the end of the train. Each of the preparation modules was followed by a FLASH segment with 125-RF excitations. The peak flip angle for the T1ρ train was 20° (Figure 1). To show the robustness to B1 imperfections, we compared it with a sequence that uses paired self-compensated spin-lock preparation modules (SC-SL) (7). B1 insensitivity was important because our application called for a custom-built dual-tuned 1H/31P- 8-channel knee coil that utilized degenerate mode transmit/receive birdcages, which are inhomogeneous in the periphery. The scans were performed on 3T MRI scanner (MAGNETOM Prisma, Siemens Healthcare GmbH, Germany) using a model agar gel phantoms including 3 %, 4%, and 8% agar samples. Afterward, IRB-approved MRF imaging was performed on three DPN patients (age = 57, 70, and 70 years) (8). The DPN patients were scanned before and after participating in a 30-visit 10 weeks of supervised exercise intervention program that consisted of supervised aerobic and weight training over a 10-week period. Four axial images of the calf muscle were acquired with FOV = 140×140mm2, 0.6×0.6mm2 in-plane resolution, 4.0mm slice thickness, 224×224 matrix size, TE/TR = 3.5/7.5ms, BW = 420Hz/pixel, number of shots = 4, spin-lock power fsl = 500Hz. The acquisition time was 4:45min. The mean and standard deviation for each parameter was measured in soleus (SOL), gastrocnemius medialis (GM), and gastrocnemius lateralis (GL) muscles and compared between pre- and post-exercise scans.Results
Figure 2 shows the robustness of the totally balanced (TB-SL) spin-lock module to the B1 in comparison with the standard SC-SL module for model agar phantoms and in-vivo experiments. Figures 3 show the representative T1, T2, T1ρ, and B1 maps of the in-vivo lower leg muscle scans of DPN patients’ pre and post-exercise intervention using the TB-SL sequence. The summary of each parameter in each ROIs pre and post-exercise is shown in Table 1. A boxplot comparison between pre- and post-exercise measurements showed a decrease in the relaxation parameters, which suggest improvement in muscle quality as a result of the exercise-intervention.Discussion and Conclusion
Individuals with long-standing diabetes are at high risk for wide-ranging musculoskeletal complications such as pain, plantar ulcers, Charcot arthropathy, and amputations. Effective interventions are essential to evaluate and reverse musculoskeletal complications in T2DM. Specifically, supervised exercise intervention improves glycemic control, reduces inflammation, and improves muscle strength and quality. In this work, we implemented an MRF-sequence and showed the feasibility of rapid simultaneous acquisition of accurate PD, T1, T2, and T1ρ maps of the lower leg muscle in DPN patients. The proposed MRF method is fast and robust to B0/B1 inhomogeneity. The proposed multi-parametric parameters (T1, T2, and T1ρ) are able to discriminate the diabetic patients before and after 10-weeks of supervised exercise intervention. Further recruitment to achieve reliable statistics is warranted.Acknowledgements
This work was supported by National Institutes of Health grants R01DK106292 and R01DK114428 and was performed under the rubric of the Center for Advanced Imaging Innovation and Research (CAI2R, www.cai2r.net) at the New York University School of Medicine, which is an NIBIB Biomedical Technology Resource Center (NIH P41 EB017183).References
1. Tesfaye S, Boulton AJ, Dickenson AH. Mechanisms and management of diabetic painful distal symmetrical polyneuropathy. Diabetes care 2013;36(9):2456- 2465.
2. Boulton AJ, Vinik AI, Arezzo JC, Bril V, Feldman EL, Freeman R, Malik RA, Maser RE, Sosenko JM, Ziegler D, American Diabetes A. Diabetic neuropathies: a statement by the American Diabetes Association. Diabetes care 2005;28(4):956-962.
3. Allen MD, Major B, Kimpinski K, Doherty TJ, Rice CL. Skeletal muscle morphology and contractile function in relation to muscle denervation in diabetic neuropathy. Journal of applied physiology 2014;116(5):545-552.
4. Kluding PM, Bareiss SK, Hastings M, Marcus RL, Sinacore DR, Mueller MJ. Physical Training and Activity in People With Diabetic Peripheral Neuropathy: Paradigm Shift. Physical therapy 2017;97(1):31-43.
5. Cloos MA, Assländer J, Abbas B, Fishbaugh J, Babb JS, Gerig G, Lattanzi R: Rapid Radial T1 and T2 Mapping of the Hip Articular Cartilage With Magnetic Resonance Fingerprinting. J Magn Reson Imaging 2019; 50:810–815.
6. Gram M, Gensler D, Xu A, Nordbeck P, Bauer WR, Jakob PM, Seethaler M: A totally balanced spin lock preparation module for accurate and artifact-free T1ρ-mapping. ISMRM 27th Annual Meeting, Montreal, CA
7. Mitrea BG, Krafft AJ, Song R, Loeffler RB, Hillenbrand CM: Paired self-compensated spin-lock preparation for improved T1ρ quantification. J Magn Reson 2016; 268:49–57.
8. Brown R., Khegai O, Parasoglou M. Magnetic Resonance Imaging of Phosphocreatine and Determination of BOLD Kinetics in the Lower Extremities with a Dual-Frequency Coil Array, Scientific Reports, 2016; 6: 30568.
Figures