0338
Evaluation of liver function by using Hepatocyte fraction of Gd-EOB-DTPA-Enhanced MRI based on MELD score1Third Affiliated Hospital of Nantong University & Nantong Third People's Hospital, Nan Tong, China, 2Philips Healthcare Shanghai, China, Shang Hai, China
Synopsis
The purpose of this study was to identify whether hepatocyte fraction that based on Gadoxetic Acid–enhanced MRI is useful for the assessment of liver function. Firstly, T1 mapping imaging was performed before and 20 minutes after Gd-EOB-DTPA administration, The following parameters are then obtained from the images: pre- and postcontrast T1 values of the liver (T1pre and T1post), increase in the T1 relaxation rate (Δ R1), rate of the decrease of the T1 relaxation time (Δ T1), hepatocyte fraction (HeF), and uptake coefficient (K). Our study showed that hepatocyte fraction can be used to evaluate the liver function of patients with hepatitis B cirrhosis, K value has high diagnostic efficiency.
Introduction
Preoperative assessment of liver function is of great significance for Patients with liver cancer ready for surgical treatment[1-2]. At present, the most commonly used method for evaluating liver reserve function is Child-pugh score. Compared with the Child-Pugh score, the MELD score not only has more objective parameters and less measurement error, but also reflects the development and changes of the disease more sensitively because of the special performance of its continuous variables [3]. Therefore, the patients were divided into groups by MELD score. Hepatocyte fraction is a new evaluation tool that can be used to obtain the hepatocyte uptake of contrast agents using T1 mapping sequences and double intergenerational models to evaluate liver function [4]. The purpose of this study was To identify whether hepatocyte fraction that based on Gadoxetic Acid–enhanced MRI is useful for the assessment of liver function.Objectives
To identify whether hepatocyte fraction that based on Gadoxetic Acid–enhanced MRI is useful for the assessment of liver function.Methods
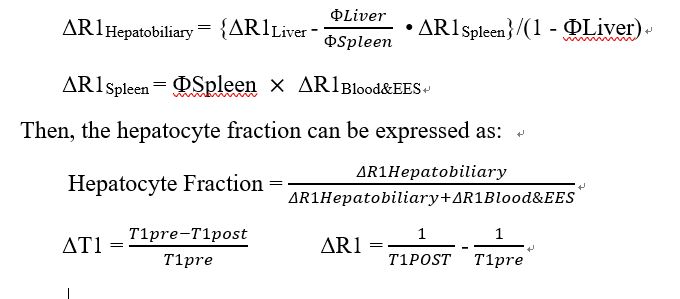
61 patients with MELD score≤10 and 21 patients with MELD score>10 were enrolled, and Gd-EOB-DTPA-enhanced MRI was applied. T1mapping imaging was performed in before and 20 minutes after Gd-EOB-DTPA administration. The following parameters were compared by independent-samples T test: pre- and postcontrast T1 values of the liver(T1pre and T1post), the increase of T1 relaxation rate (Δ R1), the decrease rate of T1 relaxation time (Δ T1), hepatocyte fraction (HeF), and uptake coefficient (K value). Pearson Correlation Coefficient was used to analyze the correlation between the parameters and MELD score.The receiver operating characteristic curve was used to evaluate the effectiveness of each parameter in differentiating MELD score≤10 group from MELD score>10 group, and the area under the ROC curve was compared by the Z test. The essential predictive factors of MELD score > 10 were obtained by regression analysis. The parameters of Δ R1, Δ T1, HeF and K are calculated using the following formula(Fig. 1).Results
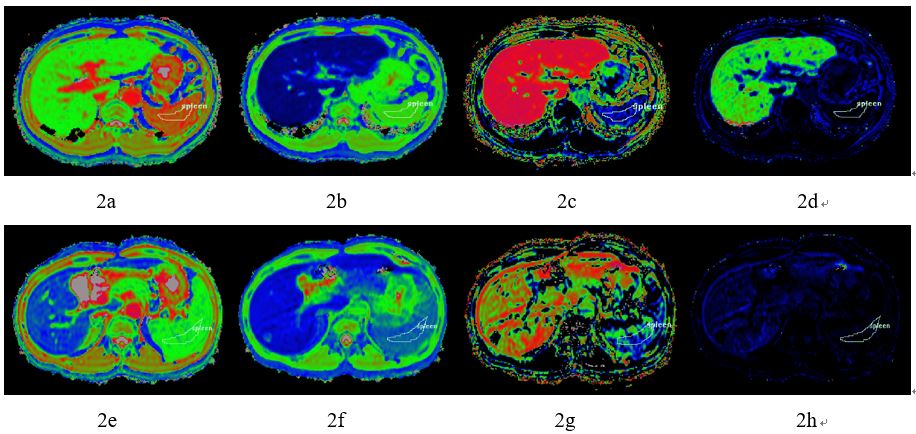
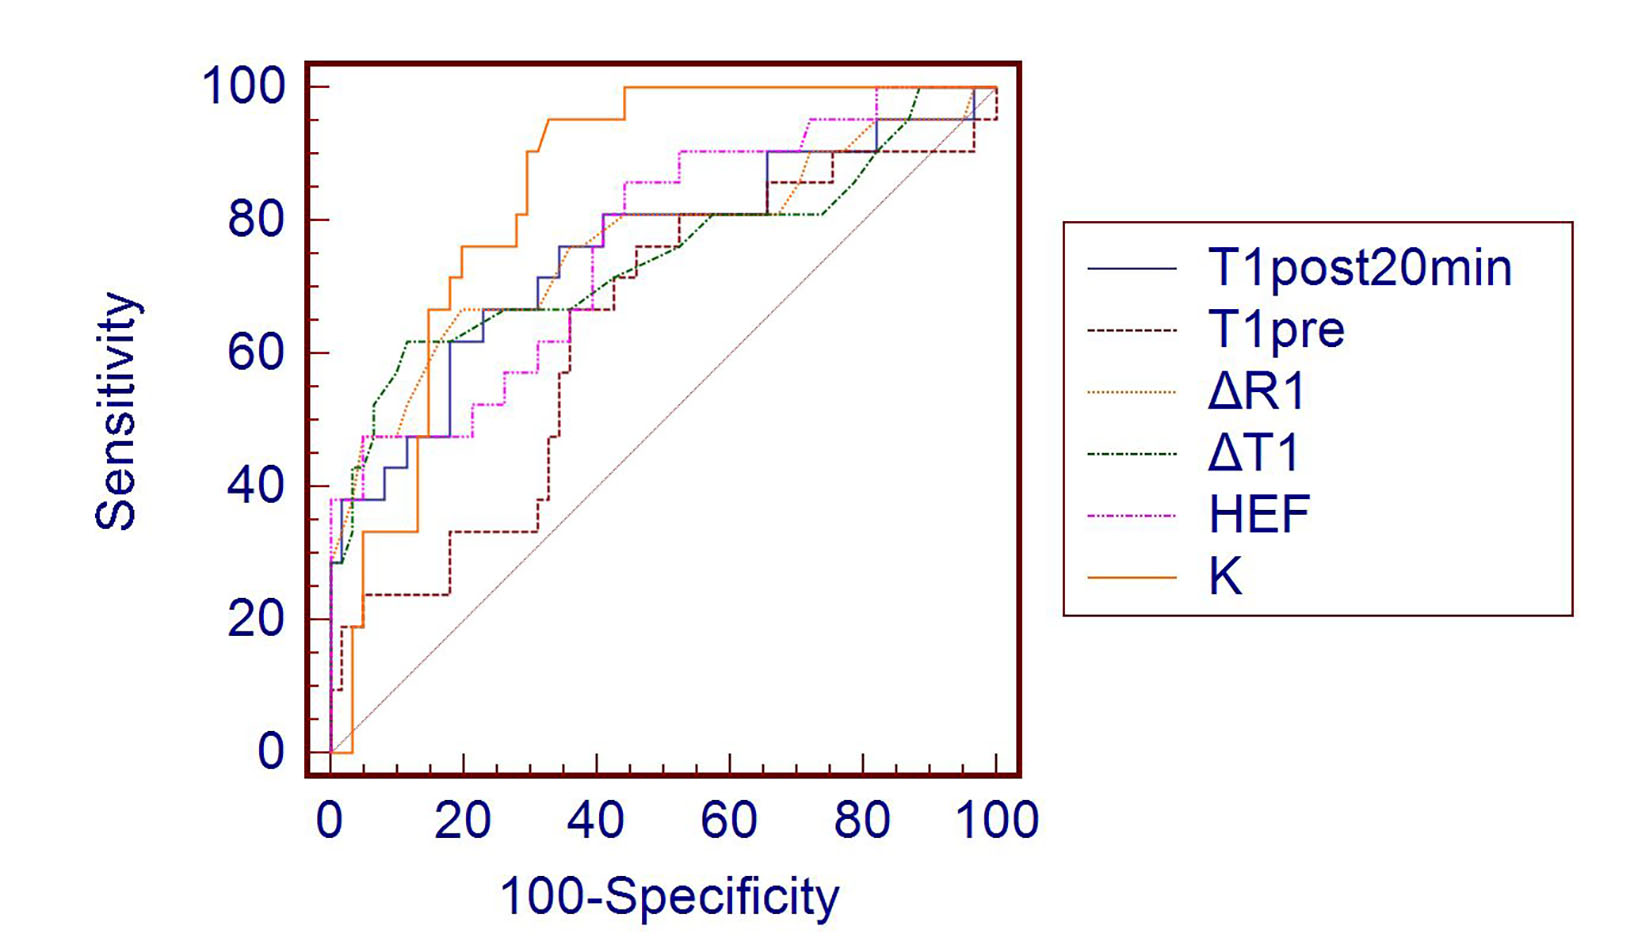
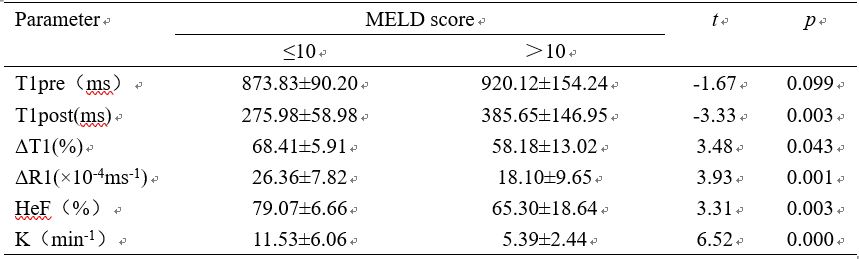
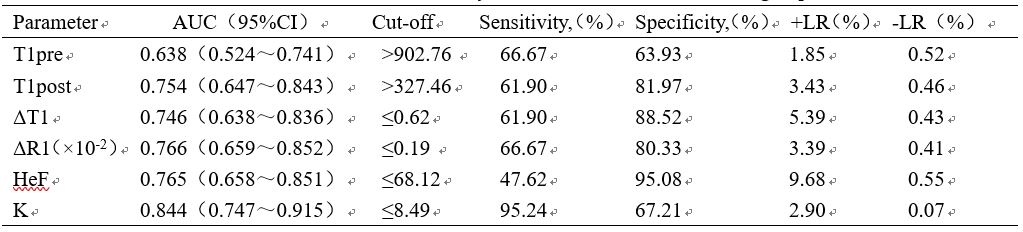
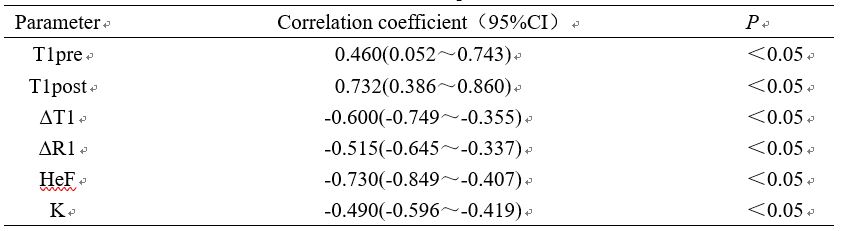
The values of HeF, K, Δ T1, and Δ R1 decreased with the increase of liver function damage, while the values of T1post and T1pre increased with the increase of liver function damage(Fig. 2, Table 1). Except for T1pre, there were significant differences in all parameters between the groups with MELD score ≤ 10 and > 10 (P< 0 05). The area under ROC curve of different liver function groups evaluated by HeF, K value, T1pre, T1post, Δ T1 and Δ R1 were 0.765, 0.844,0.638,0.754, 0.746 and 0.766 respectively(Fig. 3, Table 2). T1pre and T1post were positively correlated with MELD score (r = 0.460 and 0.732, P < 0.05), while Δ T1, Δ R1, HeF and K were negatively correlated with MELD score (r =-0.600, -0.515, -0.730 and -0.490, respectively, P < 0.05, Table 3). Regression analysis showed that K was an important predictive factor for MELD score >10.Discussion
The purpose of this study was to provide a non-invasive method for evaluating liver function. The results showed that the values of HEF, K, Δ T1, and Δ R1 decreased with the increase in the degree of liver function damage, while the values of T1post and T1pre increased with the increase in the degree of liver function damage. This phenomenon may be due to the downregulation of organic anion-transporting polypeptides and the increased expression of multidrug–resistant proteins caused by hepatitis and cirrhosis, resulting in the decrease in Gd-EOB-DTPA uptake and increase in Gd-EOB-DTPA excretion by hepatocytes [5]. In this study, it was found that there were significant differences in MELD scores ≤ 10 and > 10 groups except T1pre. Therefore, some problems still exist in using plain T1 relaxation time to evaluate liver function.It was found that T1pre and T1post were positively correlated with MELD score, Δ T1, Δ R1, HeF and K were negatively correlated with MELD score, and the area under the ROC curve of K value was the largest. Regression analysis showed that K value was an important predictor of MELD score > 10.This observation can be accounted for by a dual compartment model: the hepatocyte fraction removes the effect of the contrast agent in the extracellular space, whereas T1post, ΔT1, and ΔR1 are simultaneously affected by contrast agents in the intracellular and extracellular spaces [4].Conclusion
Hepatocyte fraction can be used to evaluate the liver function of patients with hepatitis B cirrhosis, K value has high diagnostic efficiency.Acknowledgements
References
1. Schreckenbach T, Liese J, Bechstein WO, et al. Posthepatectomy liver failure[J]. Dig Surg, 2012,29(1):79-85.
2. Rahbari NN, Garden OJ, Padbury R, et al. Posthepatectomy liver failure: a definition and grading by the International Study Group of Liver Surgery (ISGLS)[J]. Surgery, 2011,149(5):713-724.
3. Wang YY, Zhao XH, Ma L, et al. Comparison of the ability of Child-Pugh score, MELD score, and ICG-R15 to assess preoperative hepatic functional reserve in patients with hepatocellular carcinoma[J]. J Surg Oncol, 2018,118(3):440-445.
4. Dahlqvist Leinhard O, Dahlström N, Kihlberg J, et al. Quantifying differences in hepatic uptake of the liver specific contrast agents Gd-EOB-DTPA and Gd-BOPTA: a pilot study[J]. Eur Radiol, 2012,22(3):642-653.
5. Tsuda N, Harada K, Matsui O. Effect of change in transporter expression on gadolinium-ethoxybenzyl-diethylenetriamine pentaacetic acid-enhanced magnetic resonance imaging during hepatocarcinogenesis in rats[J]. J Gastroenterol Hepatol, 2011,26(3):568-576.
Figures