0336
A study of sensitivity of quantitative MRI measurements to the presence of iron in the liver
Yurui Qian1, Jian Hou1, Yixiang Wang1, Vincent Wong2, Queenie Chan3, Weibo Chen4, Min Deng1, Franklin Au1, Anthony Chan5, Winnie Chu1, and Weitian Chen1
1Department of Imaging and Interventional Radiology, Chinese University of Hong Kong, Hong Kong, Hong Kong, 2Department of Medicine & Therapeutics, Chinese University of Hong Kong, Hong Kong, Hong Kong, 3Philips Healthcare, Hong Kong, Hong Kong, 4Philips Healthcare, Shanghai, China, 5Department of Anatomical and Cellular Pathology, Chinese University of Hong Kong, Hong Kong, Hong Kong
1Department of Imaging and Interventional Radiology, Chinese University of Hong Kong, Hong Kong, Hong Kong, 2Department of Medicine & Therapeutics, Chinese University of Hong Kong, Hong Kong, Hong Kong, 3Philips Healthcare, Hong Kong, Hong Kong, 4Philips Healthcare, Shanghai, China, 5Department of Anatomical and Cellular Pathology, Chinese University of Hong Kong, Hong Kong, Hong Kong
Synopsis
MRI is widely used as a non-invasive method to diagnose and monitor liver diseases. For certain quantitative MRI techniques, liver iron content may affect the measurement. In this work, we investigated the influence of liver iron content on several quantitative MRI methods, including macromolecular proton fraction, T1rho and intravoxel incoherent motion.
Introduction
Imaging methods are increasingly used in the diagnosis of liver fibrosis(1-3). However, it remains challenging to use these methods to detect liver fibrosis at an early stage. Several quantitative MRI methods have been reported for early diagnosis of liver fibrosis, including quantitative T1rho imaging4, intravoxel incoherent motion (IVIM)5,6, and quantitative macromolecular proton fraction (MPF) imaging7. To make a reliable diagnosis, the imaging measurement should be specific to liver fibrosis and not influenced by the other confounding factors, such as hepatic iron. In this study, we investigated and compared the sensitivity of these quantitative MRI to the presence of hepatic iron.Methods
The study was conducted under the approval of the institutional review board. Patients attending the hepatology clinics of our institute were screened and referred to receive MRI exams. All MRI scans were conducted using a 3.0 T MRI scanner (Philips Achieva, Philips Healthcare, Best, Netherlands). A 32 channel cardiac coil (Invivo Corp, Gainesville, USA) was used as the receiver and the body coil was used as the RF transmitter. Quantitative T1rho imaging, IVIM, and quantitative MPF imaging were conducted. Table 1 shows the age, gender, and population of the patients who have received these MRI exams. The liver iron content (LIC) of all these subjects were measured by the gradient echo (GRE) imaging approach and the MRQuantif post-processing software (Version:2019.5.12) described in8. The imaging parameters for GRE sequence include: TR/TE 120/1.2ms, flip angle 20°, and fat saturation. T1rho imaging was acquired using the pulse sequence described in9. The imaging parameters include: resolution 1.5 mm×1.5 mm, slice thickness 7 mm, TR/TE 2000/20ms, and time-of-spinlock (TSL) 0, 10, 30, 50ms. Two data sets with the frequency of spin-lock (FSL) 300Hz and 400Hz, respectively, were acquired. Each single slide data sets were acquired within a single breathhold of 8 seconds. IVIM diffusion weighted imaging were acquired based on sixteen b values (0, 3, 10, 25, 30, 40, 45, 50, 80, 200, 300, 400, 500, 600, 700, 800 sec/mm2). The imaging parameters include: resolution 3.0 mm×3.0 mm, slice thickness 6 mm with total 26 slices, TR/TE 2219/55ms. IVIM data sets were acquired using respiratory triggering. The quantitative MPF imaging was acquired using the recently developed approach10. The exact same imaging protocol as reported in10 was used in this work. The imaging parameters include: resolution 1.5 mm×1.5 mm, slice thickness 7 mm, TR/TE 2000/20ms. SPIR was used for fat suppression. The MPF imaging data sets of a single slice were acquired within a single breathhold of 8 seconds. A B1 map was acquired for MPF quantification. Regions of interest (ROIs) were selected with hepatic vascular structures avoided. T1rho was quantified using a mono-exponential relaxation model. IVIM quantification was performed using both bi-exponential full fitting and the segment fitting approach6. The segment threshold was 200 sec/mm2. LIC, MPF, T1rho, Perfusion Fraction (PF) and D of all imaging slices were measured. The mean of the measurement from all slices are used for correlation analysis. The correlation of these imaging parameters to LIC were calculated by linear regression analysis.Results and Discussion
The measurements of the correlation between these imaging approaches and liver iron content were shown in Table 2. Figure 1 shows the results of linear regression. Note T1rho shows a negative correlation with LIC. According to Bloch-McConnell equation, R1rho (1/T1rho) includes the contribution from the free water relaxation, relaxation due to chemical exchange, and relaxation due to magnetization transfer11. The increase of iron content can increase the water relaxation rate, thus shorten the T1rho. The PF and D from IVIM also appear to be sensitive to the presence of LIC. This is consistent with the results reported in12. Thus, care should be used if we use T1rho, PF, and D to measure liver fibrosis. The confounding factor from iron should be removed to improve the reliability of the measurement for diagnosis of liver fibrosis. Note D* is not included in the analysis due to its considerable errors6.The MPF appears to be not correlated with LIC. Note the approach used to measure MPF10 has removed the contribution from the free water pool, which leads to the insensitivity of measured MPF to the LIC. Such property is desirable when using MPF for the diagnosis of liver fibrosis.
Conclusion
Our studies demonstrate that MPF is not sensitive to liver iron. In contrast, T1rho, IVIM diffusion and perfusion parameters show linear correlation with the hepatic iron level.Acknowledgements
This study is supported by a grant from the Hong Kong Health and Medical Research Fund (HMRF) 06170166, a grant from the Hong Kong General Research Fund (GRF) 14201817, and a grant from the Research Grants Council of the Hong Kong SAR (Project SEG CUHK02).References
- Sandrin L, Fourquet B, Hasquenoph JM, et al. Beaugrand M. Transient elastography: a new noninvasive method for assessment of hepatic fibrosis. Ultrasound in medicine & biology. 2003, 31;29(12):1705-13.
- Yin M, Talwalkar JA, Glaser KJ, et al. Assessment of hepatic fibrosis with magnetic resonance elastography. Clinical Gastroenterology and Hepatology. 2007 Oct 31;5(10):1207-13.
- Huwart L, Sempoux C, Vicaut E, Salameh N, et al. Magnetic resonance elastography for the noninvasive staging of liver fibrosis. Gastroenterology. 2008 Jul 31;135(1):32-40.
- Wang YX, Yuan J, Chu ES, et al. T1rho MR imaging is sensitive to evaluate liver fibrosis: an experimental study in a rat biliary duct ligation model. Radiology. 2011; 259:712–9.
- Le Bihan D, Breton E, Lallemand D, et al. Separation of diffusion and perfusion in intravoxel incoherent motion MR imaging. Radiology. 1988 Aug;168(2):497-505.
- Li YT, Cercueil JP, Yuan J, et al. Liver intravoxel incoherent motion (IVIM) magnetic resonance imaging: A comprehensive review of published data on normal values and applications for fibrosis and tumor evaluation. Quant Imaging Med Surg. 2017;7(1):59-78.
- Yarnykh VL, Tartaglione EV, Ioannou GN. Fast macromolecular proton fraction mapping of the human liver in vivo for quantitative assessment of hepatic fibrosis. NMR Biomed. 2015;28(12):1716-1725.
- Paisant A, d’Assignies G, Bannier E, et al. MRI for the measurement of liver iron content, and for the diagnosis and follow-up of iron overload disorders. Press Medicale. 2017;46(12P2):e279-e287.
- Chen W, Chan Q, Wáng YX. Breath-hold black blood quantitative T1rho imaging of liver using single shot fast spin echo acquisition. Quantitative imaging in medicine and surgery. 2016 Apr;6(2):168.
- Hou et al. Quantitative Macromolecular Proton Fraction imaging based on spin-lock. ISMRM2020. Abstract ID: 4052.
- Zaiss M, Zu Z, Xu J, et al. A combined analytical solution for chemical exchange saturation transfer and semi‐solid magnetization transfer. NMR in biomedicine. 2015 Feb;28(2):217-30.
- Lee JT, Liau J, Murphy P, et al. Cross-sectional investigation of correlation between hepatic steatosis and IVIM perfusion on MR imaging. Magn Reson Imaging. 2012;30:572-578.
Figures
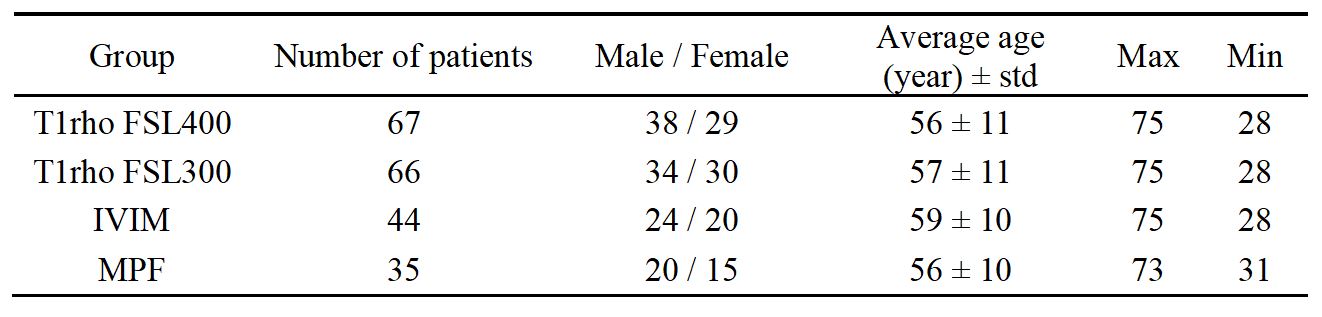
Table.
1. The age distribution of patients for each group
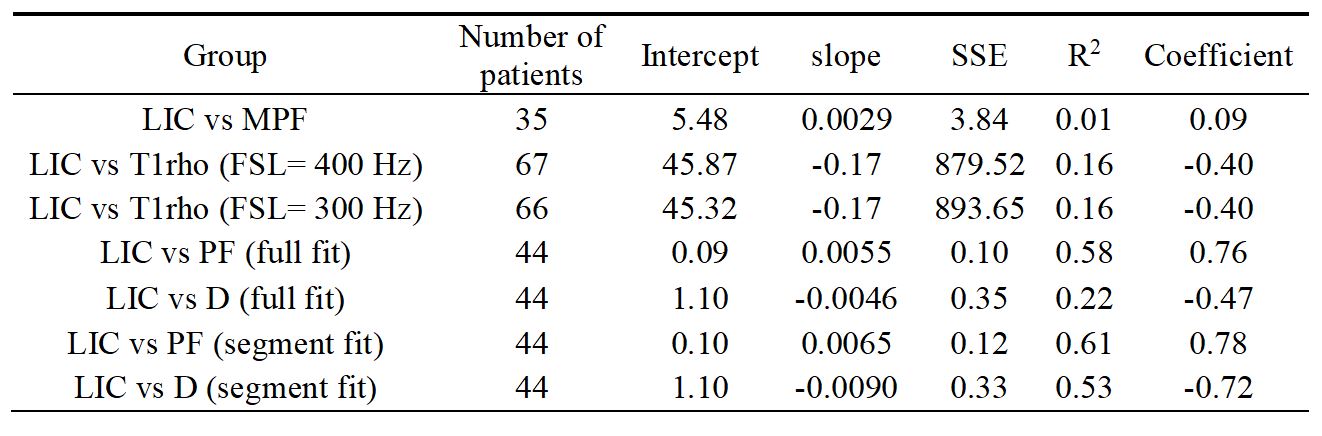
Table. 2. The linear regression result (SSE: sum of squared estimate of errors, Coefficient:
Pearson correlation coefficient)
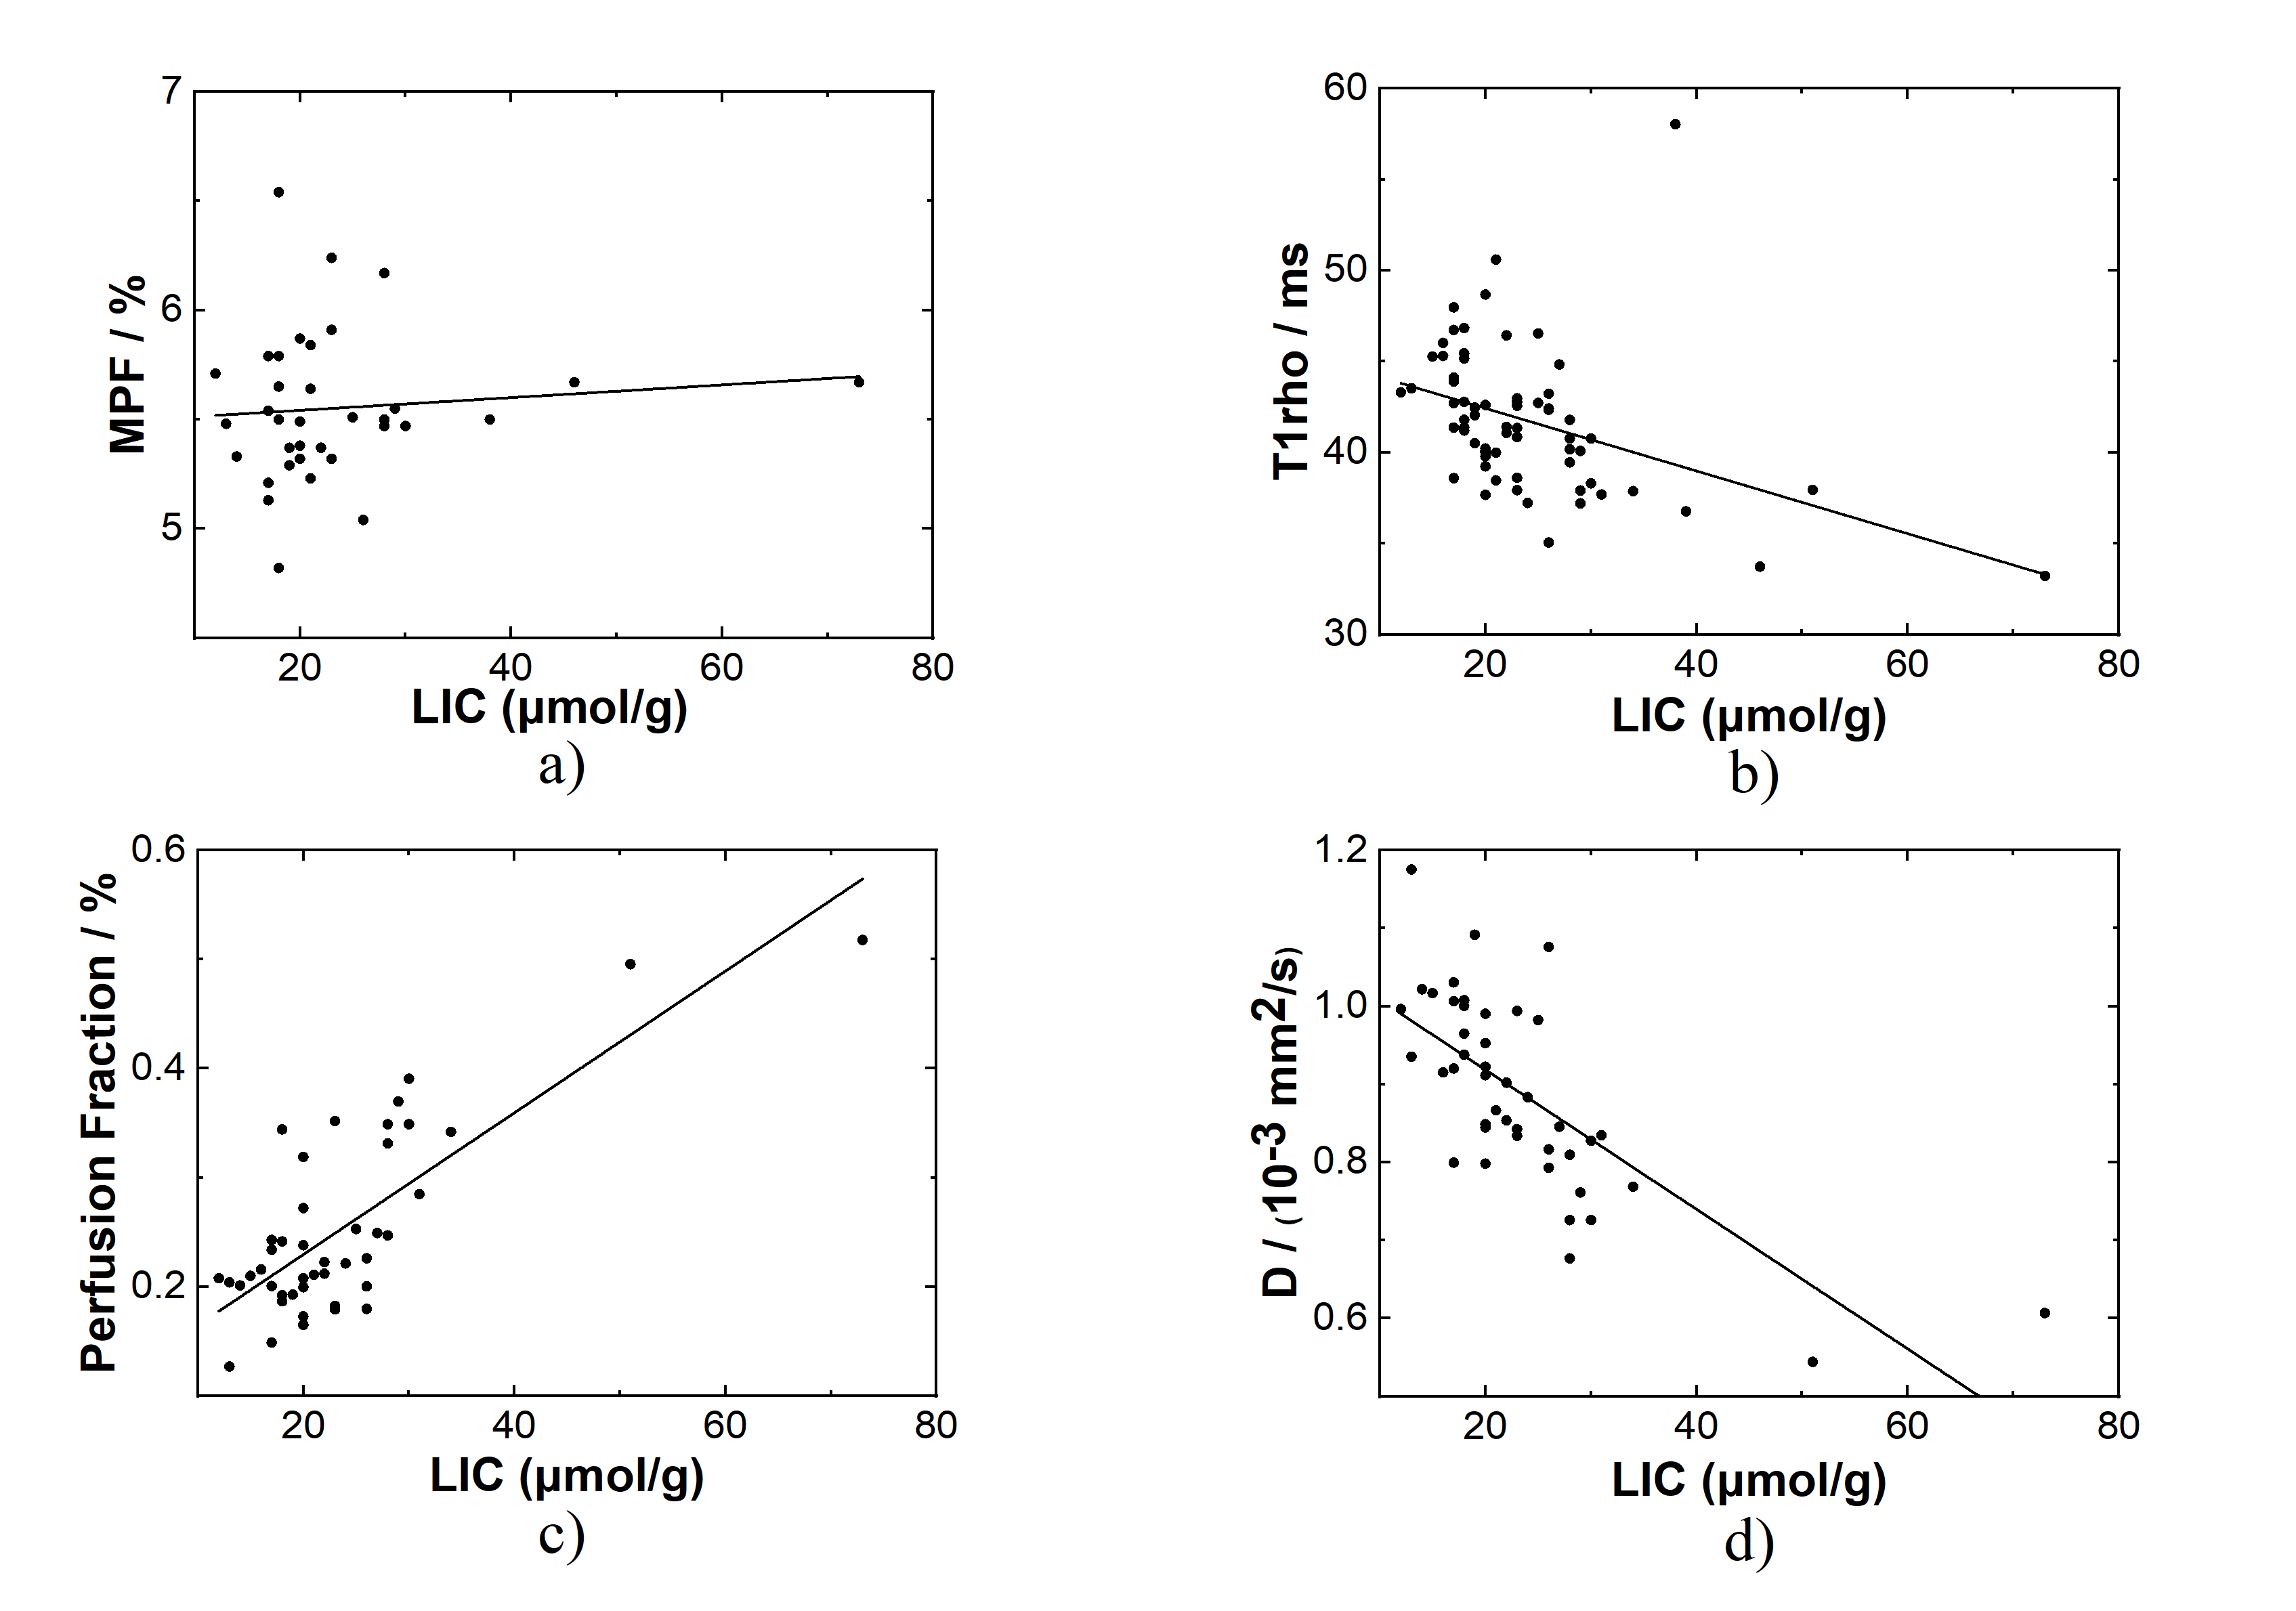
Figure 1. Correlation between LIC and various imaging measurements. a) MPF vs LIC, b) T1rho (FSL = 400 Hz) vs LIC; c) and d) are the perfusion fraction and D coefficient, respectively, calculated using the segment fitting of the IVIM data sets.