0333
Multi-vendor Phantom and Intra-individual Comparison of Liver Stiffness Using Various MR Elastography Sequences at 1.5T & 3T1Radiology, Mayo Clinic Arizona, Phoenix, AZ, United States, 2National Institutes of Health, Phoenix, AZ, United States, 3Mayo Clinic Florida, Jacksonville, FL, United States
Synopsis
The variability of stiffness data from GRE and SE EPI MRE sequences is tested on phantoms and in-vivo on 1.5T and 3T MRI scanners from two vendors. Large variability was observed in the phantom measurements for the GRE and EPI sequences on one of the vendor’s scanner, ranging from 20-33% difference. Stiffness measurements were very similar (within 10%) between sequences on the other vendor’s scanner. Similar results were found in several clinical subjects who had GRE and SE EPI sequences performed.
Introduction
MR Elastography (MRE) is an established tool to interrogate tissue stiffness non-invasively1. A variety of different MRE sequences are available for different applications and at different field strengths2-3. These include gradient recalled echo (GRE), spin-echo echo-planar (SE-EPI), and iron overload SE-EPI sequences. Ideally, the measured stiffness should not depend on the choice of scanner and/or pulse sequence. We seek to compare the quantified stiffness measurements for these different sequences on different MR scanners in a phantom and in-vivo.Materials and Methods
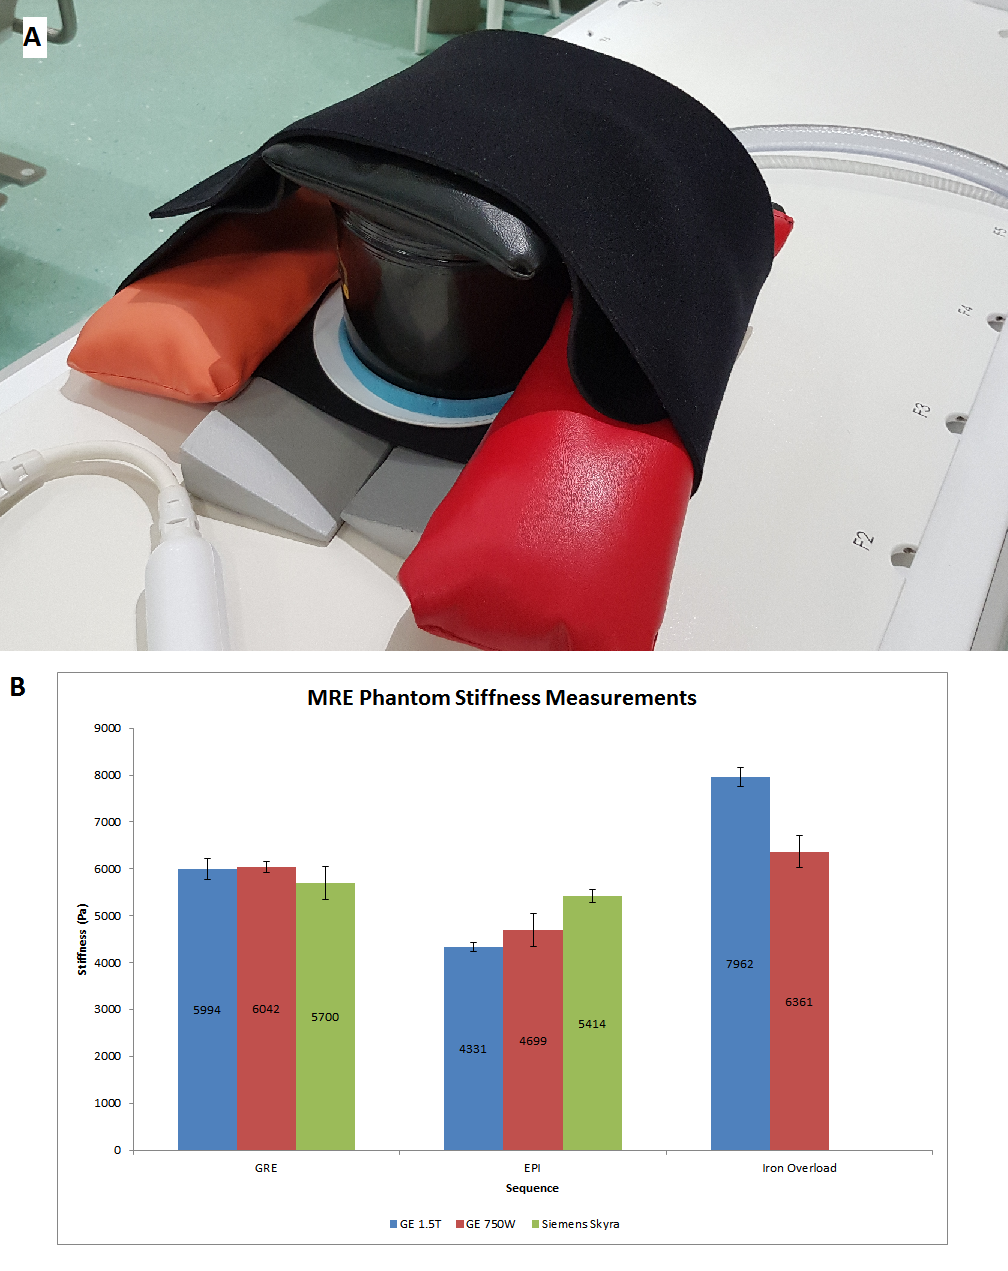
Scans were performed on the GE 1.5T Signa and GE 3T 750W (GE Healthcare, Waukesha, WI, USA); and Siemens 3T Skyra (Siemens Healthineers, Erlangen, Germany). The elastography active and passive drivers were from Resoundant Inc. (Rochester, MN, USA). An MRE phantom was used for measuring stiffness of a standard material. MRE was performed on the phantom using GRE, SE EPI, and iron overload SE EPI. All sequences were oriented axially and acquired using 4 slices.11 clinical subjects were scanned on the GE 1.5T and the Siemens 3T Skyra serially. Of these, 4 subjects had technical issues during the MRE acquisition resulting in 7 subjects with viable GRE and SE EPI MRE data. Additionally, scans on volunteers with no history of liver fibrosis were performed, using the same sequences and scanner platforms as performed on the clinical subjects.
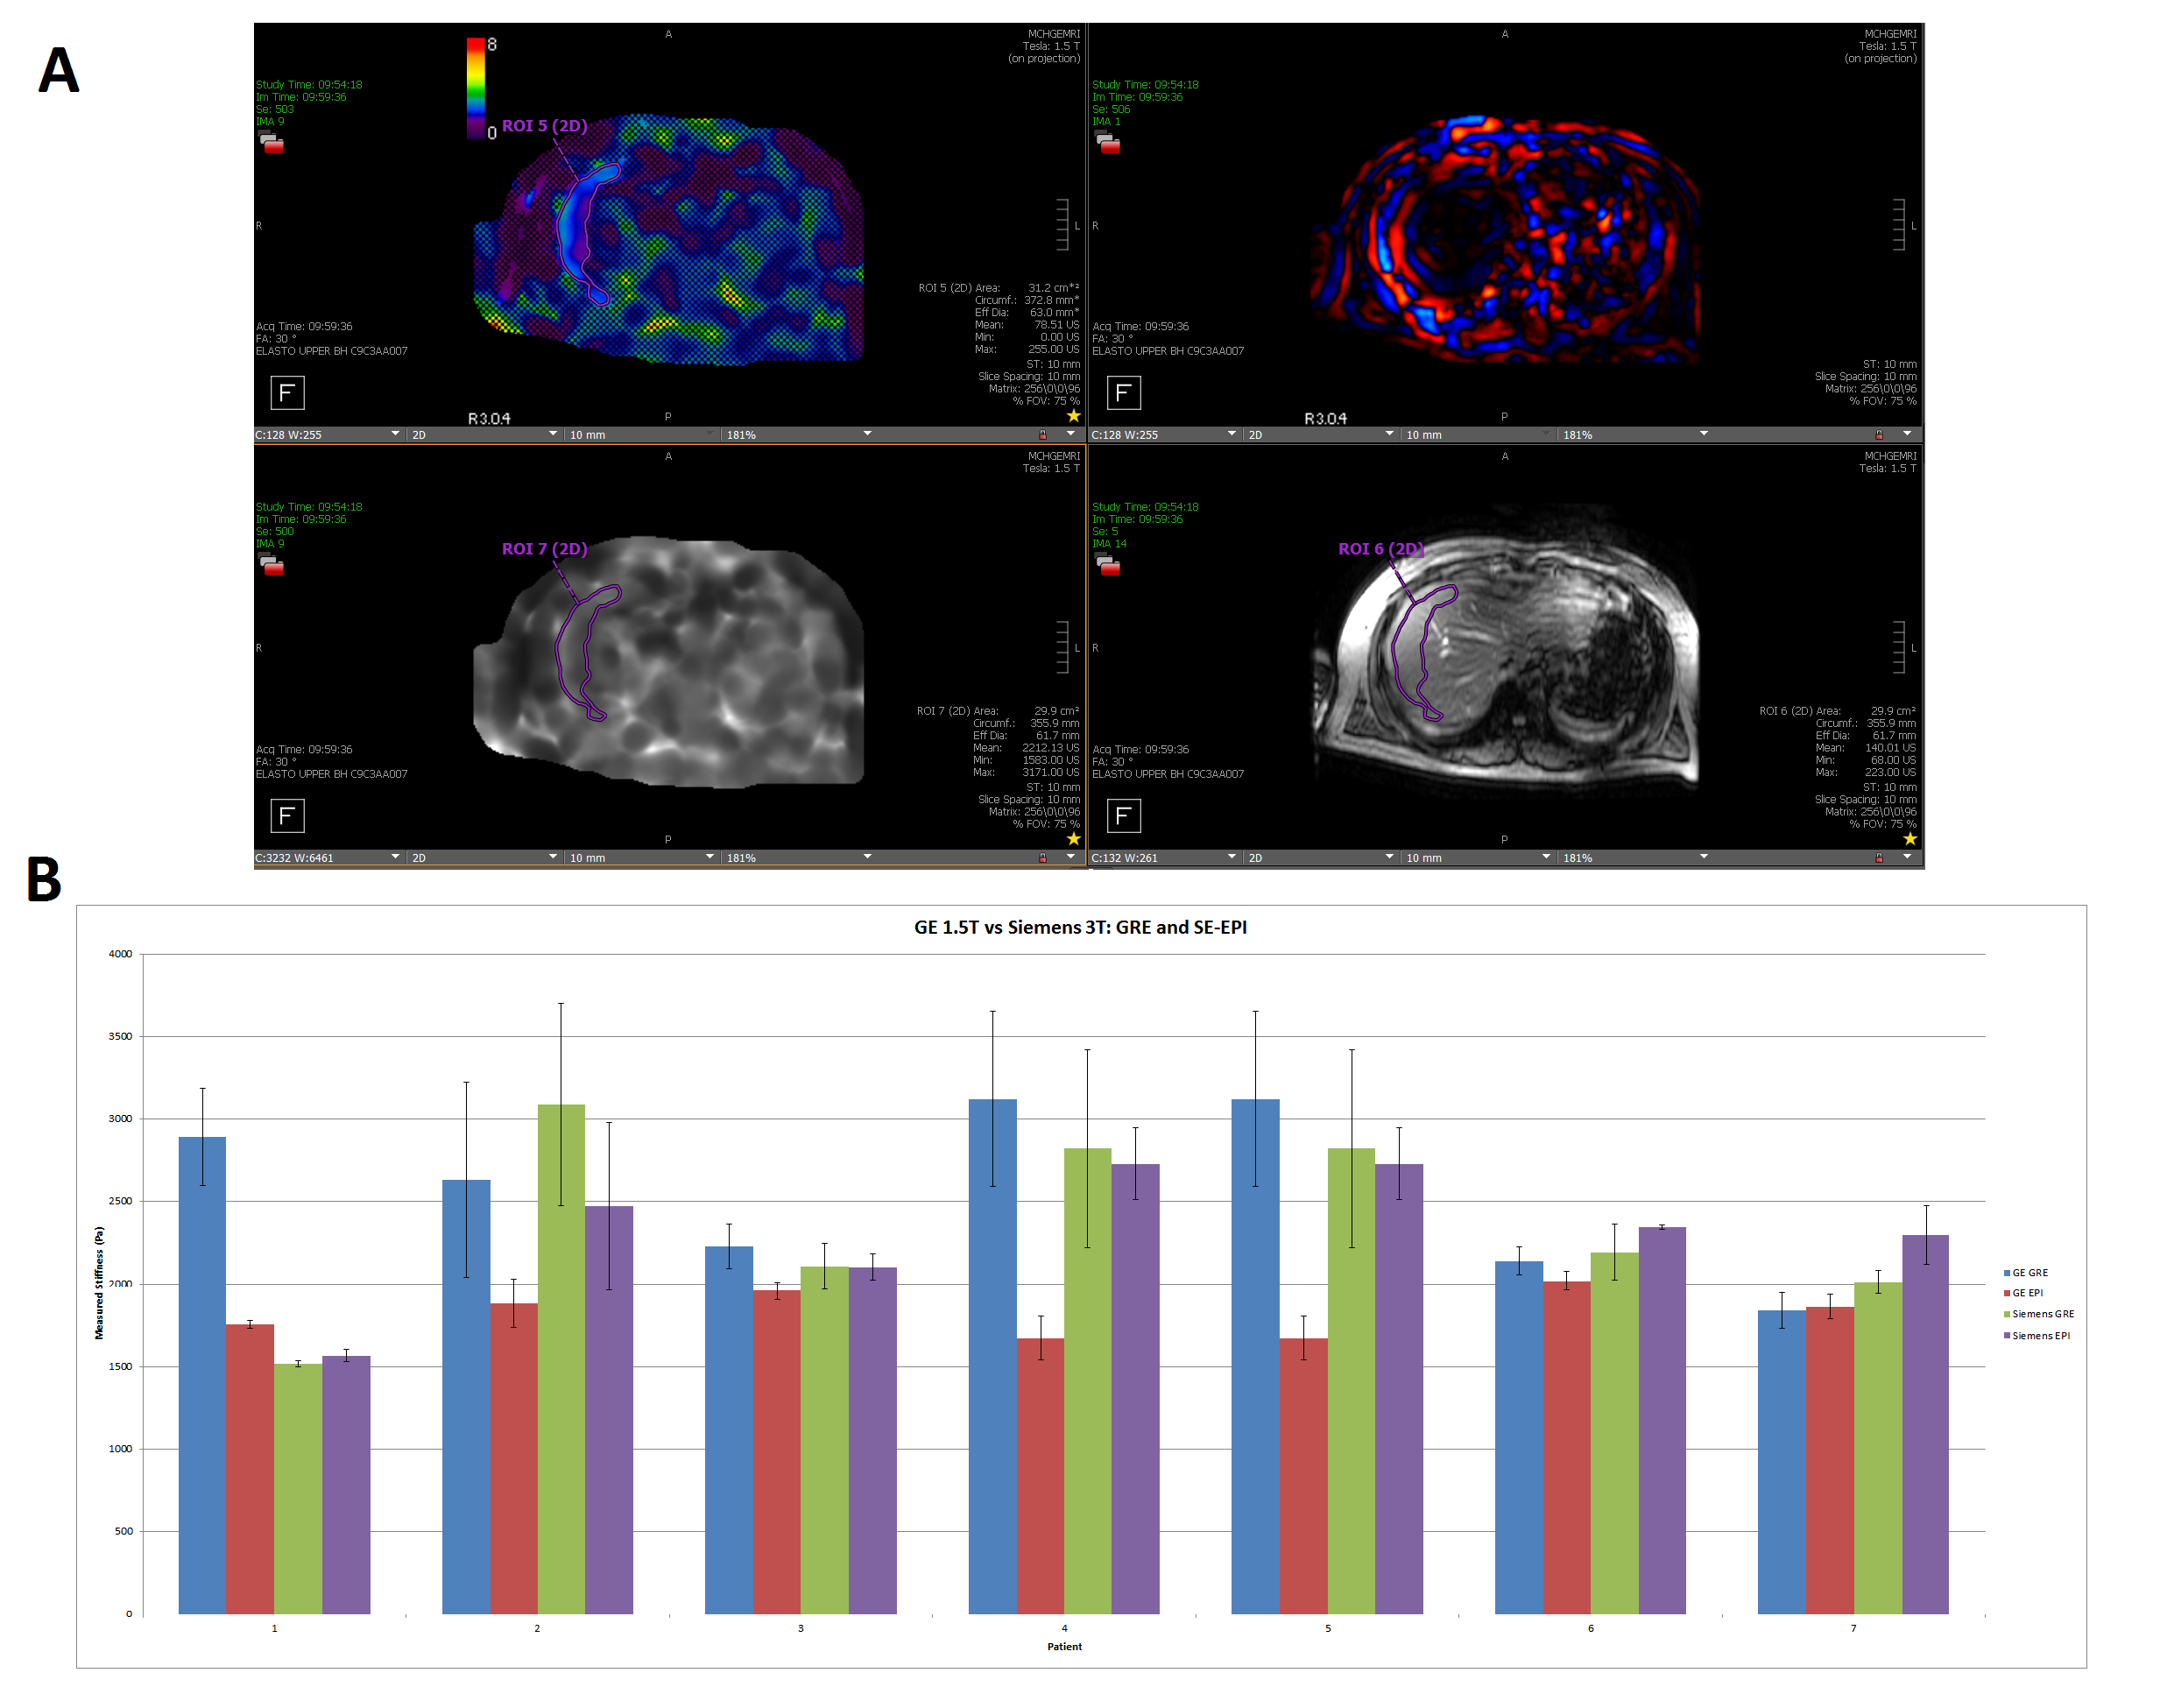
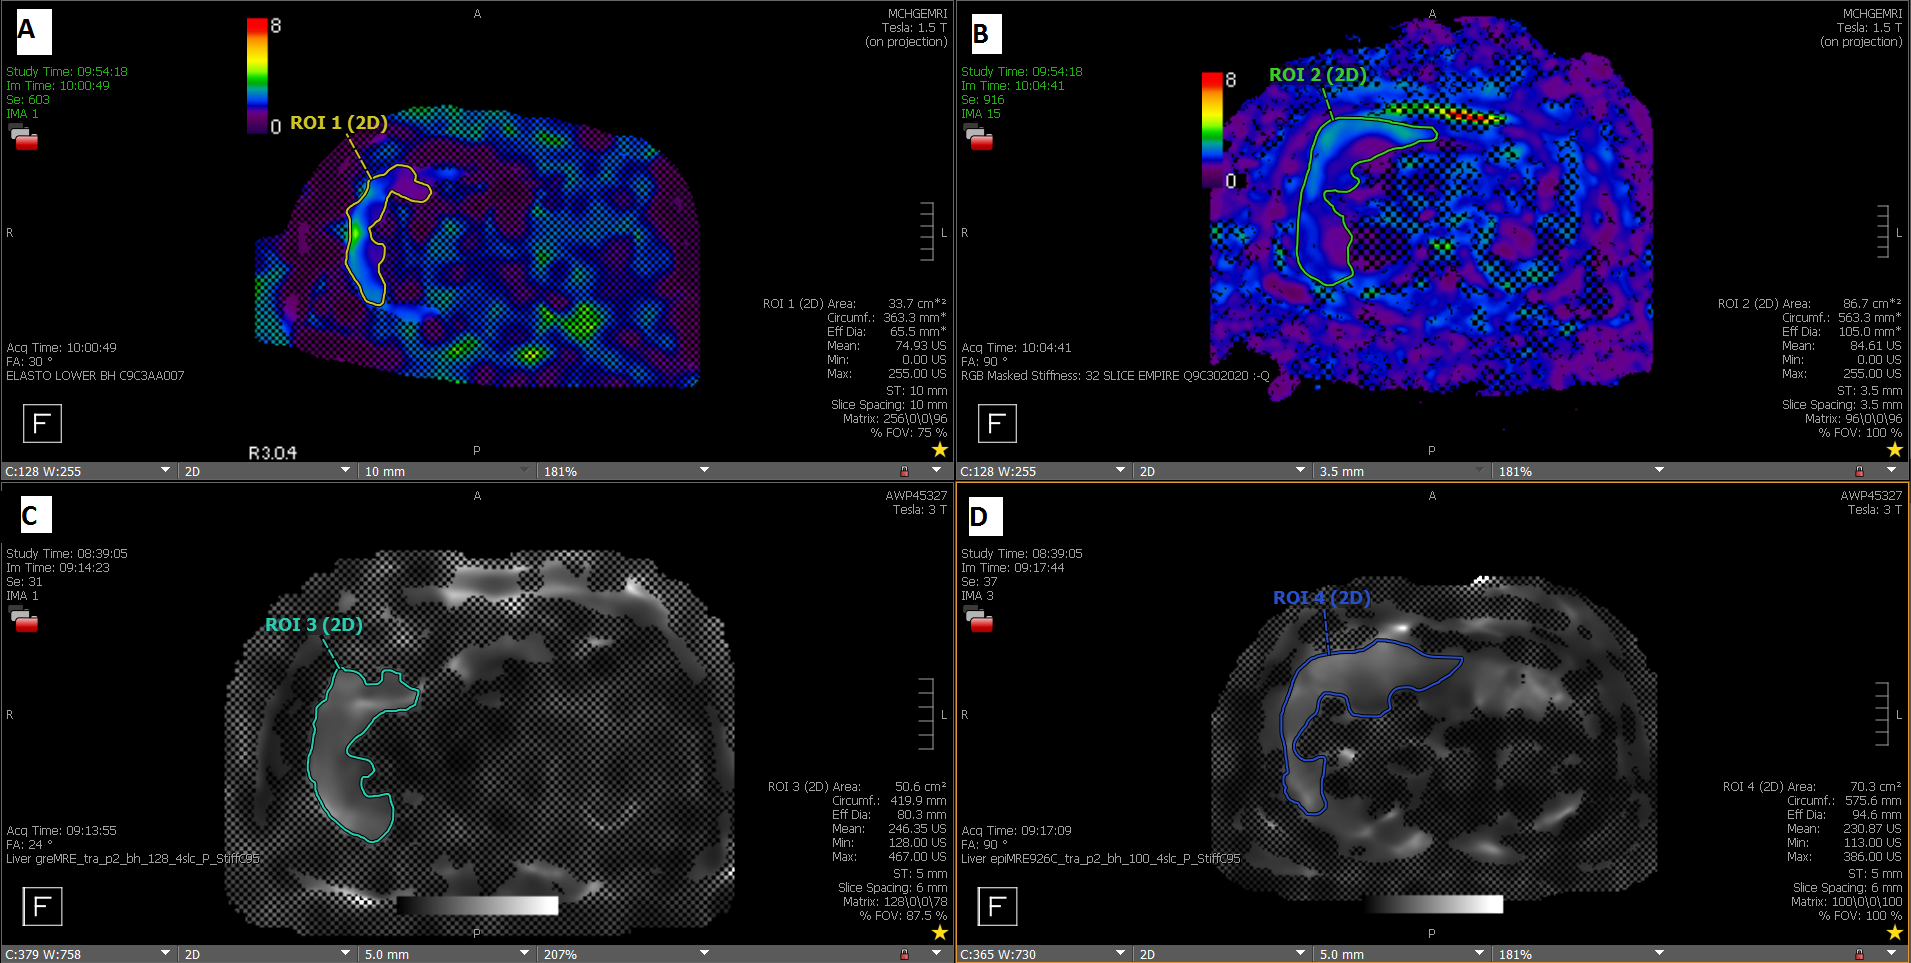
Stiffness quantification was performed in Visage 7.1. An initial ROI was drawn in the unmasked area of the 95% confidence masked elastogram, copied to the magnitude image and adjusted to include only area on the liver and avoid large vessels. The adjusted ROI is copied to the unmasked elastogram and the mean ROI stiffness is recorded. All ROIs were drawn by the same investigator and stiffness data was compiled with Microsoft Excel.
Results
In the phantom, the GRE sequence is the most consistent across the scanners, with all stiffness measurements being within 5% of the 1.5T GE GRE we use as the clinical standard in our practice. The Siemens 3T Skyra had the most consistency between the different sequences used, with a maximum of about 5% deviation from the GRE value. In the GE scanners, EPI sequences have a lower stiffness measurement than the GRE sequence, with an average difference of 28% and 21% for the 1.5T and 3T scanners respectively. For the iron overload SE EPI sequence, the measured stiffness was 33% higher than the GRE stiffness on the 1.5T GE scanner; for the 3T GE it was about 5% higher than GRE.In patients 1, 2, 4, and 5, we observed a similar drop in measured stiffness using SE EPI compared to GRE on the GE 1.5T scanner, with an average difference of 40%, similar to the phantom results. The other 3 patients had a mean difference of 6% between the GRE and the EPI.
In patients 2 and 7, there was a modest difference (20% and 14% respectively) in the GRE and SE EPI stiffness measurements on the 3T Skyra. Patient 7 had the only observed occurrence of the SE EPI recording a higher stiffness than the GRE in this study. For the rest of the patients the stiffness measurements differed by <10% on Siemens.
Discussion
We observed high variability between the different MRE sequences’ measured stiffness on the GE 1.5T and 3T scanners when compared to the standard GRE sequence used in our practice. The largest difference observed was from the iron overload SE EPI sequence (only available on the GE platform) performed on patients without calculated (R2*) hepatic iron deposition. The reason is unclear, and further investigation is needed to determine if this could be due to the post processing algorithm assuming the presence of paramagnetic iron in the scanned volume and making adjustments accordingly, which may impact the final calculated stiffness.For Siemens, there is much less variability in the measured stiffness between different sequences, which agrees with prior studies4. In clinical patients, we observed the same trend in most of the cases. Interpatient variability may be the cause of some of these differences from the phantom data. More scans are needed on patients with varied stages of fibrosis to confirm these results.
The 95% confidence mask appearance was generally different between sequences, with the Siemens 3T EPI images denoting a larger area of high confidence, that at times covers organs away from the liver, like the stomach. The GE 3T EPI confidence mask was similarly expansive but with a less well-defined appearance than on Siemens. The GRE confidence masks were both smaller than the EPI masks, with the GE GRE being somewhat smaller than in Siemens.
Conclusion
On GE, we observed greater differences in measured stiffness between GRE and SE EPI MRE sequences. Furthermore, the GE iron overload SE EPI sequence consistently showed higher stiffness measurements than GRE in-vivo without hepatic iron deposition. For Siemens, the 95% confidence mask included areas outside the liver contour. Although for only a small sample size, these differences should be considered in order to improve the accuracy and reproducibility of quantitative liver MRE.Acknowledgements
No acknowledgement found.References
1) Hoodeshenas S, Yin M, Venkatesh SK. Magnetic Resonance Elastography of Liver. Topics in Magnetic Resonance Imaging. 2018;27(5):319-333. doi:10.1097/rmr.0000000000000177.
2) Kim YS, Jang YN, Song JS. Comparison of gradient-recalled echo and spin-echo echo-planar imaging MR elastography in staging liver fibrosis: a meta-analysis. European Radiology. 2017;28(4):1709-1718. doi:10.1007/s00330-017-5149-5.
3) Serai SD, Trout AT. Can MR elastography be used to measure liver stiffness in patients with iron overload? Abdominal Radiology. 2018;44(1):104-109. doi:10.1007/s00261-018-1723-9.
4) Zhan C, Kannengiesser S, Chandarana H, Fenchel M, Ream J, Shanbhogue KP. MR elastography of liver at 3 Tesla: comparison of gradient-recalled echo (GRE) and spin-echo (SE) echo-planar imaging (EPI) sequences and agreement across stiffness measurements. Abdominal Radiology. 2019;44(5):1825-1833. doi:10.1007/s00261-019-01932-5.
Figures