0330
Rapid Free-Breathing Volumetric Liver Fat and R2* Quantification using Soft-Gating and Sparsity-Promoting Tensor Reconstruction1Radiological Sciences, University of California, Los Angeles, Los Angeles, CA, United States, 2Bioengineering, University of California, Los Angeles, Los Angeles, CA, United States, 3Siemens Healthcare, Los Angeles, CA, United States, 4Pediatrics, University of California, Los Angeles, Los Angeles, CA, United States
Synopsis
MRI quantification of hepatic proton-density fat fraction (PDFF) and R2* enables non-invasive diagnosis and staging of non-alcoholic fatty liver disease (NAFLD) and liver iron overload, respectively. A recent 3D stack-of-radial technique enables free-breathing quantification, but requires scans of 2-4 minutes and motion may affect R2* accuracy. In this work, we propose an improved free-breathing stack-of-radial technique that combines soft-gating and a sparsity-promoting tensor reconstruction to compensate for motion effects and accelerate the scan to 31 seconds. Data from adult and pediatric NAFLD patients demonstrate good agreement of PDFF and R2* between the proposed method and the conventional breath-held Cartesian scan.
Introduction
MRI non-invasively quantifies hepatic proton-density fat fraction (PDFF) and R2*, two imaging biomarkers that can be used to diagnose and stage non-alcoholic fatty liver disease (NAFLD)1,2 and hepatic iron overload3, respectively. While multi-echo 3D Cartesian MRI is widely used to quantify hepatic PDFF and R2* 4,5, the breath-holding (BH) requirement may be challenging for young, sick, and elderly patients. A recent 3D multi-echo stack-of-radial technique6,7 enables free-breathing quantification (“FB Radial”), but requires longer scan times (2-4 min) than BH Cartesian scans (10-20 sec). Moreover, the motion-averaging nature of the free-breathing scan, if uncompensated, may affect R2* accuracy8. In this work, we propose an improved FB Radial technique by combining soft-gating9 to compensate for motion effects and a sparsity-promoting tensor reconstruction to shorten the scan time to 31 seconds.Methods
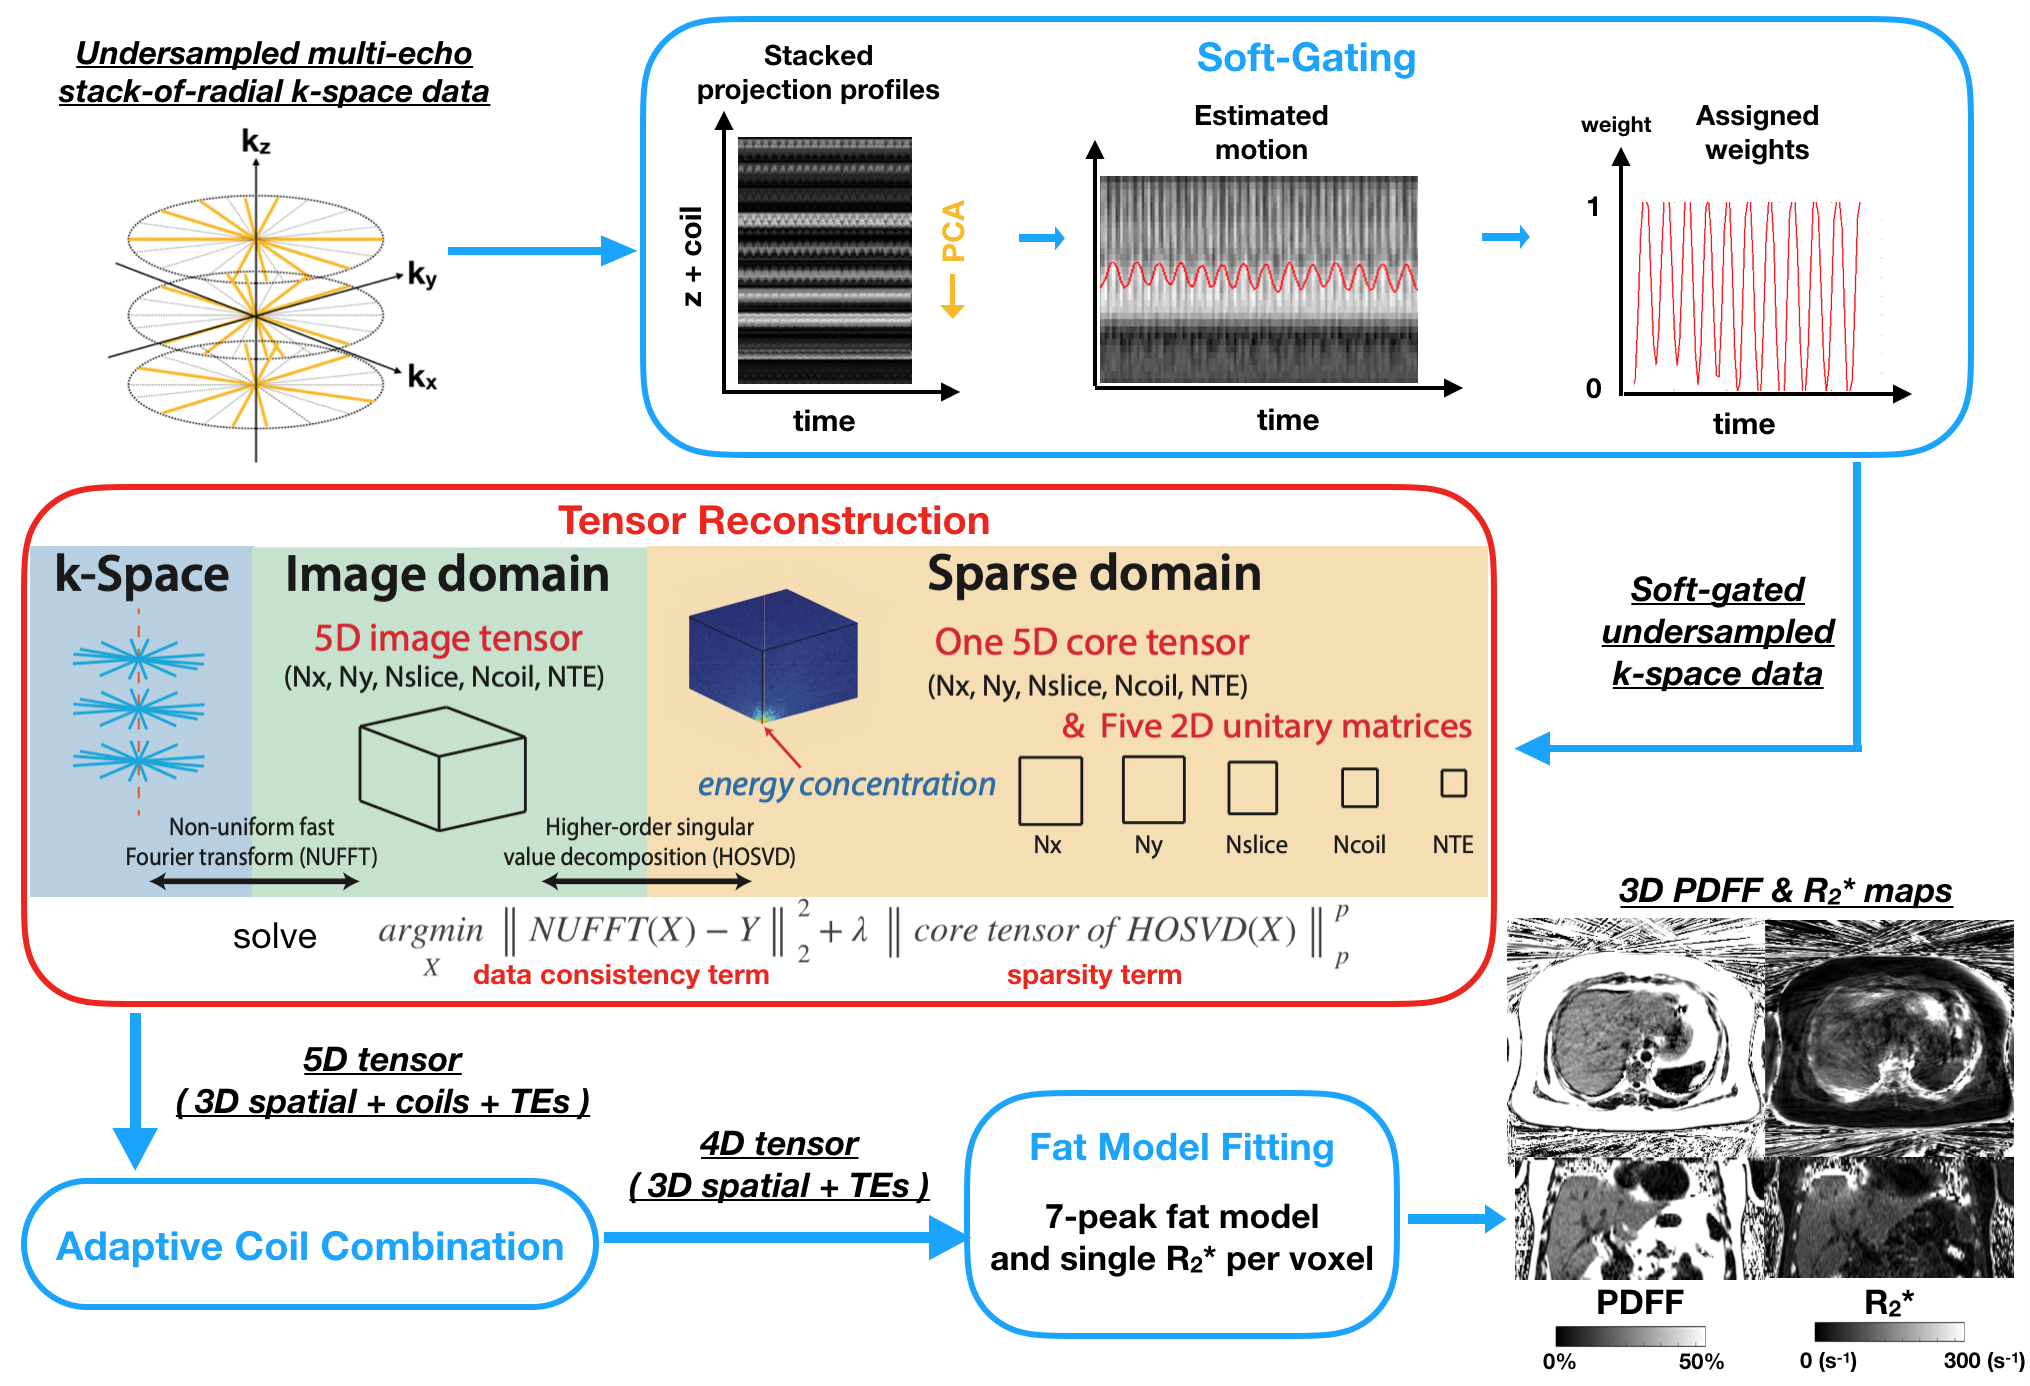
The local institutional review board approved this study and written informed consent or parental permission was obtained for 8 adults (male:female=4:4, age: 47±15 years, body mass index [BMI]: 28.5±5.3 kg/m2) and 8 children (male:female=5:3, age: 15±2 years, BMI: 29.8±9.9 kg/m2) with NAFLD. Trajectory-calibrated FB Radial data6,7 (Table 1) were acquired on a 3T scanner (Skyra or Prisma, Siemens) and retrospectively undersampled (Table 1). A conventional BH Cartesian sequence was also acquired (Table 1) for comparison.Projection profiles along the z-axis were stacked and principal component analysis (PCA) was used to extract the motion curve10. Soft-gating was applied by assigning different weights to radial readouts at different motion positions (Figure 1). We structured the data as a 5D tensor (3D spatial + multiple coils + multiple TEs). Higher-order singular value decomposition (HOSVD)11 was used to decompose the 5D dataset into a core tensor and five unitary 2D matrices. By utilizing the energy concentration property in the core tensor, we treated HOSVD as a sparsifying transform12 and formulated an optimization problem (Figure 1) that included a data consistency term and a p-norm term to promote sparsity in the core tensor. After tensor reconstruction, data was coil-combined13 and PDFF and R2* maps were calculated from the multiple TE images by complex fitting14 with a 7-peak fat model15 and single effective R2* per voxel. Reconstruction was implemented in MATLAB using a tensor toolbox16 and the ISMRM Fat-Water Toolbox17.
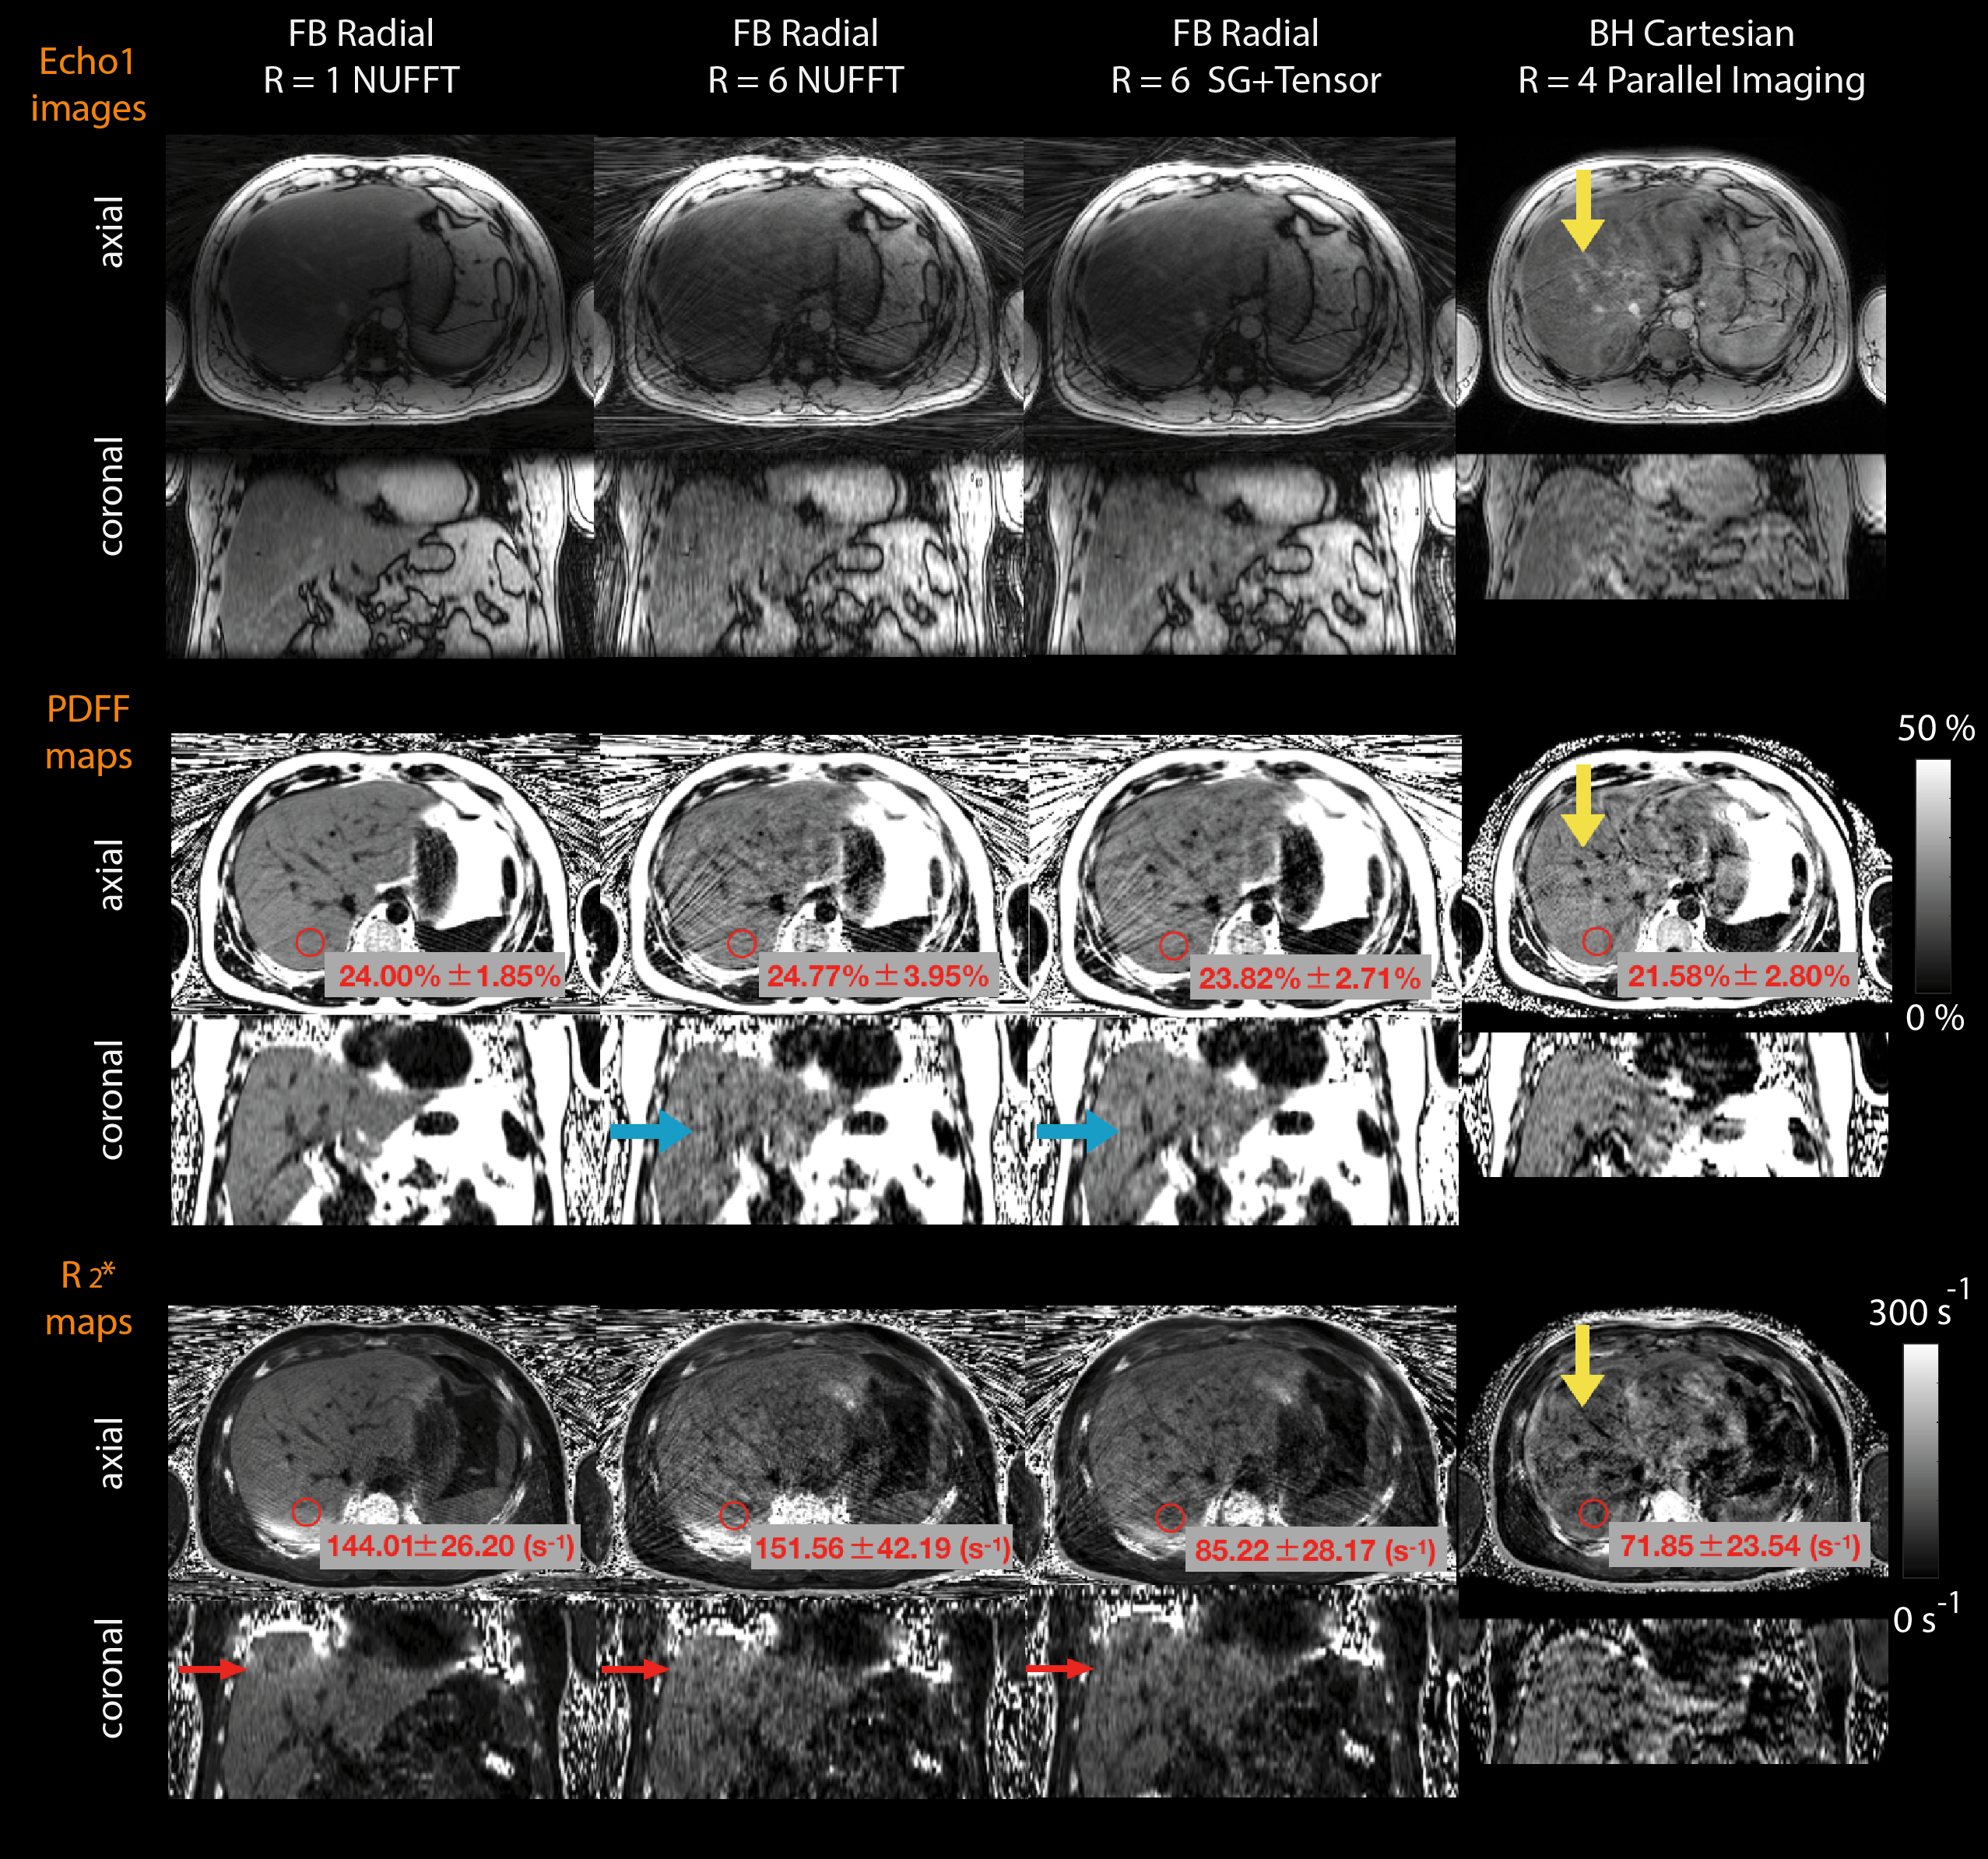
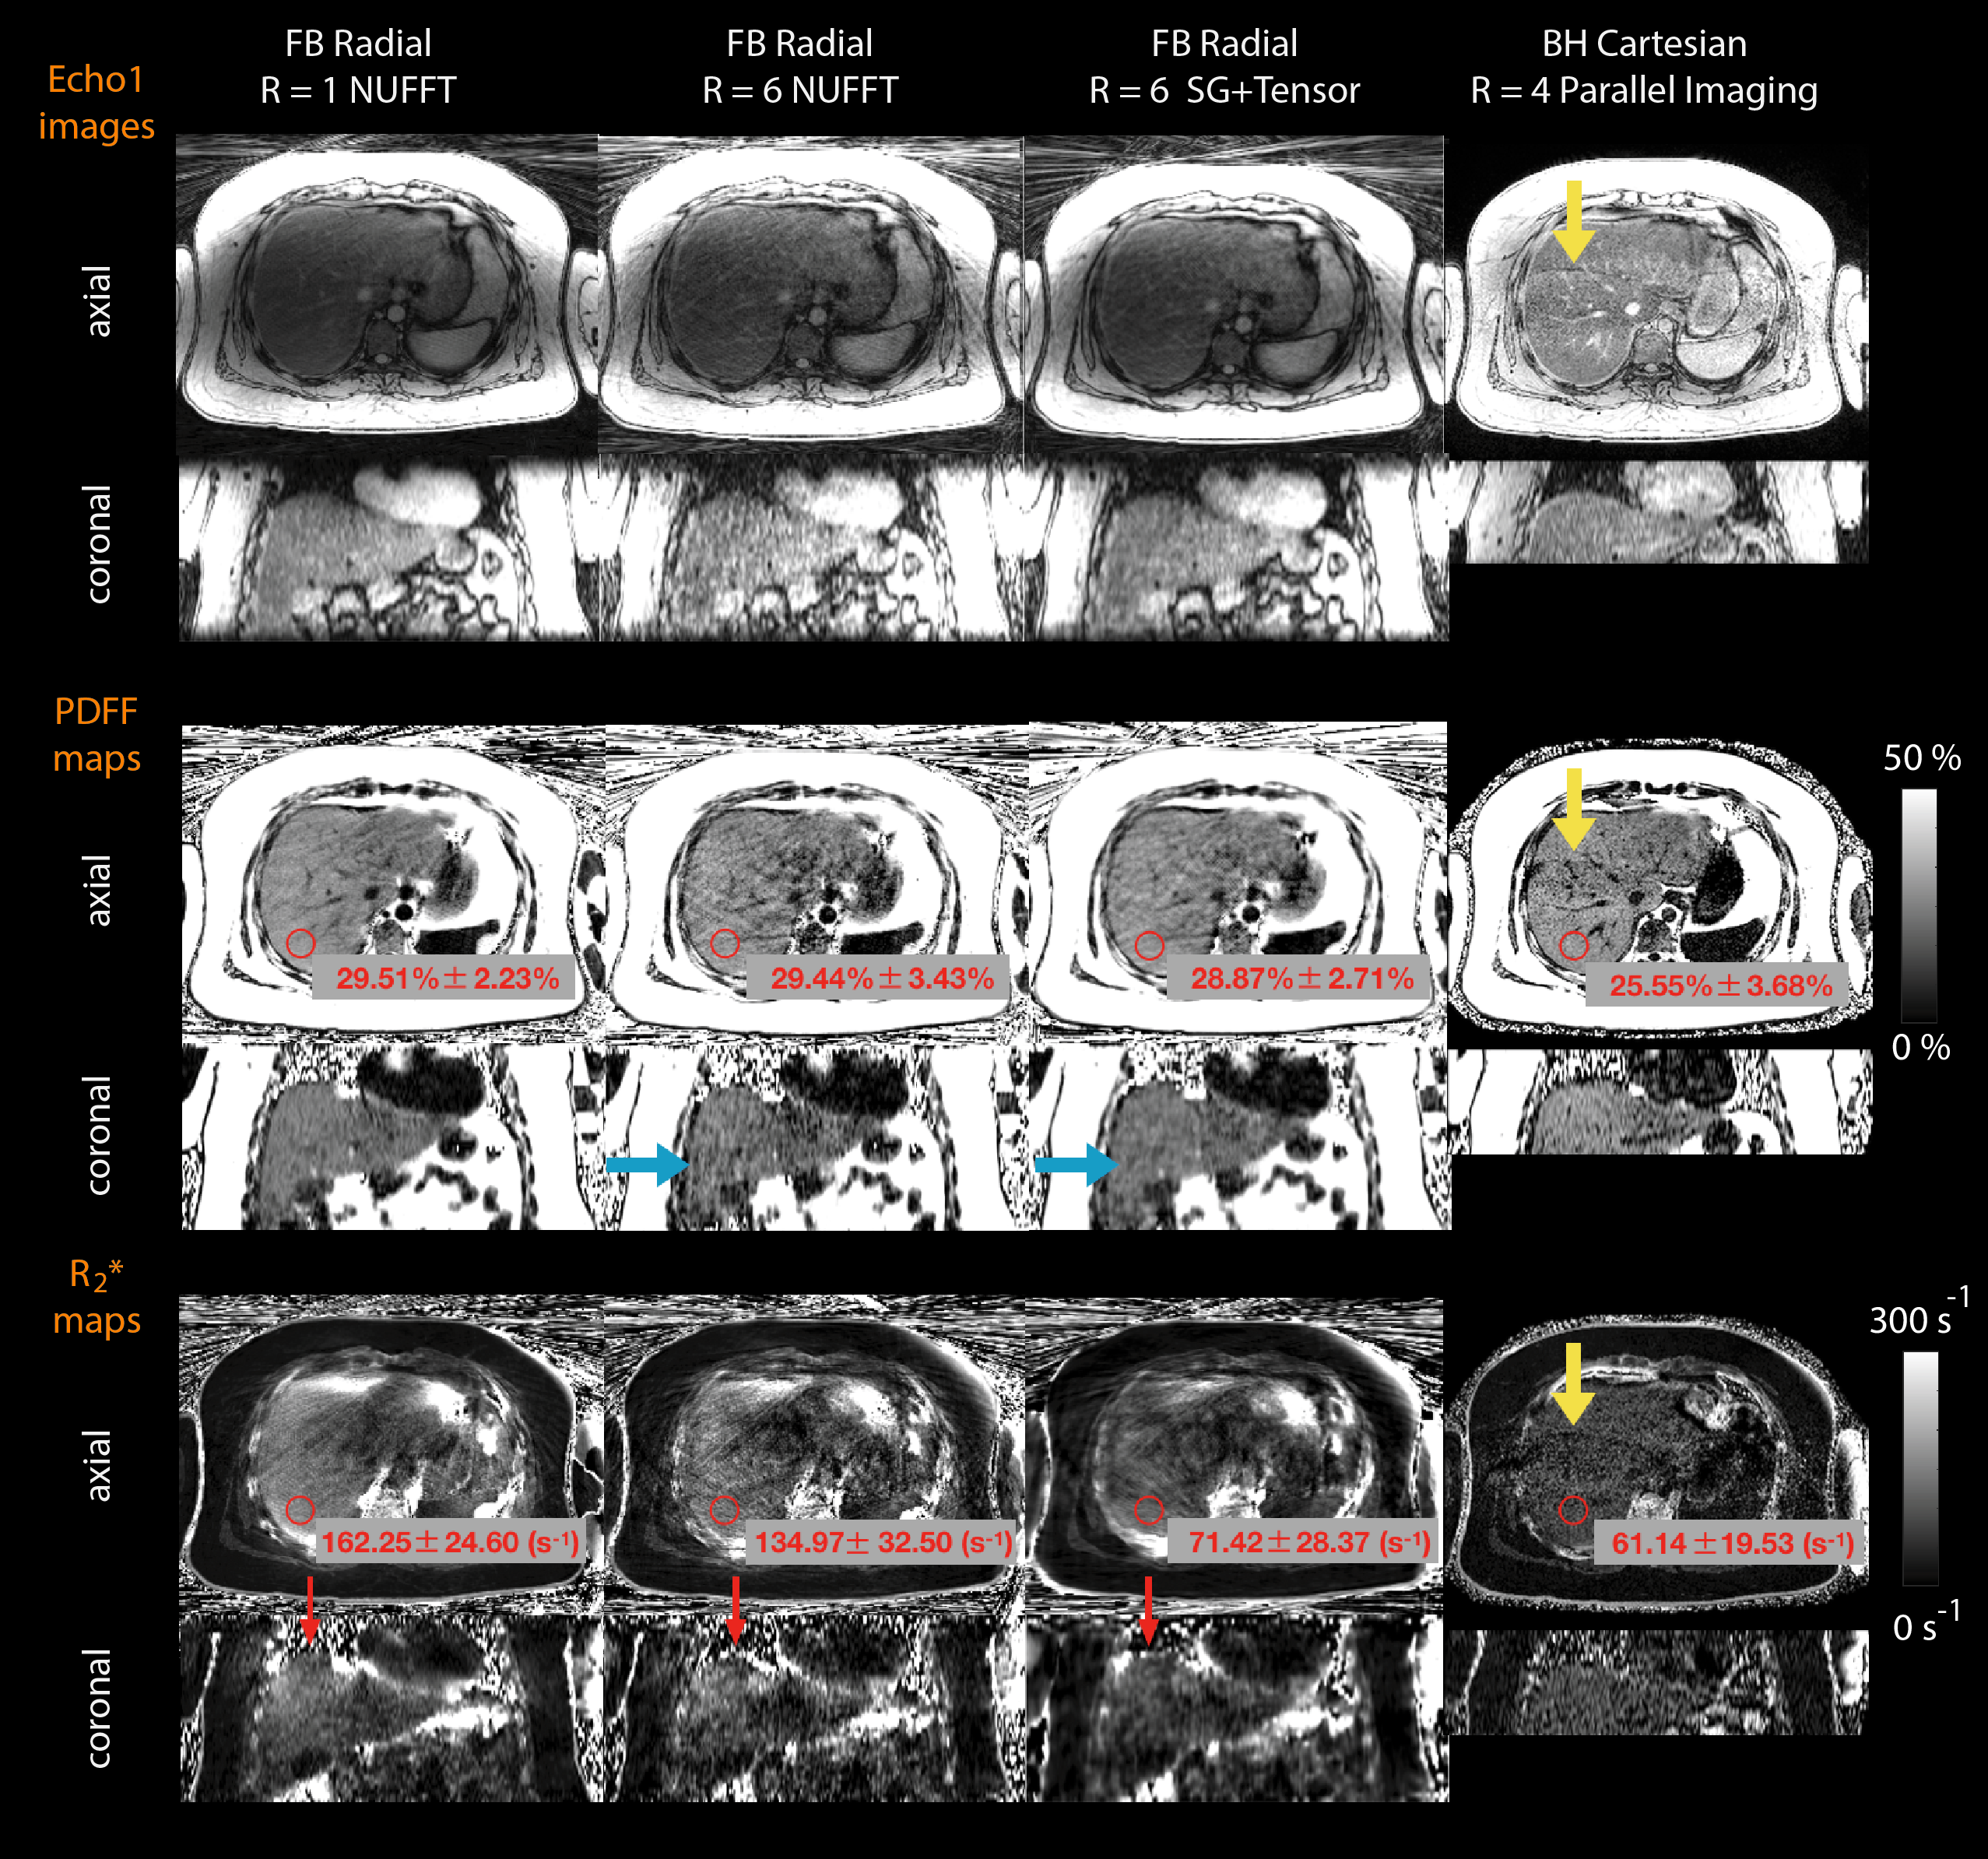
The retrospectively undersampled datasets (R=6) were reconstructed using non-uniform fast Fourier transform (NUFFT) and the proposed soft-gating + tensor reconstruction (“SG+Tensor”). We compared echo 1 images, PDFF and R2* maps from these two methods to the FB Radial R=1 NUFFT results. For quantitative evaluation, 5 cm2 regions of interest (ROIs) were drawn on 3 slices (near the liver dome, mid-liver, and lower liver) of the PDFF and R2* maps in each subject. We performed a linear correlation (including Pearson’s correlation coefficient $$$\rho$$$ and Lin’s concordance coefficient18 $$$\rho_{c}$$$; P<0.05 considered significant) and Bland-Altman analysis.
Results
Representative results from pediatric and adult NAFLD patients are shown in Figures 2 and 3, respectively. The proposed SG+Tensor reconstruction suppressed radial streaking artifacts and generated PDFF maps with reduced noise compared with R=6 NUFFT. Artificially elevated R2* was seen on FB radial R=1 and R=6 NUFFT near the liver dome due to respiratory motion effects (Figures 2 and 3). The proposed method mitigated this effect by using soft-gating. Both FB Radial R=1 and R=6 SG+Tensor PDFF had significant correlation with BH Cartesian (P<0.05) (Figure 4). R2* in FB Radial R=1 (no SG) exhibited a weak correlation ($$$\rho$$$=0.6482, $$$\rho_{c}$$$=0.4709; P<0.05) with BH Cartesian, while there was strong correlation ($$$\rho$$$=0.9028, $$$\rho_{c}$$$=0.8913; P<0.05) between R2* measured by FB Radial R=6 SG+Tensor and BH Cartesian. Using Bland-Altman analysis, PDFF mean difference between FB Radial R=1 and R=6 SG+Tensor was 0.35%. R2* agreement was stronger between R=6 SG+Tensor and BH Cartesian (95% limits of agreement [LoA] = 3.97±21.98 s-1) than between FB Radial R=1 and BH Cartesian (LoA = 22.99±58.66 s-1).Discussion
By using the proposed SG+Tensor method, FB Radial scan time could be reduced to 31 seconds, which is comparable to the duration of BH Cartesian scans. By performing HOSVD in the complex domain, the proposed tensor reconstruction has the advantage of not requiring additional phase constraints. The FB Radial R=6 SG+Tensor quantitative maps demonstrated significant correlation with that from BH Cartesian scans for PDFF (slope of regression=0.9764) and R2* (slope of regression=0.8698). However, the images from SG+Tensor still exhibited some blurring, particularly in pediatric subjects who were more likely to have irregular breathing patterns. Respiratory motion compensation should be further investigated, and one potential improvement to reduce blurring is to use smaller local tensors in the sparsity model19. We presented results from combining soft-gating and tensor reconstruction, but individual analysis of their performance can be done by comparing with R=1 SG+NUFFT and R=6 SG+NUFFT in future studies. Computation time (~40 minutes/subject) is another limitation of the proposed tensor reconstruction. Hardware acceleration and optimized NUFFT implementation should be considered in future work to overcome this obstacle.Conclusion
We combined soft-gating with a sparsity-promoting tensor reconstruction to compensate for the motion effects and accelerate free-breathing 3D stack-of-radial liver PDFF and R2* quantification to 31 seconds. Data from this study demonstrate that the proposed technique has consistent PDFF and R2* with breath-holding Cartesian scans in adult and pediatric NAFLD patients.Acknowledgements
This study was supported in part by Siemens Healthineers and UCLA Radiological Sciences. The authors thank the study coordinators and MRI technologists at UCLA. This work acknowledges the use of the ISMRM Fat-Water Toolbox (http://ismrm.org/workshops/FatWater12/data.htm).References
1.Vernon G, Baranova A, Younossi ZM. Systematic review: the epidemiology and natural history of non-alcoholic fatty liver disease and non-alcoholic steatohepatitis in adults. Alimentary Pharmacology & Therapeutics. 2011;34(3):274-285.
2. Rinella ME. Nonalcoholic fatty liver disease: a systematic review. The Journal of the American Medical Association. 2015;313(22):2263–2273.
3. Hankins JS, McCarville MB, Loeffler RB, et al. R2* magnetic resonance imaging of the liver in patients with iron overload. Blood. 2009;113(20):4853‐ 4855.
4. Meisamy S, Hines C, Hamilton G, et al. Quantification of hepatic steatosis using T1 independent, T2* corrected MRI with spectral modeling of fat: a blinded comparison with MR spectroscopy. Radiology. 2011;258(3):767– 775.
5. Liu CY, McKenzie CA, Yu H, et al. Fat quantification with IDEAL gradient echo imaging: correction of bias from T(1) and noise. Magnetic Resonance in Medicine. 2007;58(2):354-364.
6. Armstrong T, Dregely I, Stemmer A, et al. Free-breathing liver fat quantification using a multiecho 3D stack-of-radial technique. Magnetic Resonance in Medicine. 2018;79(1):370-382.
7. Armstrong T, Ly KV, Murthy S, et al. Free‐breathing quantification of hepatic fat in healthy children and children with nonalcoholic fatty liver disease using a multi‐echo 3‐D stack‐of‐radial MRI technique. Pediatric Radiology. 2018;48(7):941– 953.
8. Zhong X, Armstrong T, Nickel MD, et al. Effect of respiratory motion on free-breathing three-dimensional stack-of-radial liver R2* relaxometry and improved quantification accuracy using self-gating. Magnetic Resonance in Medicine. In Press (2019).
9. Zhang T, Cheng JY, Potnick AG, et al. Fast pediatric 3D free-breathing abdominal dynamic contrast enhanced MRI with high spatiotemporal resolution. Journal of magnetic resonance imaging. 2015;41(2):460-473.
10. Feng L, Axel L, Chandarana H, et al. XD‐GRASP: golden‐angle radial MRI with reconstruction of extra motion‐state dimensions using compressed sensing. Magnetic Resonance in Medicine. 2016:75(2):775-788.
11. De Lathauwer L, De Moor B, and Vandewalle J. A multilinear singular value decomposition. SIAM Journal on Matrix Analysis and Applications. 2000:21(4):1253–1278.
12. Yu Y, Jin J, Liu F, et al. Multidimensional compressed sensing MRI using tensor decomposition-based sparsifying transform. PLoS One. 2014:9(6):e98441.
13. Walsh DO, Gmitro AF, Marcellin MW. Adaptive reconstruction of phased array MR imagery. Magnetic Resonance in Medicine 2000;43(5):682–690.
14. Hernando D, Hines CD, Yu H, et al. Addressing phase errors in fat‐water imaging using a mixed magnitude/complex fitting method. Magnetic Resonance in Medicine. 2012;67(3):638-644.
15. Ren J, Dimitrov I, Sherry AD, et al. Composition of adipose tissue and marrow fat in humans by 1H NMR at 7 Tesla. Journal of Lipid Research. 2008;49(9):2055-2062.
16. Bader BW, Kolda TG, et al. MATLAB Tensor Toolbox Version 2.6, Available online, February 2015. URL: http://www.sandia.gov/~tgkolda/TensorToolbox/.
17. ISMRM Fat-Water Toolbox. 2012. URL: https://www.ismrm.org/workshops/FatWater12/data.htm
18. Lin LI. A concordance correlation coefficient to evaluate reproducibility. Biometrics. 1989;45(1):255-268.
19. Trzasko J, Manduca A. Local versus global low‐rank promotion in dynamic MRI series reconstruction. In Proceedings of the 19th Annual Meeting of ISMRM, Montreal, Canada, 2011. p.4371.
Figures
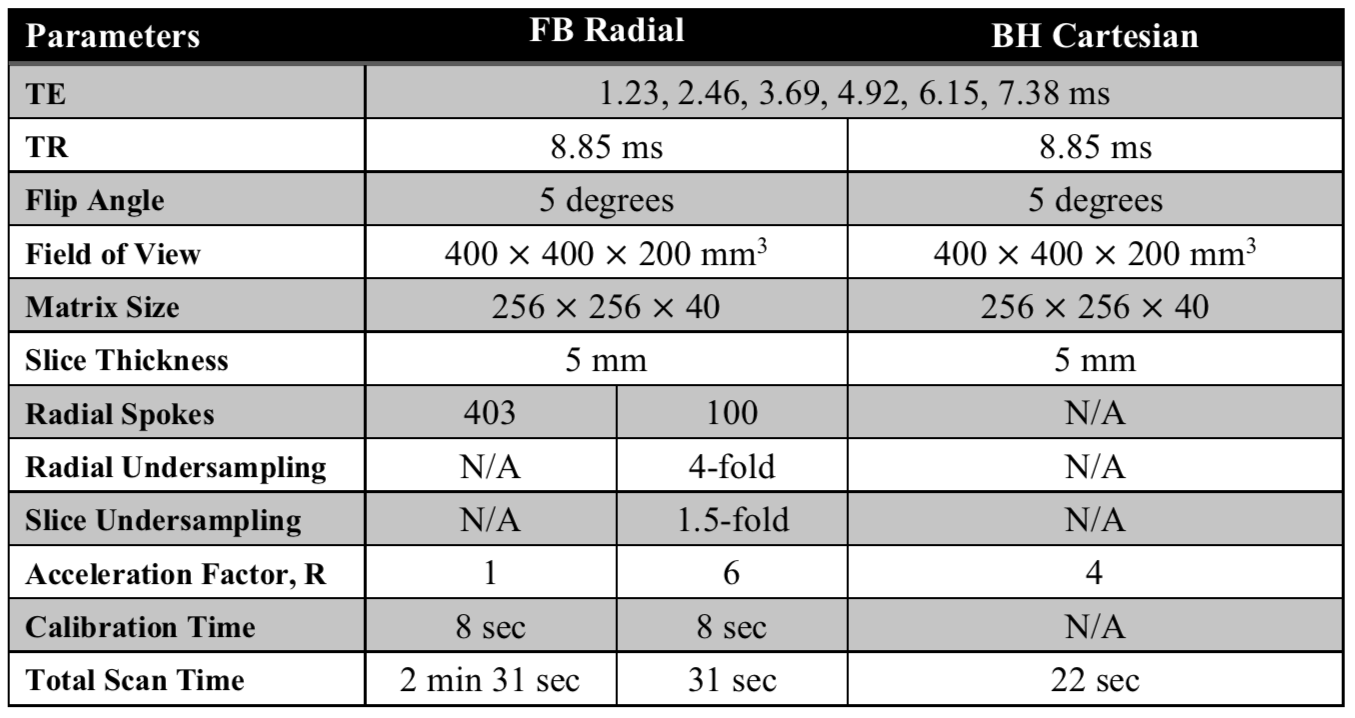
Table 1: Representative parameters for free-breathing (FB) Radial and breath-holding (BH) Cartesian sequences. All scans were acquired in the axial orientation. We retrospectively undersampled data from the FB Radial sequence along both the slice and radial directions. The total scan time of FB Radial included 8 seconds of radial trajectory calibration. BH Cartesian used 4-fold parallel imaging.