0329
Utility of magnetic resonance elastography and ultrasound shear wave elastography for assessment of portal hypertension
Paul Kennedy1,2, Octavia Bane1,2, Stefanie Hectors1,2,3, Daniel Stocker1,2, Bradley D Bolster Jr. 4, Scott Friedman5, Thomas Schiano6, Isabel M Fiel7, Swan Thung7, Aaron Fischman2, and Bachir Taouli1,2
1BioMedical Engineering and Imaging Institute, Icahn School of Medicine at Mount Sinai, New York, NY, United States, 2Department of Diagnostic, Molecular and Interventional Radiology, Icahn School of Medicine at Mount Sinai, New York, NY, United States, 3Department of Radiology, Weill Cornell Medicine, New York, NY, United States, 4Siemens Medical Solutions USA, Inc., Salt Lake City, UT, United States, 5Division of Liver Diseases, Icahn School of Medicine at Mount Sinai, New York, NY, United States, 6Department of Medicine, Icahn School of Medicine at Mount Sinai, New York, NY, United States, 7Department of Pathology, Icahn School of Medicine at Mount Sinai, New York, NY, United States
1BioMedical Engineering and Imaging Institute, Icahn School of Medicine at Mount Sinai, New York, NY, United States, 2Department of Diagnostic, Molecular and Interventional Radiology, Icahn School of Medicine at Mount Sinai, New York, NY, United States, 3Department of Radiology, Weill Cornell Medicine, New York, NY, United States, 4Siemens Medical Solutions USA, Inc., Salt Lake City, UT, United States, 5Division of Liver Diseases, Icahn School of Medicine at Mount Sinai, New York, NY, United States, 6Department of Medicine, Icahn School of Medicine at Mount Sinai, New York, NY, United States, 7Department of Pathology, Icahn School of Medicine at Mount Sinai, New York, NY, United States
Synopsis
In this study we investigate the ability of MR elastography (MRE) and ultrasound shear wave elastography (SWE) to assess portal hypertension (PH) severity in patients with liver disease and hepatic venous pressure gradient (HVPG) measurement. 3D MRE spleen stiffness correlated with HVPG. 2D and 3D MRE of the spleen were significantly higher in patients with clinically significant PH (CSPH, HVPG>10mmHg) than those with no PH/PH (HVPG>5mmHg). 3D MRE spleen stiffness was significantly elevated in PH/CSPH patients compared to those with no PH and was an excellent predictor of CSPH. MRE spleen stiffness appears sensitive to hemodynamic changes associated with PH.
Introduction
Portal hypertension (PH) is a condition associated with severe complications such as ascites, gastro-esophageal varices and hepatic encephalopathy. PH can vary in severity and is currently diagnosed via invasive hepatic venous pressure gradient measurement (HVPG) which is the gold standard. HVPG >5mmHg indicates PH, while a HVPG >10mmHg is considered clinically significant portal hypertension (CSPH). Early identification of CSPH is particularly important as these patients are at higher risk for developing acute variceal bleeding1. In this study we evaluate the ability of MR elastography (MRE) and ultrasound shear wave elastography (SWE) to assess the severity of PH.Methods
In this prospective IRB approved study, 30 initial patients (18/12 M/F, mean age 57.2y) with liver disease and suspicion of PH underwent same day 1.5T MRI (MAGNETOM Aera, n=30, Siemens Healthcare, Erlangen, Germany) and ultrasound (ACUSON S3000 n=25, ACUSON Sequoia n=5, Siemens Healthcare, Mountain View, CA, USA) imaging. In 3 patients additional imaging was performed at 3T (Discovery 750W, GE Healthcare, Waukesha, WI, USA). All patients underwent HVPG measurement (mean interval between HVPG and imaging 5.4±44.3 days) and liver biopsy. 2D MRE was performed at 1.5T in all cases using a prototype SE-EPI sequence at 60 Hz with 10 axial slices, dual passive drivers enabling simultaneous liver and spleen acquisition2 and an inline reconstruction3. 3D MRE was performed in 25/30 patients at 1.5T (n=22) or 3T (n=3). On both systems, 3D MRE liver and spleen data were acquired simultaneously using a prototype SE-EPI sequence over 32 axial slices. 3D MRE data were reconstructed inline using a previously described 3D inversion4 (GE) or a prototype 3D MRE inversion algorithm (Siemens). In 22/30 patients storage modulus (G’) and loss modulus (G’’) were also reconstructed in addition to the default magnitude of the complex shear modulus output |G*|. For 2D and 3D MRE, liver and spleen ROIs were prescribed using ImageJ software in areas of sufficient wave propagation inside the confidence map, avoiding blood vessels and other structures and staying 1cm away from the organ boundaries. The ratio of spleen to liver stiffness was also determined5. For SWE, 5 valid measurements (indicated by an interquartile range≤ 30% of median value) were acquired in the liver and spleen with the median value recorded. Group differences were tested using Kruskal-Wallis tests, with Mann-Whitney tests used between no PH, PH and CSPH groups. Association between MRE, SWE and HVPG measurements were determined using Spearman correlations. Diagnostic accuracy for prediction of PH and CSPH was assessed through ROC analysis.Results
Liver biopsy revealed cirrhosis in 13/30 patients, with remaining classified as F0 (n=2), F1 (n=2), F2 (n=2) and F3 (n=11). PH was present in 20/30 patients, with 9 of those classified as having CSPH. Mean HVPG was 7.5±5.0 mmHg. Due to massive ascites 2D and 3D MRE failed in the liver and spleen in one patient, with 2D MRE failing in the spleen of another patient. One patient declined to undergo SWE following MRI. Examples of 2D and 3D MRE in no PH, PH and CSPH are shown in Figure 1.3D MRE of the spleen (p=0.003), 2D MRE of the liver (p=0.032) and spleen (p=.010), and spleen storage modulus (p=0.033) and loss modulus (p=0.009) were significantly elevated in patients with CSPH compared to those with no PH/PH (Table 1). SWE liver or spleen stiffness were not significantly different between the groups (Figure 2). PH/CSPH patients also had significantly higher 3D MRE spleen stiffness (p=0.031, Figure 3) and ratio of 3D MRE spleen to liver stiffness than those with no PH (p=0.036).
HVPG was strongly correlated with 3D MRE spleen stiffness (r=0.640, p=0.001; Figure 4) and also significantly correlated with 2D MRE liver (r=0.372, p=0.047) and spleen (r=0.388, p=0.037) stiffness, and spleen storage (r=0.503, p=0.017) and loss modulus (r=0.525, p=0.021). SWE parameters were not correlated with HVPG.
3D MRE spleen stiffness showed excellent diagnostic accuracy in predicting CSPH (AUC=0.882) and reasonable performance in predicting PH (AUC=0.764). 2D MRE spleen stiffness was also a good predictor of CSPH (AUC=0.811). 3D MRE liver to spleen ratio had reasonable performance in predicting PH (AUC=0.757) but was not better than 3D MRE spleen stiffness alone.
Discussion
Results from this ongoing study suggest that spleen MRE parameters, particularly 3D MRE, are sensitive to changes associated with PH. 3D MRE showed excellent diagnostic performance in predicting CSPH amongst the cohort, outperforming 2D MRE. 3D MRE spleen stiffness was also the measure most strongly correlated with HVPG. Our results are in line with previous animal6 and human7 studies showing spleen MRE stiffness correlating with HVPG measurements. SWE did not appear to be useful in assessing PH severity in this study.Conclusion
3D MRE spleen stiffness appears to the most promising surrogate marker for predicting CSPH. This may be of clinical benefit enabling the non-invasive diagnosis of CSPH before severe complications such as acute variceal bleeding occur.Acknowledgements
This research was supported by NIDDK grant 1R01DK113272. Many thanks to Stephan Kannengiesser and Michael Bush of Siemens Healthcare for disseminating the prototype MRE sequences and providing support.References
- de Franchis R. Expanding consensus in portal hypertension: Report of the Baveno VI Consensus Workshop: Stratifying risk and individualizing care for portal hypertension. Journal of Hepatology 2015;63(3):743-752.
- Dyvorne HA, Jajamovich GH, Besa C, Cooper N, Taouli B. Simultaneous measurement of hepatic and splenic stiffness using MR elastography: preliminary experience. Abdom Imaging 2015;40(4):803-809.
- Dzyubak B, Glaser K, Yin M, et al. Automated Liver Stiffness Measurements with Magnetic Resonance Elastography. Journal of magnetic resonance imaging : JMRI 2013;38(2):371-379.
- Shi Y, Glaser KJ, Sudhakar VK, Ben-Abraham EI, Ehman RL. Feasibility of Using 3D MR Elastography to Determine Pancreatic Stiffness in Healthy Volunteers. Journal of magnetic resonance imaging : JMRI 2015;41(2):369-375.
- Grgurevic I, Puljiz Z, Brnic D, et al. Liver and spleen stiffness and their ratio assessed by real-time two dimensional-shear wave elastography in patients with liver fibrosis and cirrhosis due to chronic viral hepatitis. European Radiology 2015;25(11):3214-3221.
- Nedredal GI, Yin M, McKenzie T, et al. Portal hypertension correlates with splenic stiffness as measured with MR elastography. Journal of magnetic resonance imaging: JMRI 2011;34(1):79-87.
- Ronot M, Lambert S, Elkrief L, et al. Assessment of portal hypertension and high-risk oesophageal varices with liver and spleen three-dimensional multifrequency MR elastography in liver cirrhosis. European Radiology 2014;24(6):1394-1402.
Figures

Figure 1: Illustrative examples showing anatomical images (top row),
2D MRE elastograms (middle row) and 3D MRE elastograms (bottom row) in a 60 yr
old male with no PH (left), a 78 yr old female with PH (middle) and a 65 yr old
male with clinically significant PH (right). HVPG, liver stiffness (LS), spleen
stiffness (SS) and spleen to liver ratio are also shown.
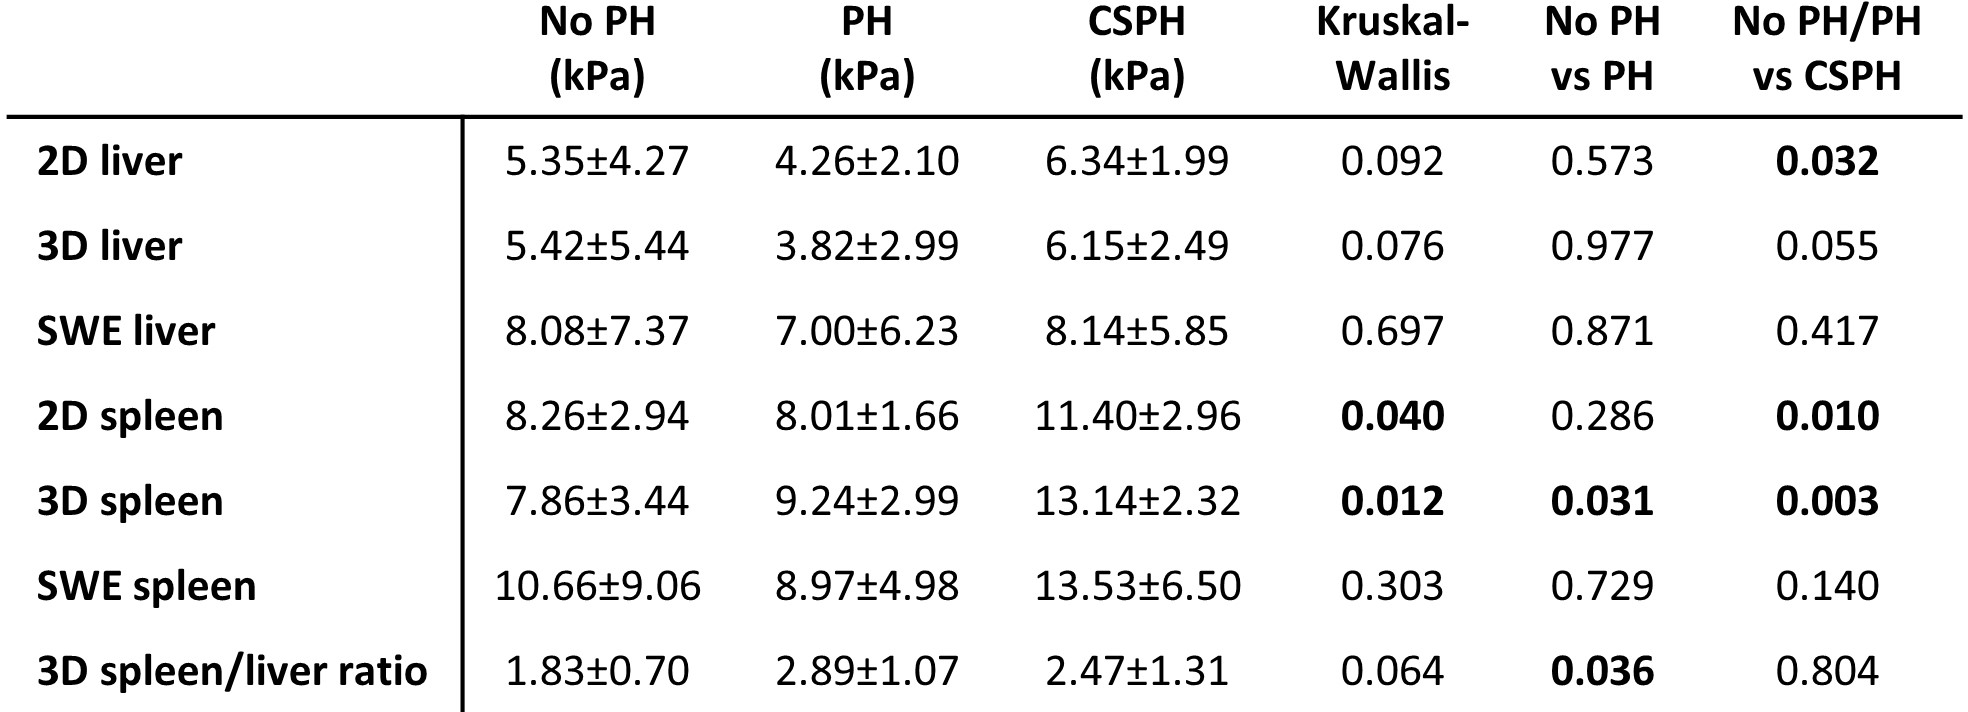
Table 1: Mean±SD
of liver and spleen measurements acquired with 2D and 3D MRE and SWE. P-values
from Kruskal-Wallis group tests and Mann-Whitney U tests are also shown.
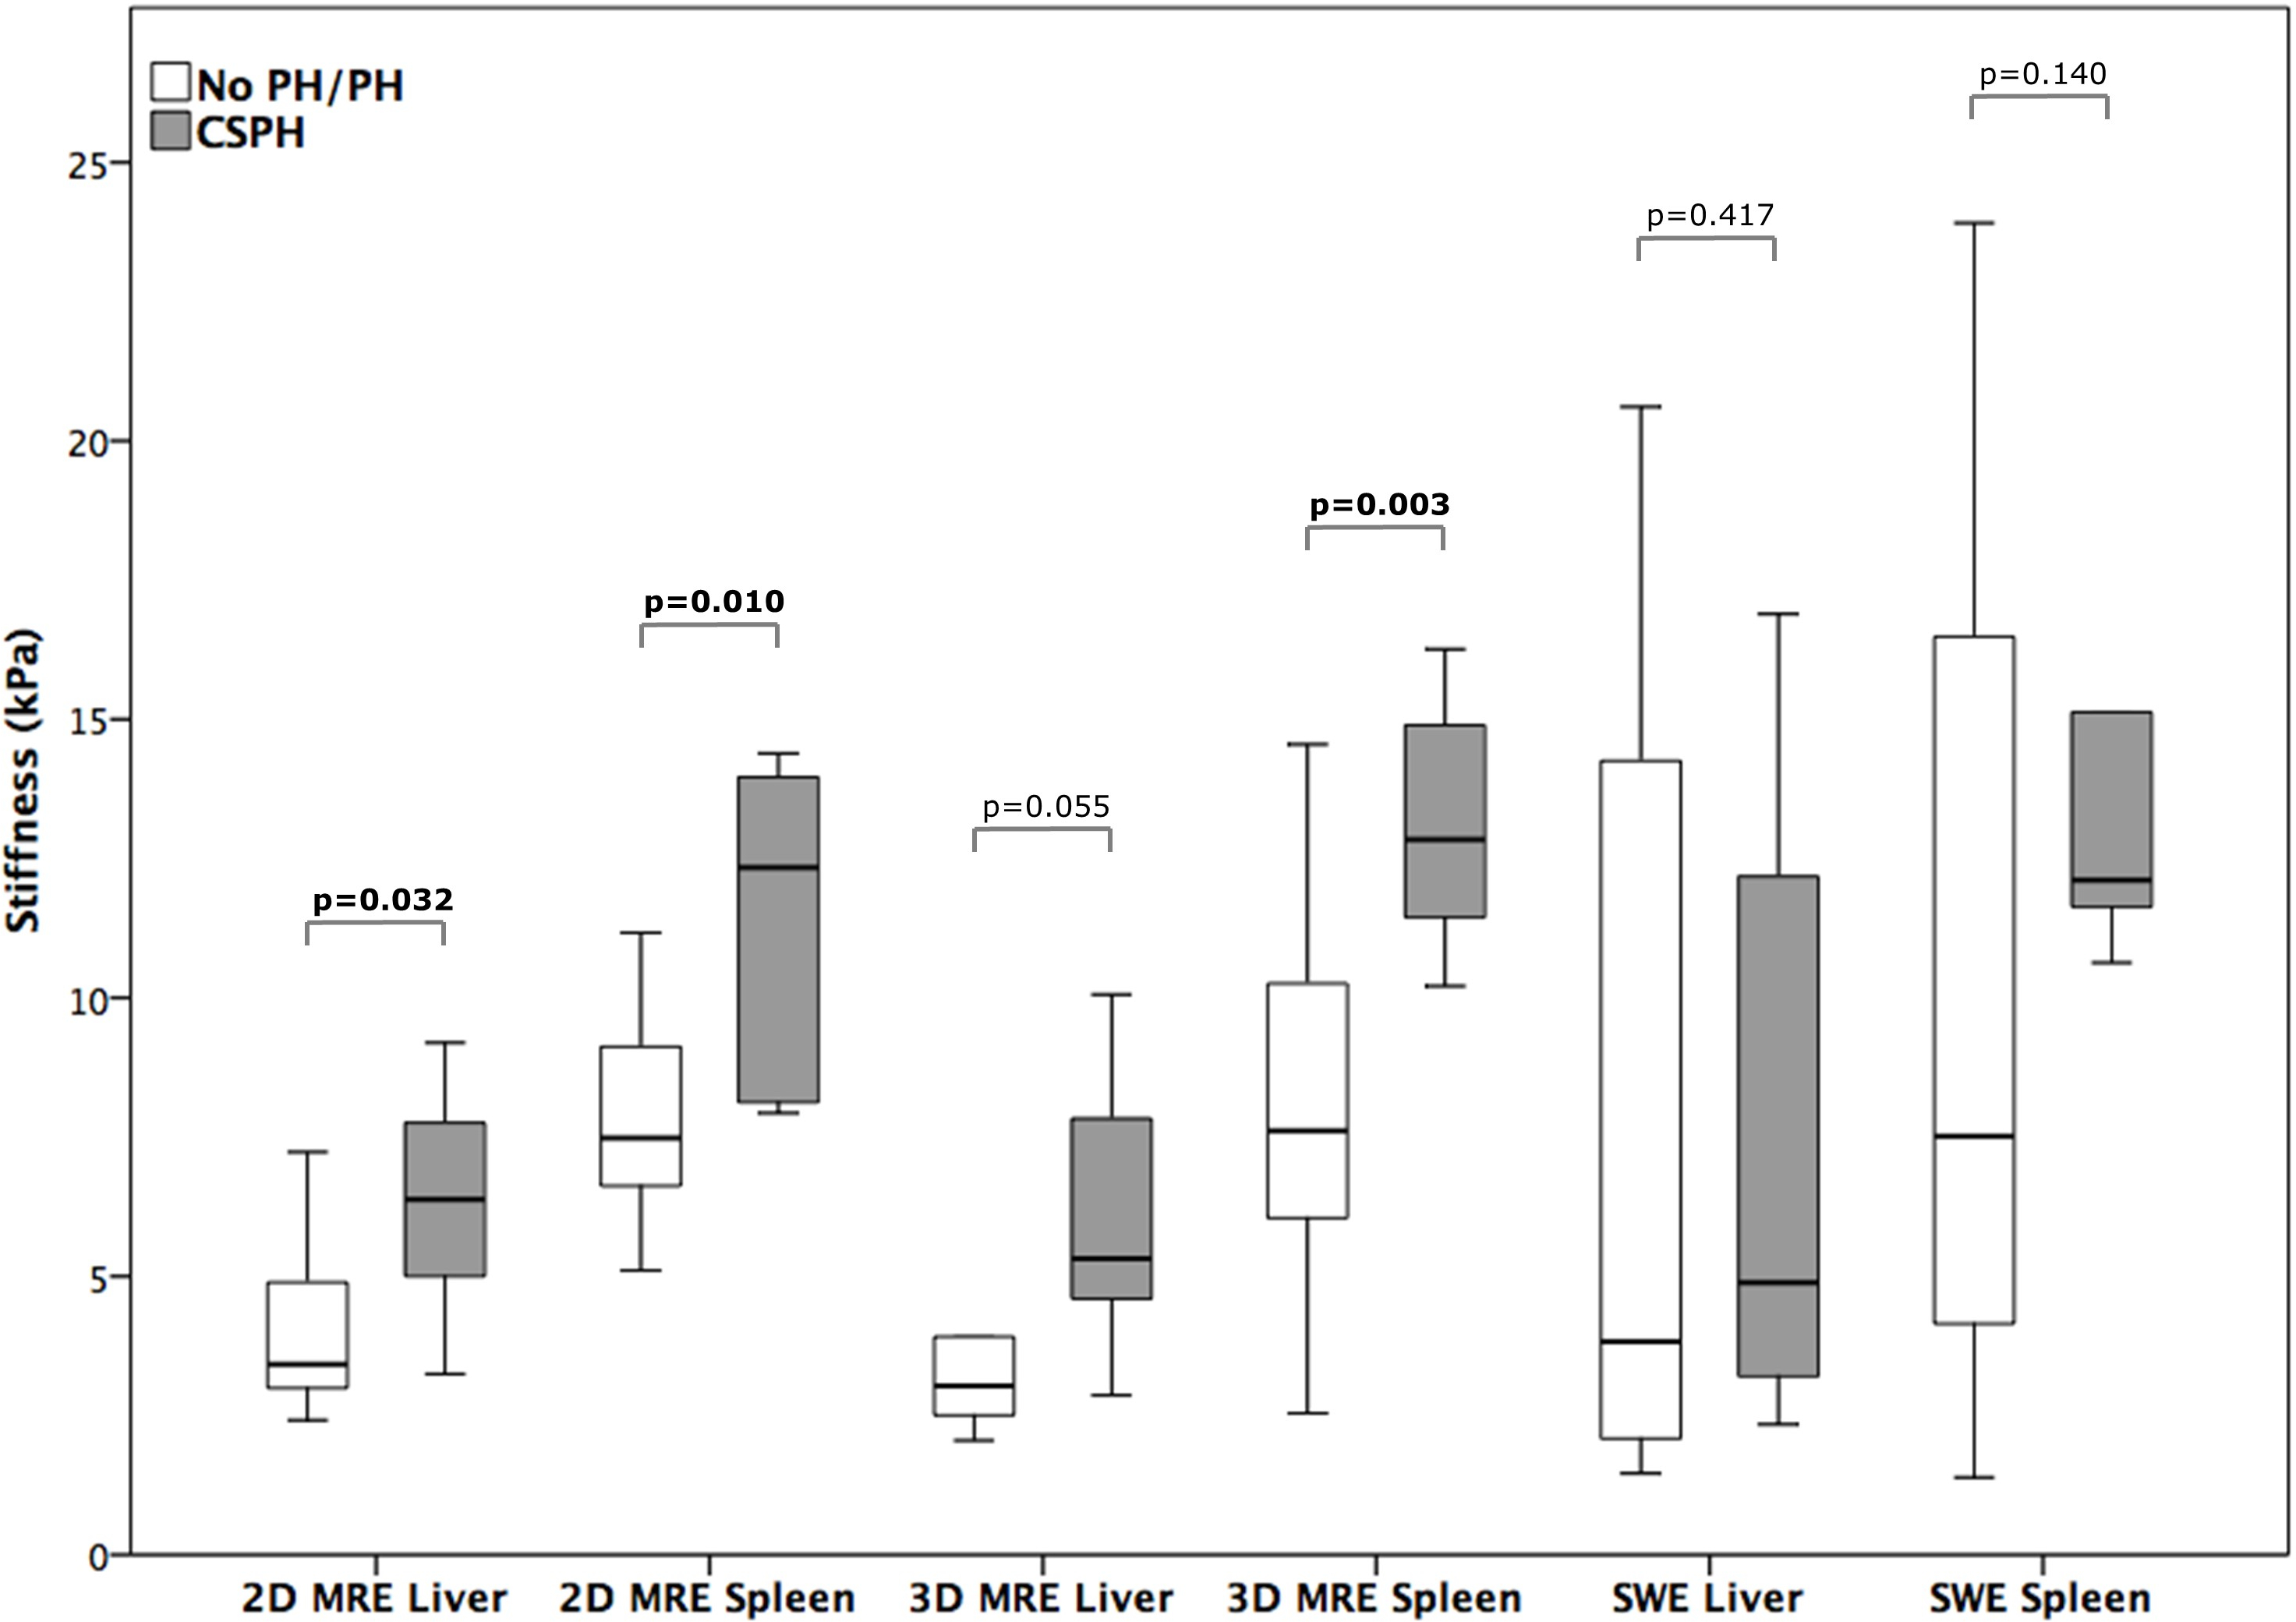
Figure 2: Boxplots showing liver and spleen stiffness of no PH and
CSPH patients measured with 2D and 3D MRE and SWE.
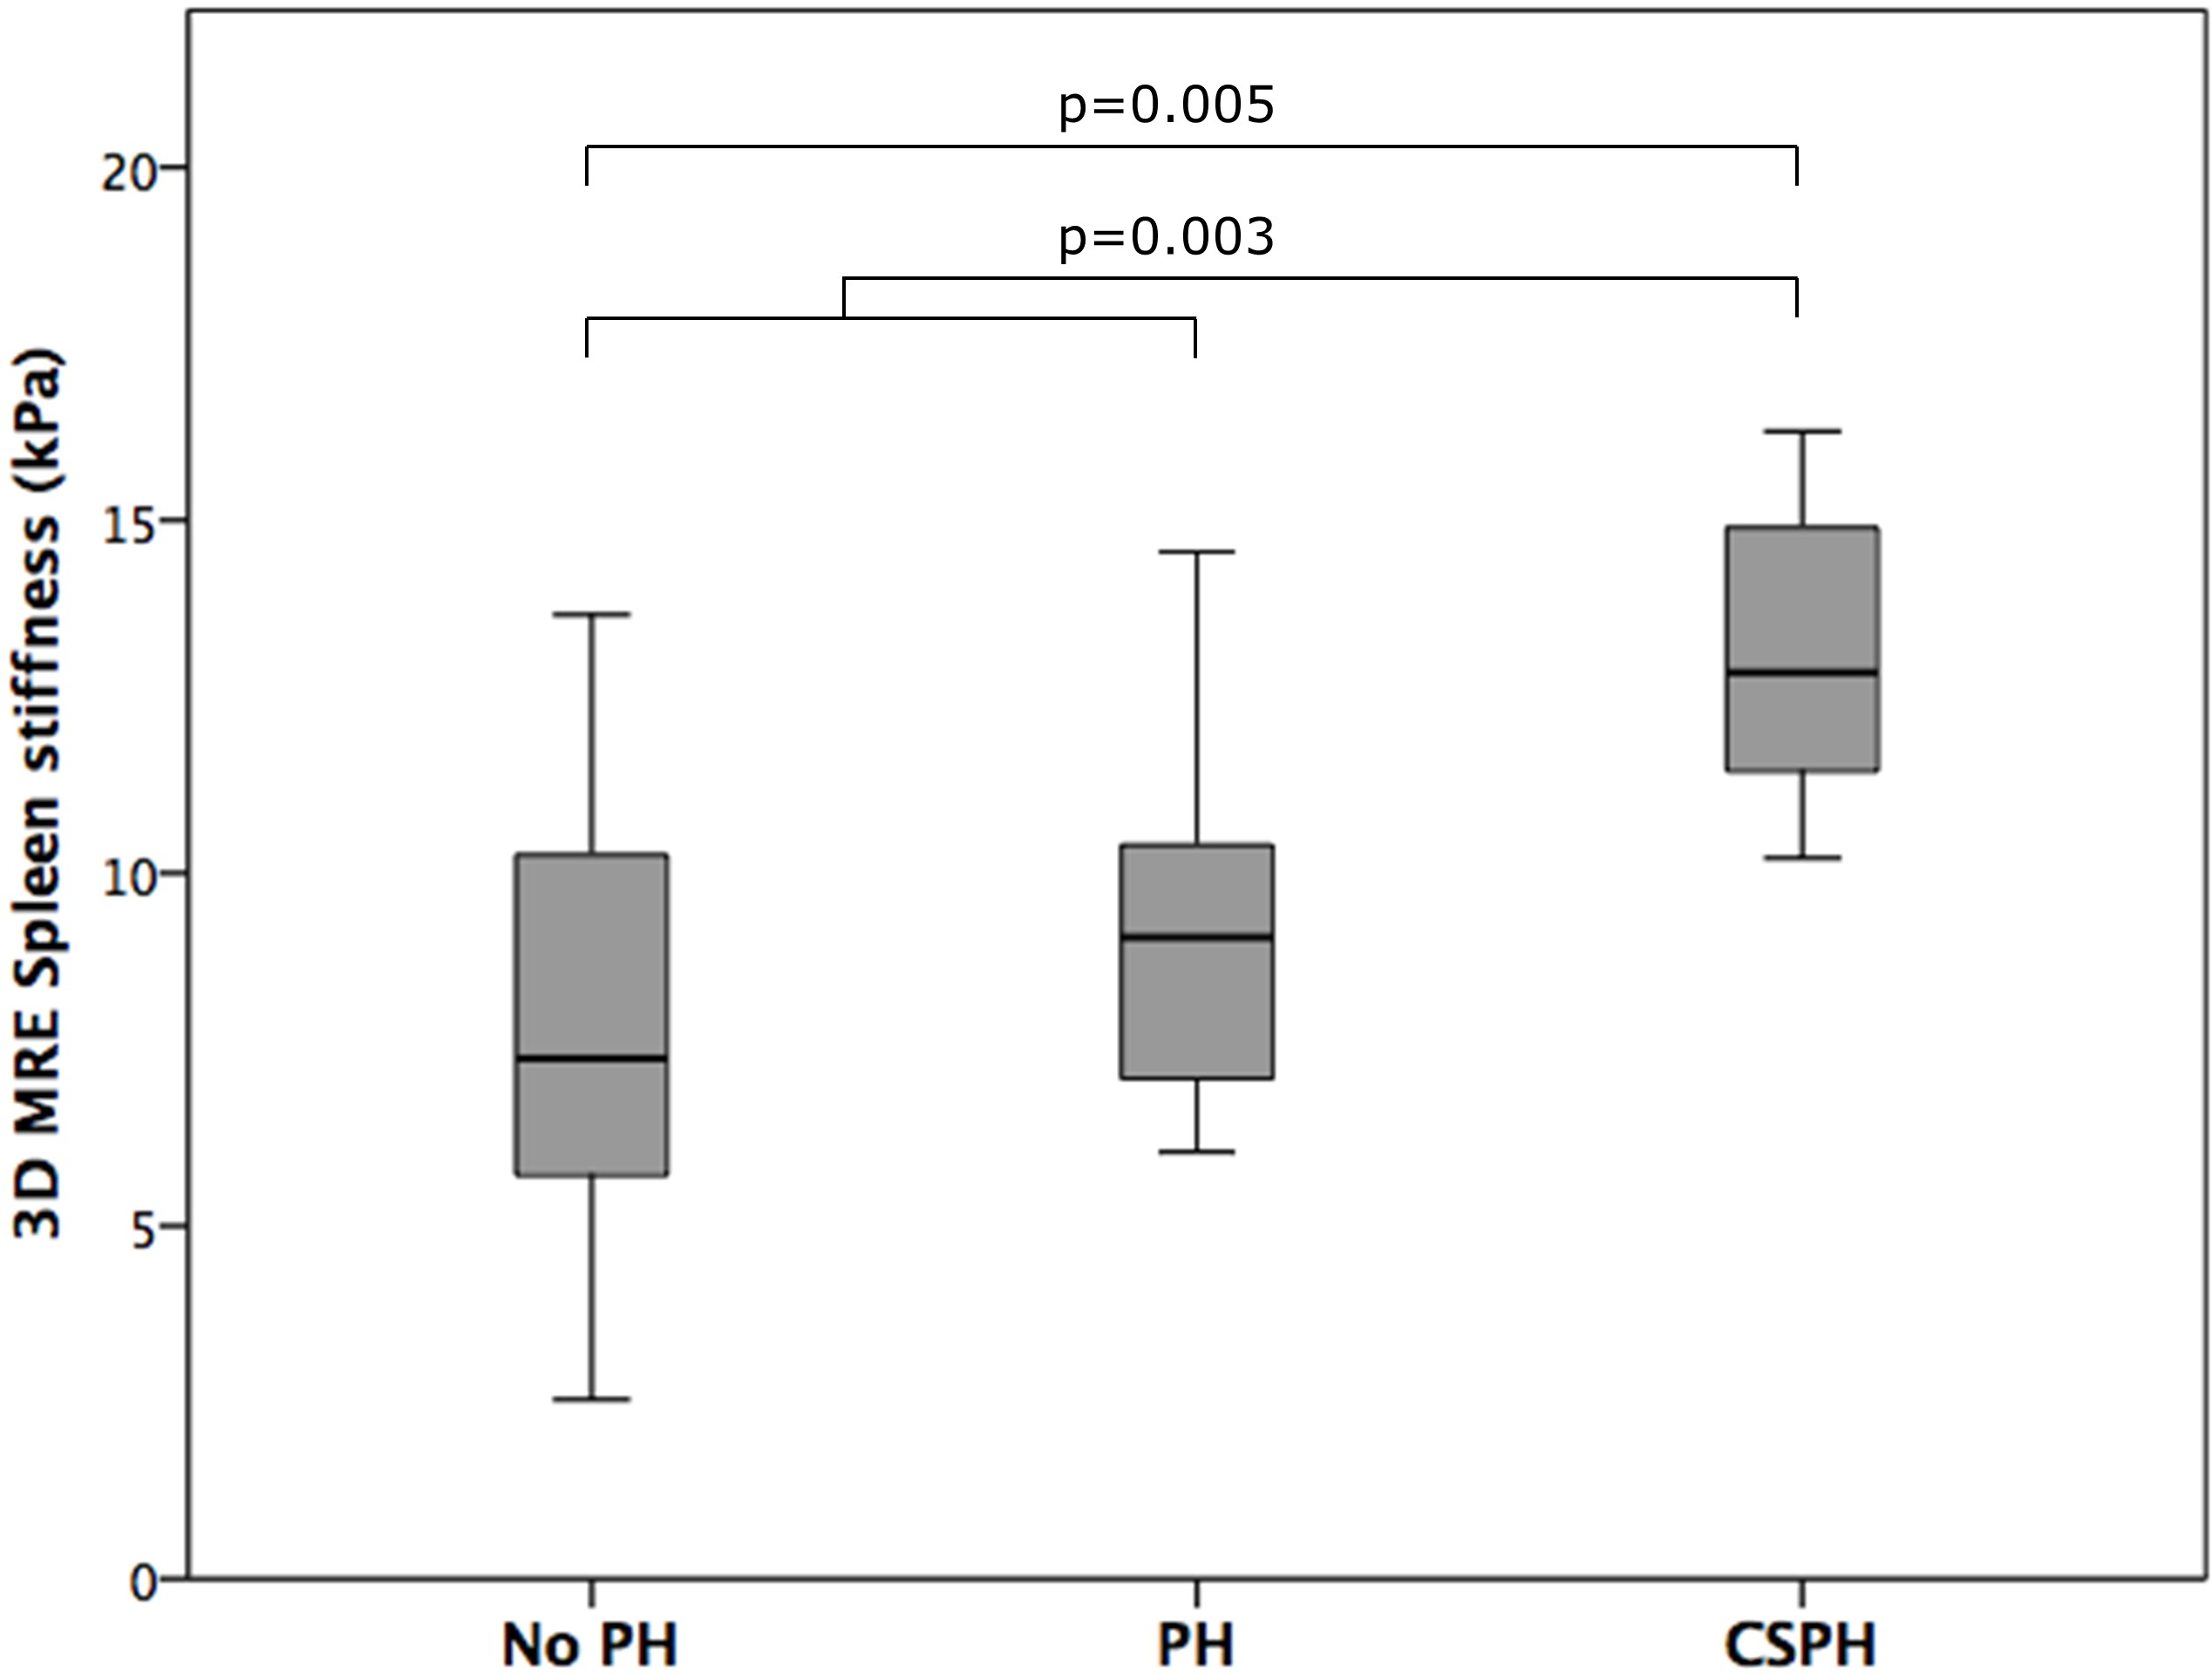
Figure 3: Boxplot showing the ability of 3D MRE spleen stiffness to
differentiate patients with no PH and those with CSPH, and combined no PH/PH
patients with CSPH patients.
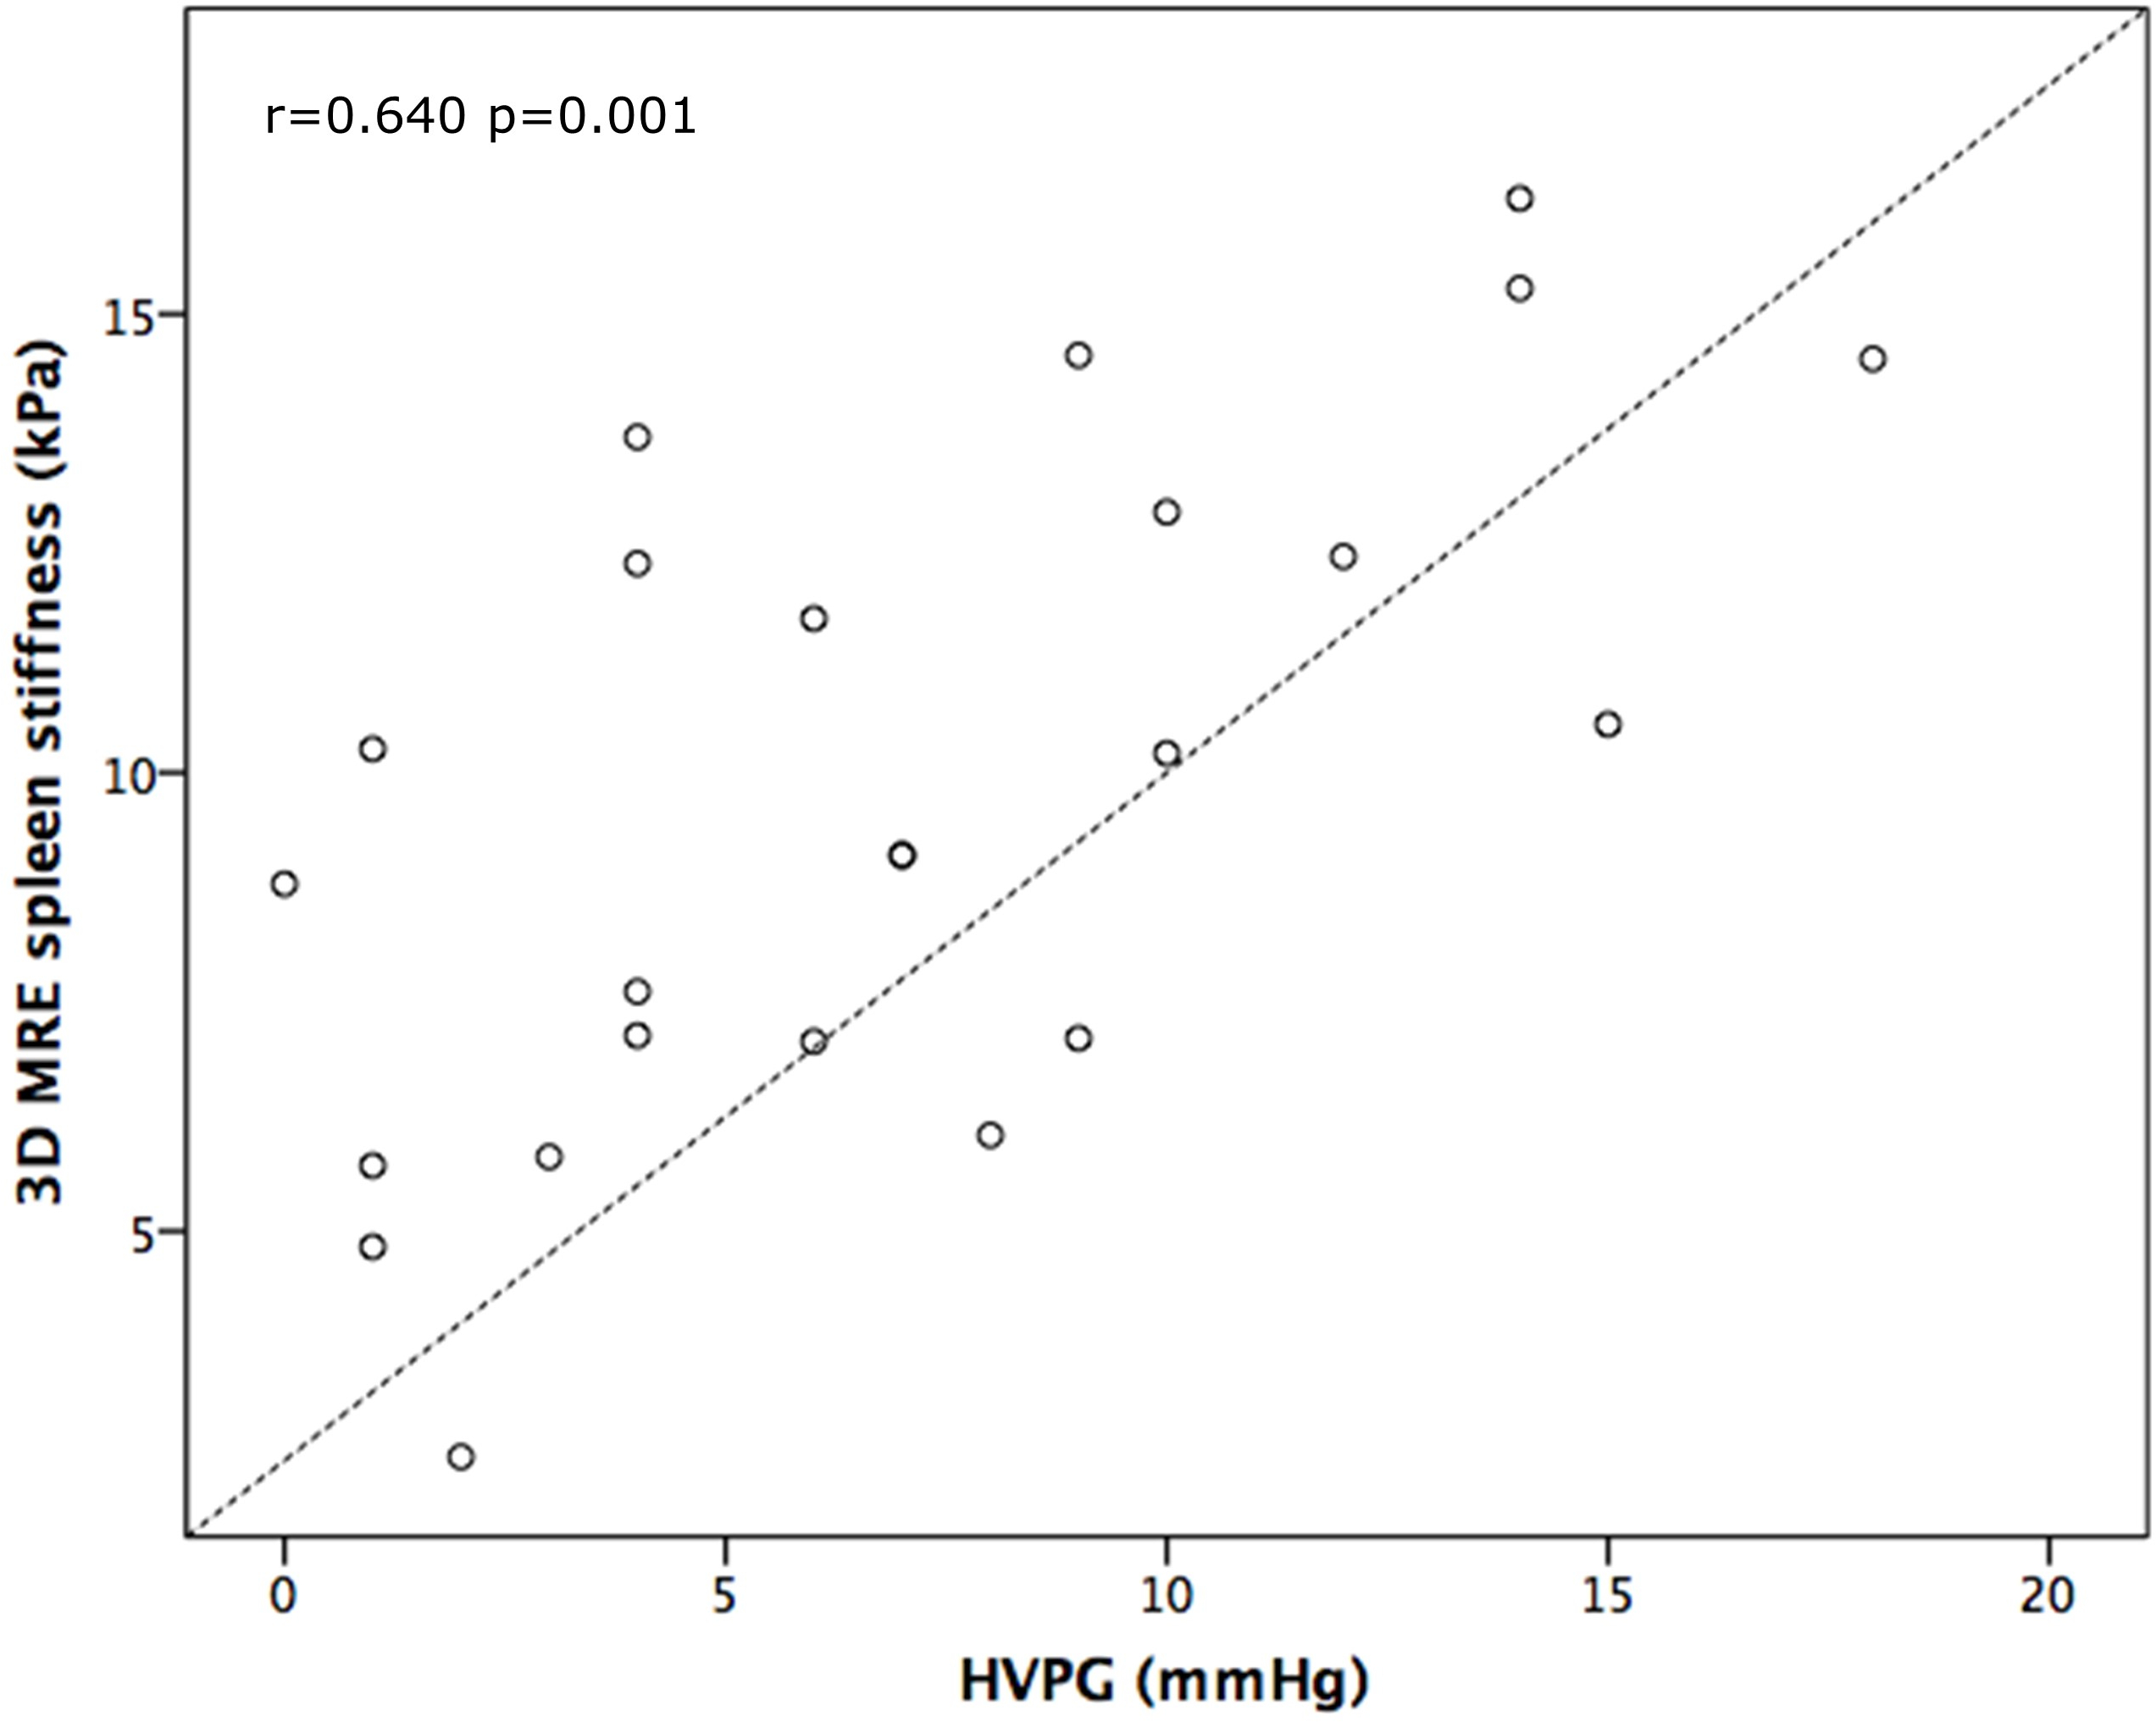
Figure 4: Scatter plot showing the correlation between HVPG
measurement and 3D MRE spleen stiffness. Dashed line represents linear fit of
the data.