0325
Six-Dimensional Quantitative DCE MR Multitasking in the Characterization of Pancreatic Ductal Adenocarcinoma Versus Chronic Pancreatitis1Biomedical Imaging Research Institute, Cedars-Sinai Medical Center, Los Angeles, CA, United States, 2Bioengineering, University of California, Los Angeles, Los Angeles, CA, United States, 3Division of Digestive and Liver Diseases, Cedars-Sinai Medical Center, Los Angeles, CA, United States, 4Chaoyang Hospital, Beijing, China
Synopsis
The differentiation of pancreatic ductal adenocarcinoma (PDAC) and chronic pancreatitis (CP) is crucial to the diagnosis and prognosis of PDAC. DCE MRI serves as a promising imaging tool, but still faces several technical challenges. In this work, we evaluated the characterization of PDAC versus CP using the proposed Multitasking DCE technique, which enables free-breathing acquisition, 3D whole-abdomen coverage, high temporal resolution at 500ms, and dynamic T1 mapping throughout all DCE phases. In vivo studies on 16 healthy volunteers, 14 PDAC patients, and 8 CP patients demonstrated the capability of Multitasking DCE in differentiating normal pancreas, PDAC, and CP.
Introduction
Pancreatic ductal adenocarcinoma (PDAC) is the 3rd leading cause of death in the US with a 5-year survival rate at 8%1,2. Accurate diagnosis of PDAC is crucial to overall survival. Under some circumstances, however, PDAC and chronic pancreatitis (CP) are difficult to differentiate due to the shared clinical and radiological features, causing delayed diagnosis and potentially decreased survival3-5. Abdominal DCE MRI has the potential to distinguish PDAC from CP4 but continues to face technical challenges, including: 1) a breath-holding requirement to reduce respiratory artifacts; 2) compromises among spatial resolution, temporal resolution and adequate coverage due to sampling conflicts; and 3) errors introduced by the linear approximation from T1-weighted signal intensity to contrast agent (CA) concentration. To address these limitations, we previously proposed a novel DCE technique based on MR Multitasking, which enables free-breathing acquisition, 3D whole-abdomen coverage, high temporal resolution at 500ms, and dynamic T1 mapping throughout all DCE phases for accurate CA concentration quantification6. In this work, we evaluated the characterization of PDAC versus CP using the Multitasking DCE technique.Methods
Sequence and sampling design: As described previously7, periodic non-selective SR preparations followed by 3D FLASH readouts were used to generate T1 contrast, while a 3D randomized Cartesian sampling pattern was designed for data acquisition. A center k-space line placed in the superior-inferior direction was acquired every 8 readouts as training data.Reconstruction: The 6-dimensional image $$$I(x,y,z,{\tau},t_{r}, t_{d})$$$ with three spatial dimensions, SR dimension $$$\tau$$$, respiration dimension $$$t_{r}$$$, and DCE time course $$$t_{d}$$$ was formulated as a 4-way tensor $$$\mathcal{A}$$$ with voxel index $$$\mathbf{r}=(x,y,z)$$$, $$$\tau$$$, $$$t_{r}$$$, and $$$t_{d}$$$. $$$\mathcal{A}$$$ is low-rank due to multi-dimensional image correlation and thus can be partially separated as $$$\mathbf{A}_{(1)}=\mathbf{U}\mathbf{\Phi}$$$, where $$$\mathbf{A}_{(1)}$$$ is the mode-1 matricization of $$$\mathcal{A}$$$, $$$\mathbf{U}$$$ is the spatial factor, and $$$\mathbf{\Phi}$$$ contains basis functions describing the dynamics for the three temporal dimensions8. For image reconstruction, $$$\mathbf{\Phi}$$$ was first determined by the SVD of low-rank tensor-completed training data. $$$\mathbf{U}$$$ was then recovered by fitting $$$\mathbf{\Phi}$$$ to the acquired imaging data $$$\mathbf{d}$$$ by solving: $$\widehat{\mathbf{U}}=\arg\min_{\mathbf{U}}\|\mathbf{d}-\Omega(\mathbf{F}\mathbf{S}\mathbf{U}\mathbf{\Phi})\|_{2}^{2}+R(\mathbf{U}),$$with undersampling operator $$$\Omega$$$, Fourier transform operator $$$\mathbf{F}$$$, coil sensitivity operator $$$\mathbf{S}$$$, and spatial total-variation penalty $$$R(\cdot)$$$7.
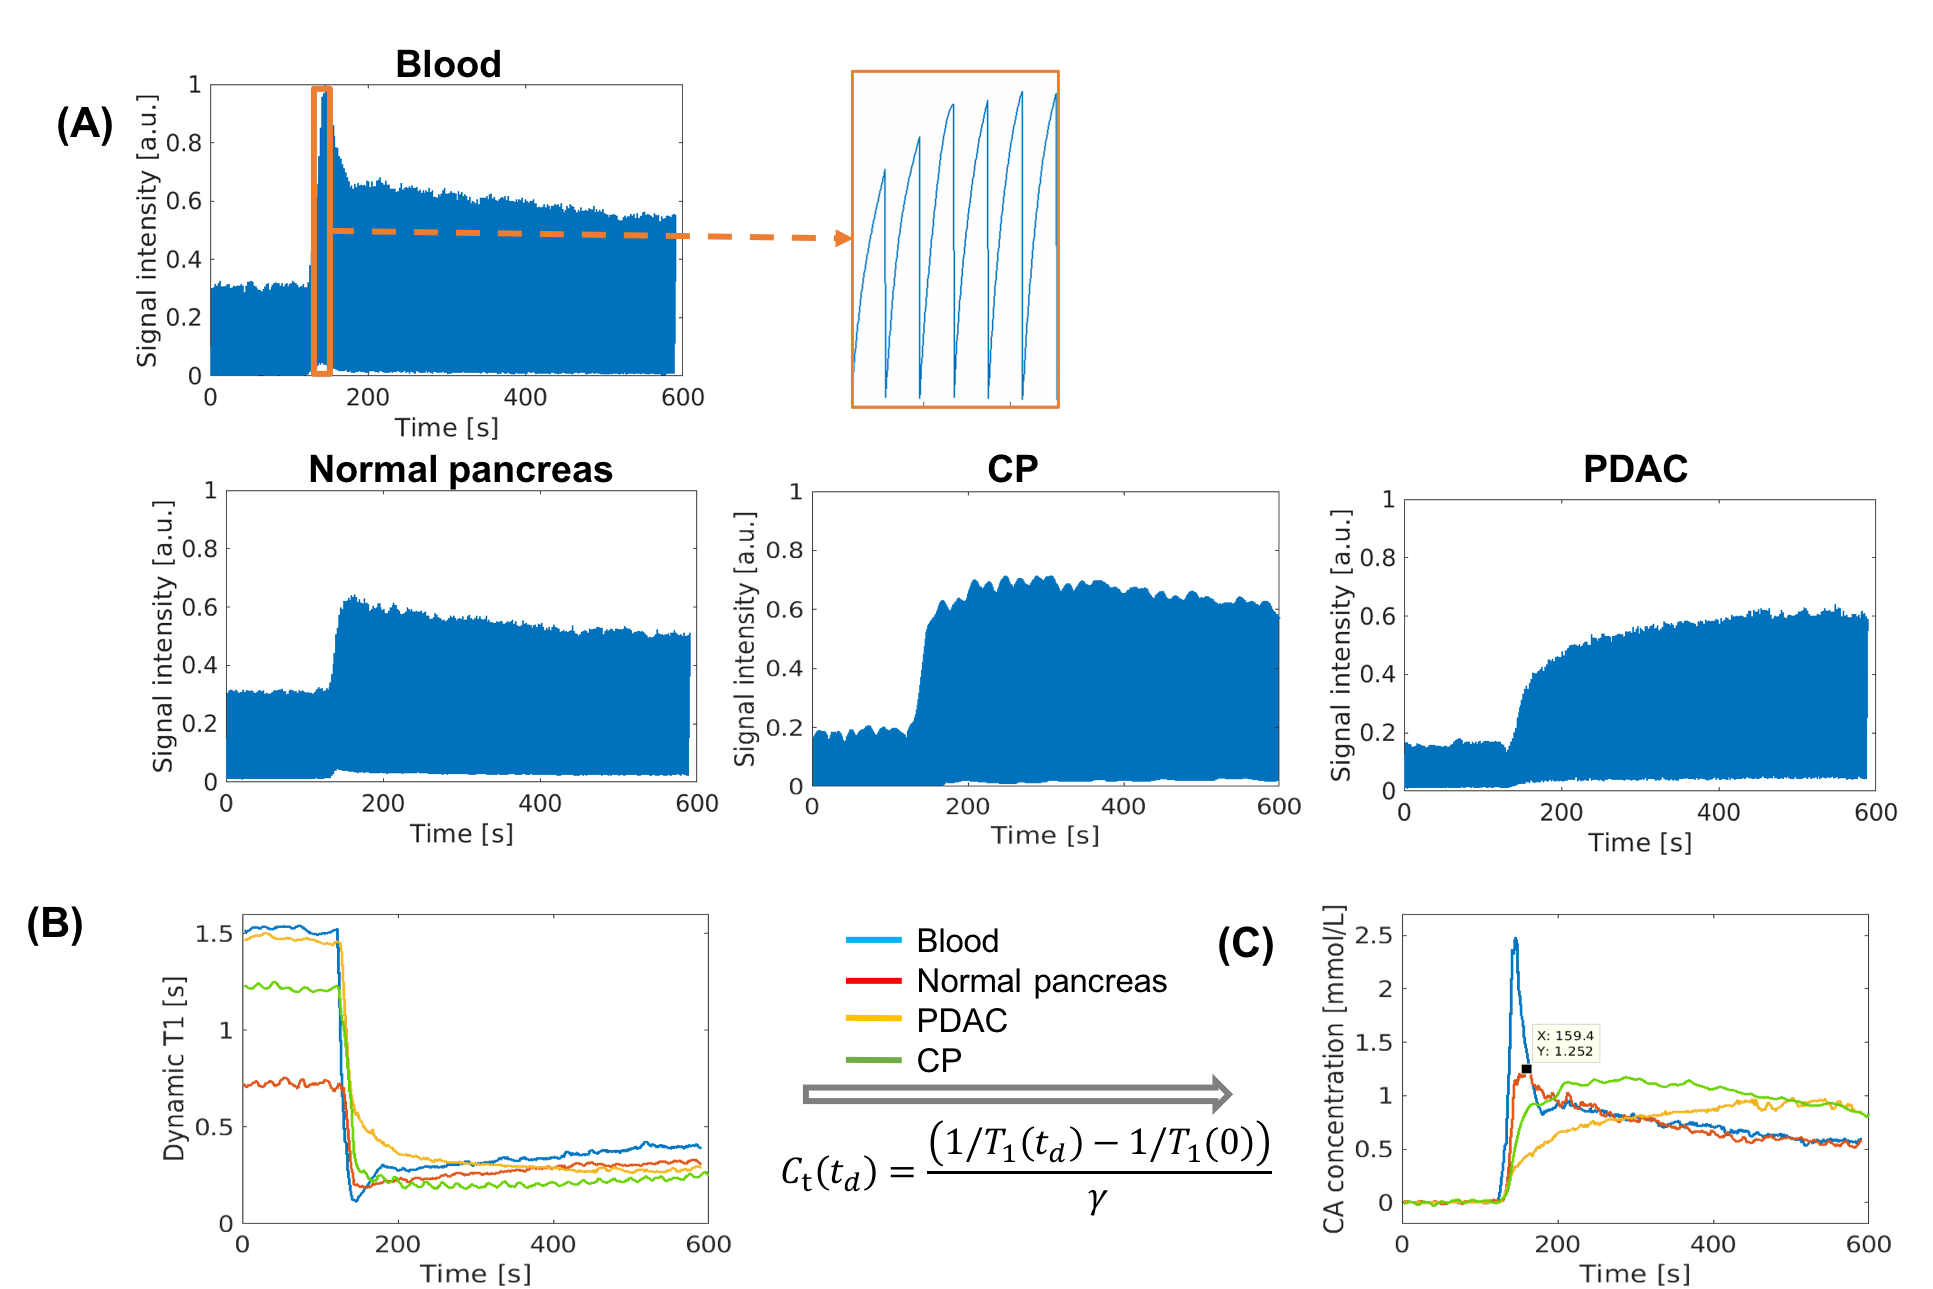
Dynamic T1 quantification and kinetic modeling: The dynamic T1 was fitted based on the SR-FLASH equation:$$s\left(A,\alpha,B,n,T_{1}(t)\right)=A\frac{1-e^{-T_{R}/T_{1}(t)}}{1-e^{-T_{R}/T_{1}(t)}\cos\alpha}\left[1+(B-1)\left(e^{-T_{R}/T_{1}(t)}\cos\alpha\right)^{n}\right]\sin\alpha ,$$with amplitude $$$A$$$, flip angle $$$\alpha$$$, SR efficiency parameter $$$B$$$, and readout indices $$$n=1, 2, ..., 84$$$. The CA concentration was quantified subsequently according to the relaxivity7. The extended two-compartment Tofts model was implemented for the kinetic modeling9.
Imaging experiment: All data were acquired on a 3T scanner (VIDA, Siemens) in transversal orientation with the following parameters: TE/TR=2.6/5.5ms, FOV=380x268x360mm3, spatial resolution=1.2x1.2x3mm3, SR period=DCE temporal resolution=500ms, Flip angle=8°, scan time=9.2min. Gd contrast media (Gadavist, 0.1mmol/kg) was administered 2 minutes into the scan at the rate of 2.0ml/s. Reference images including 3D T1-VIBE and multi-slice single-shot EPI DWI were also acquired.
In vivo study: Sixteen healthy volunteers without a history of pancreatic disease were recruited as control group. Fourteen patients with the presence of histopathologically confirmed PDAC and eight patients meeting Cambridge criteria for CP were enrolled.
Image analysis: The pancreas and tumor boundary of each subject was defined by a radiologist (LW) with 11-year experience in reading MR images for pancreas based on reference images and clinical CT images. The kinetic parameters were evaluated for the following four regions: 1) normal pancreas in control group; 2) tumor in PDAC group; 3) nontumoral pancreas in PDAC group; and 4) diseased pancreas in CP group.
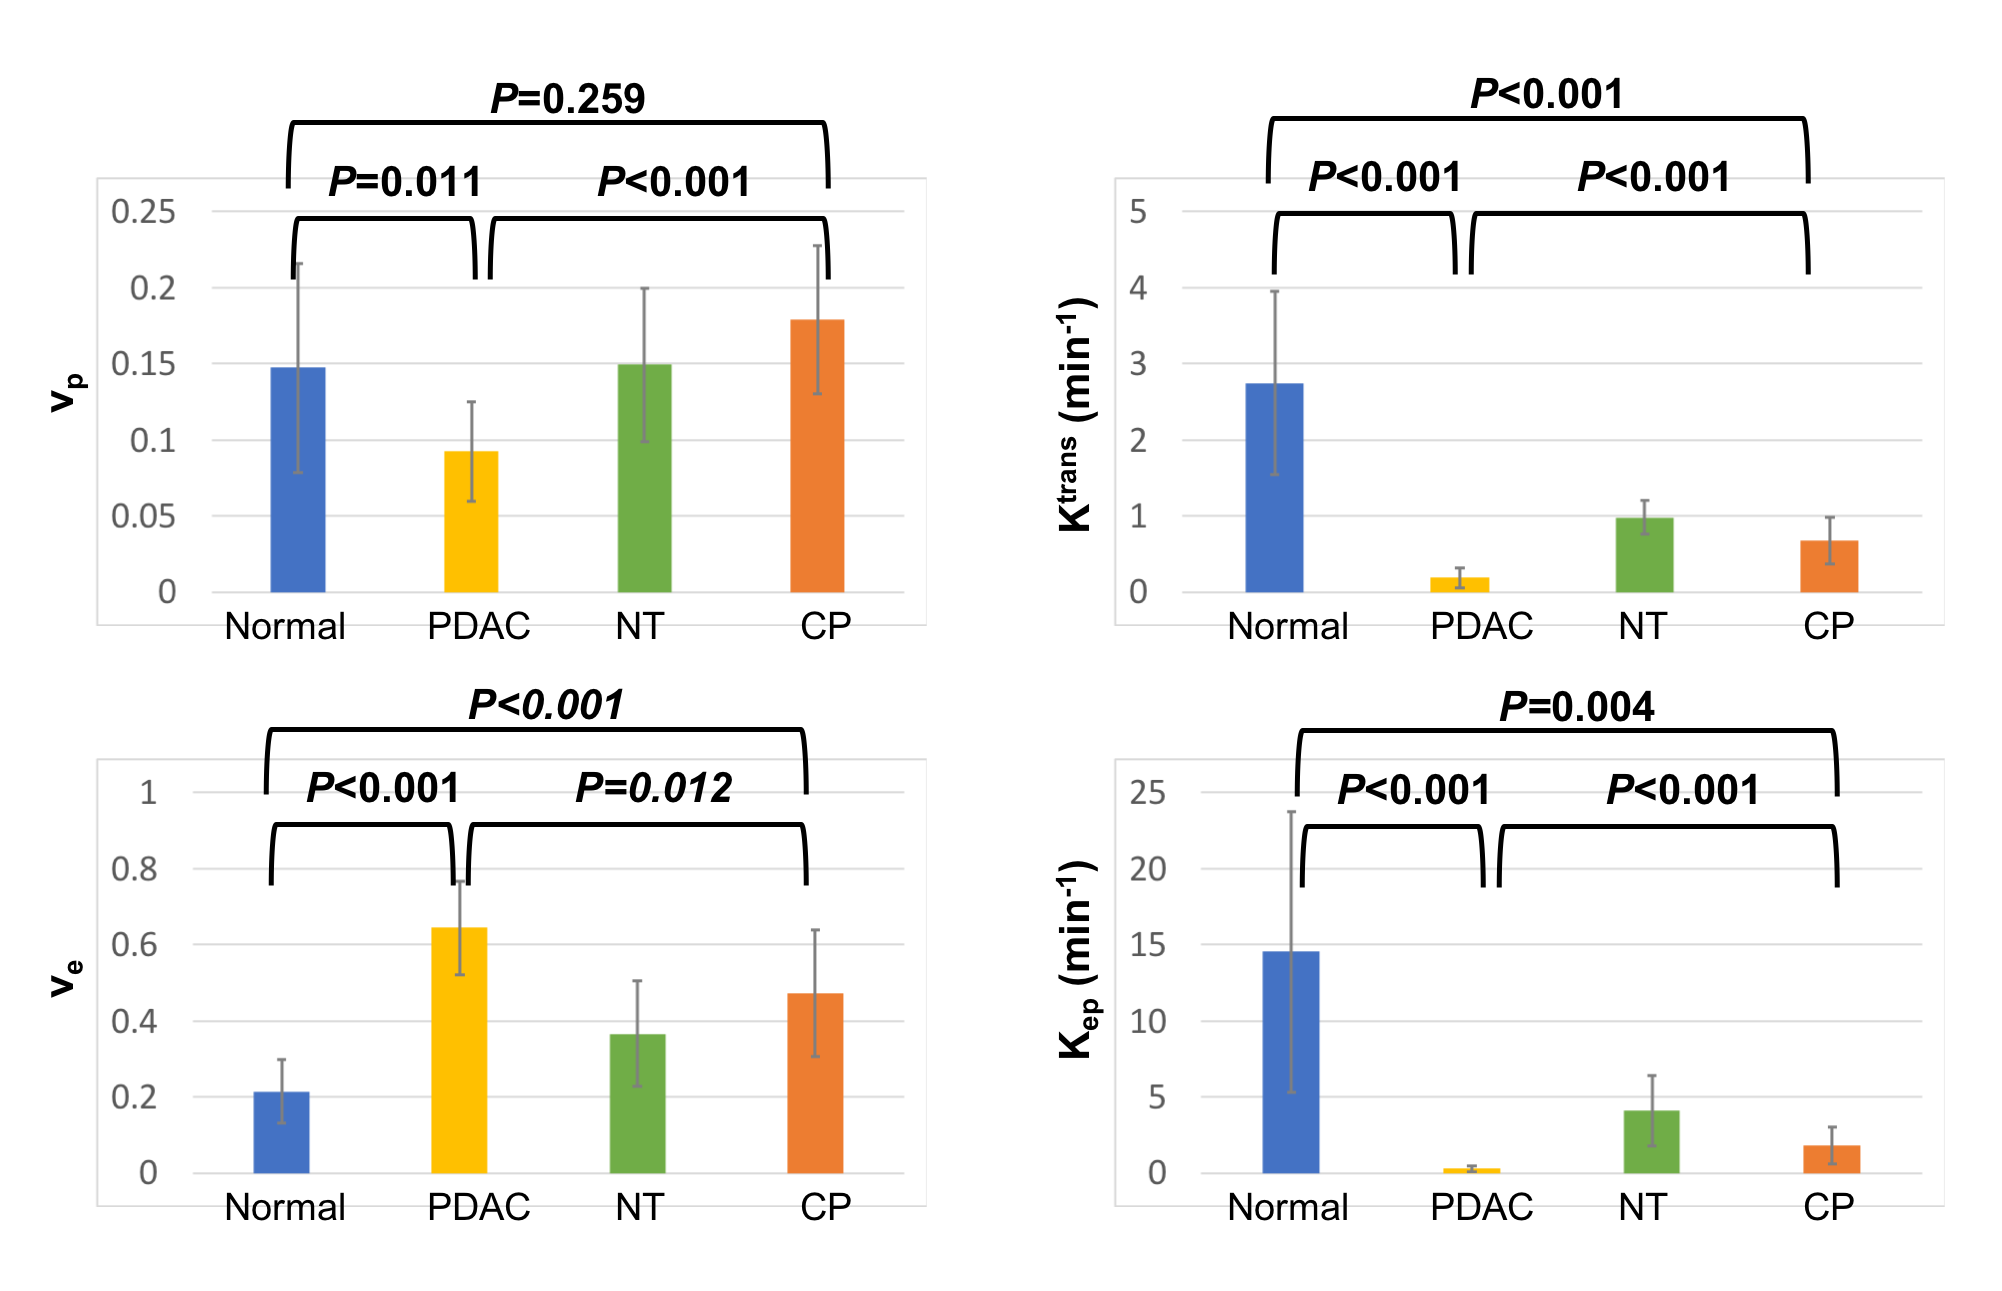
Statistical analysis: A significance test using one-way unbalanced ANOVA was applied to identify the significant difference of vp, Ktrans, ve, and Kep obtained between each pair of regions. Holm-Bonferroni correction was implemented to correct for multi-group test.
Results
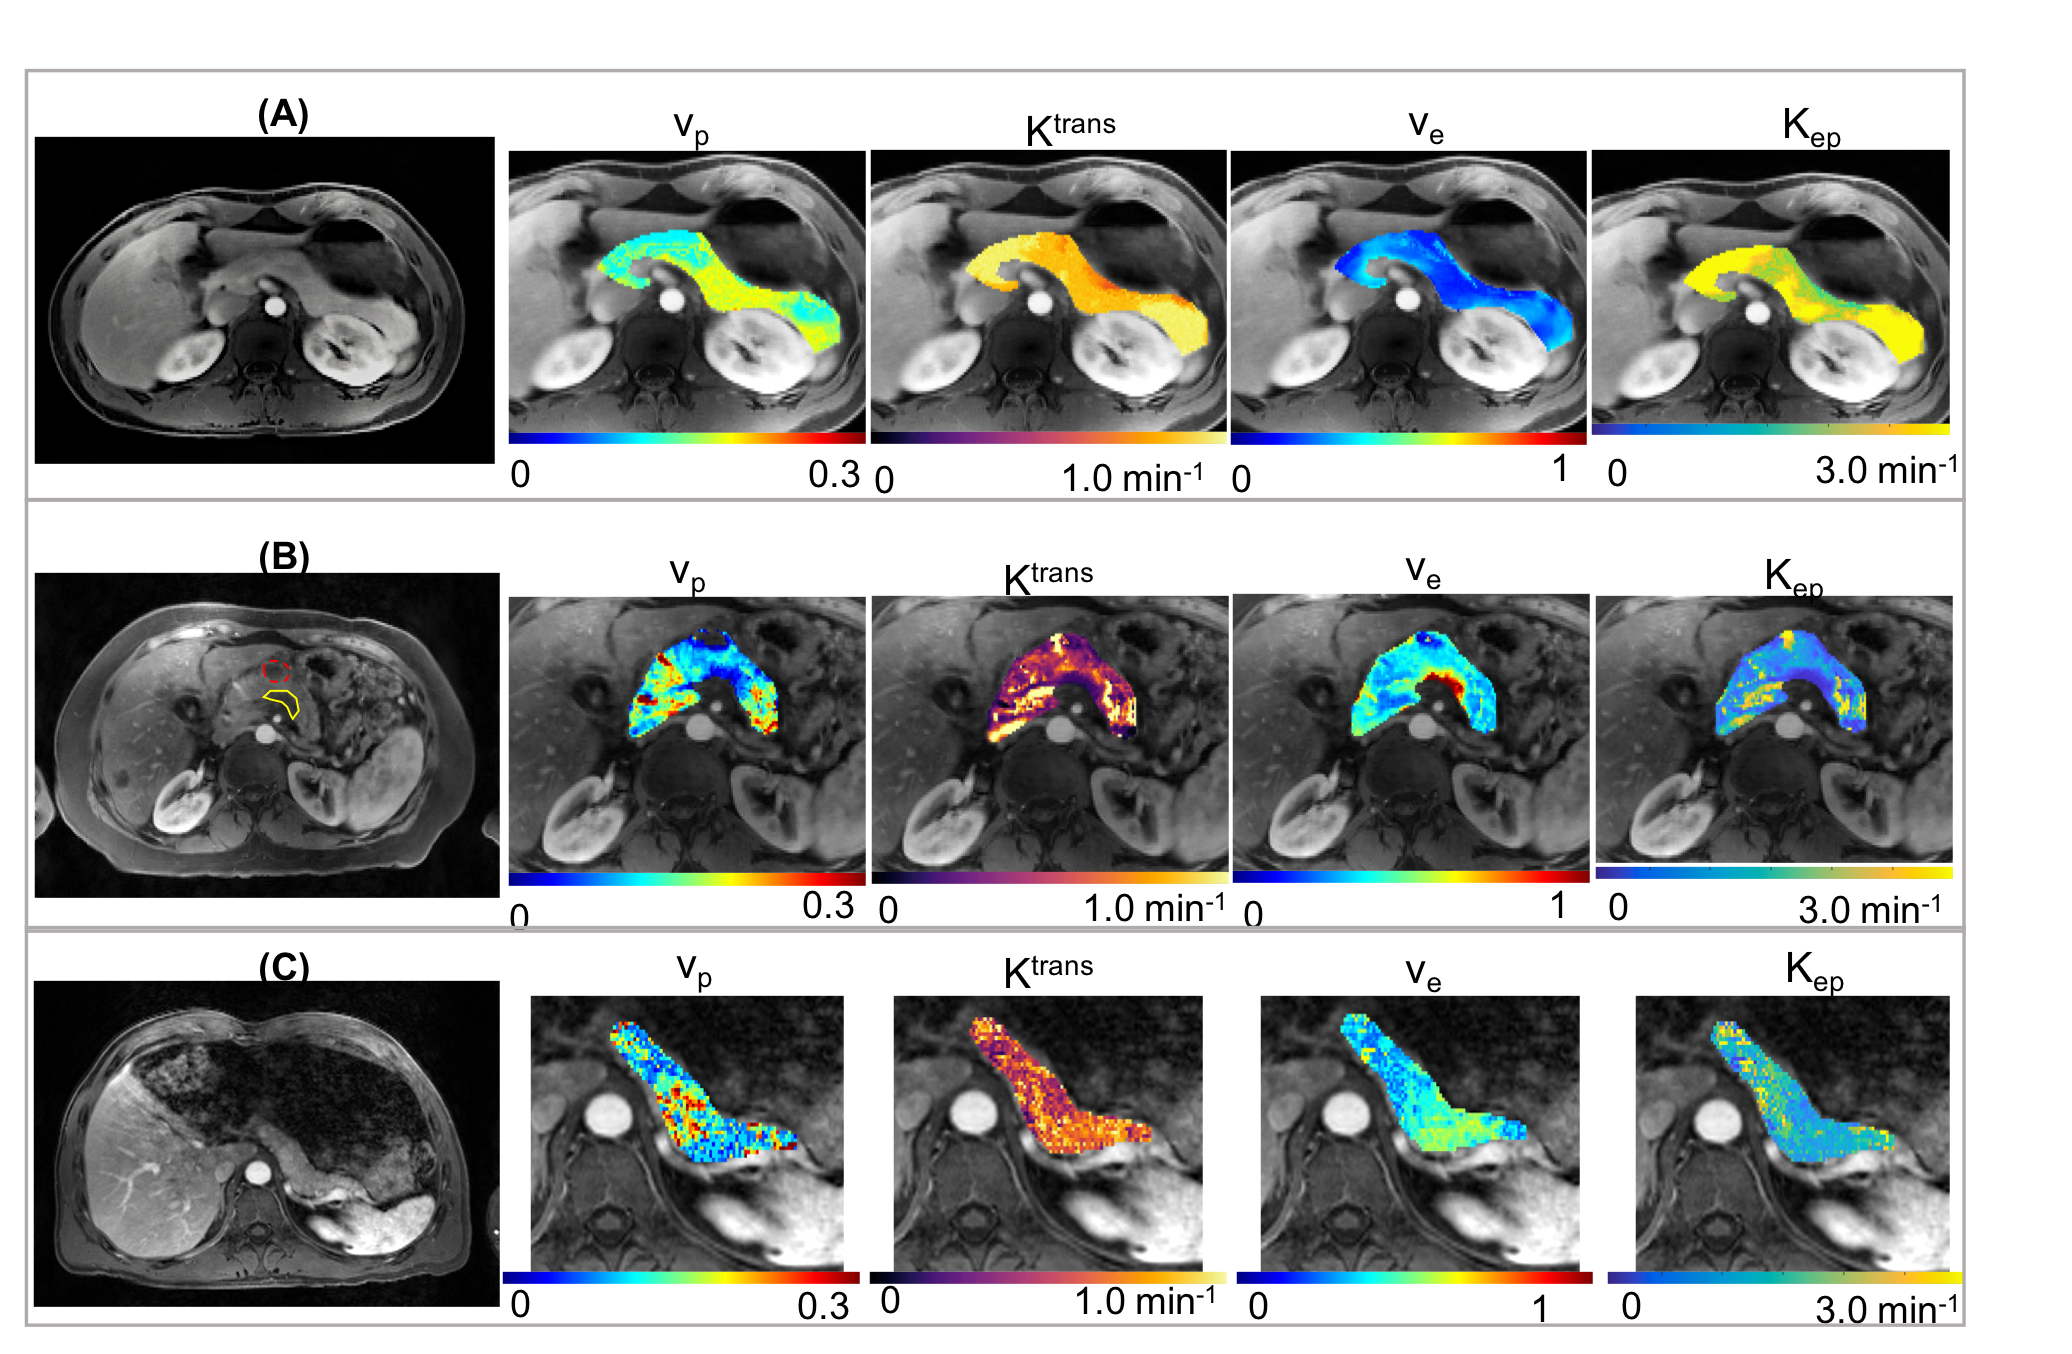
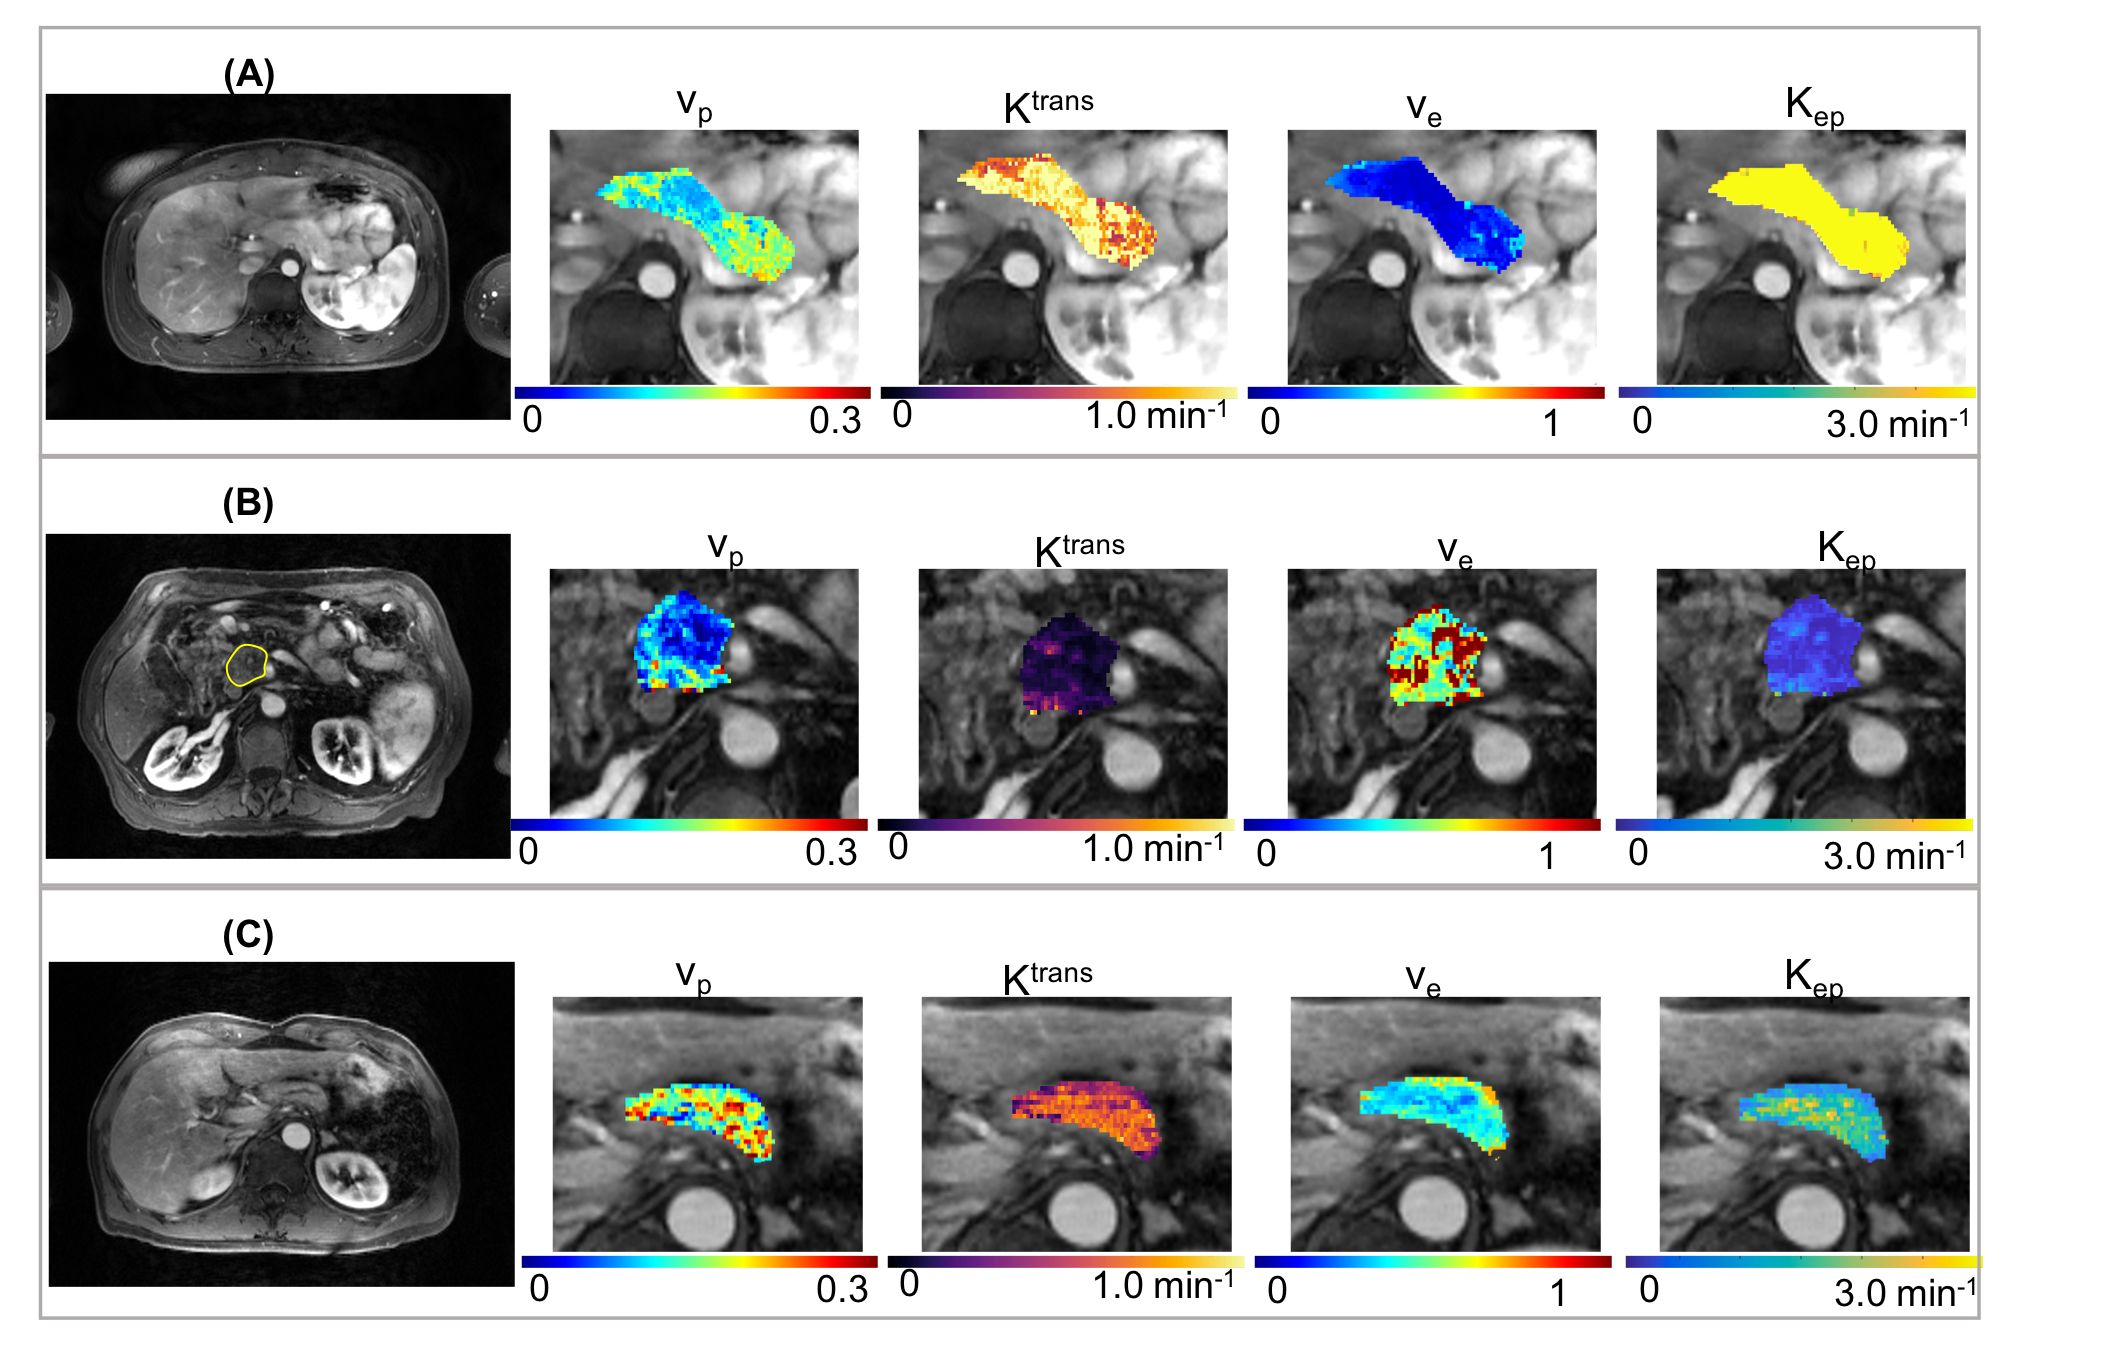
The typical process converting Multitasking DCE signal intensity to quantified dynamic T1 curves and then to CA concentration curves is illustrated in Figure 1. Figure 2 and Figure 3 display the representative vp, Ktrans, ve, and Kep maps for control, PDAC, and CP group. Figure 4 is a bar graph showing the mean and standard deviation measurements of vp, Ktrans, ve, and Kep from the four regions. The ANOVA analysis indicates that all the four parameters were significantly different between PDAC versus CP (P <0.001, <0.001, 0.012, <0.001, respectively), and between PDAC versus normal (P=0.011, <0.001, <0.001, <0.001, respectively); Ktrans, ve, and Kep were significantly different between CP versus normal (P<0.001, <0.001, 0.004, respectively) (Table 1).Discussion
The study demonstrated the feasibility of using the proposed six-dimensional Multitasking DCE to differentiate normal pancreas, PDAC and CP. The nontumoral area in PDAC cases are commonly associated with chronic obstructed pancreatitis, which may contribute to the lack of significant differences between nontumoral regions in PDAC group and CP.Conclusion
The in vivo feasibility of the proposed Multitasking DCE method with free-breathing acquisition, 3D whole-abdomen coverage, high temporal resolution at 500ms, and dynamic T1 mapping was demonstrated on healthy volunteers, PDAC, and CP patients. Statistical analysis showed that Multitasking DCE is capable of differentiating normal pancreas, PDAC, and CP, which would serve an important unmet need in screening CP patients for progression to cancer. Further clinical validation in a larger patient cohort is warranted.Acknowledgements
This work was supported by NIH 1R01EB028146.References
1. Li D, Xie K, Wolff R, Abbruzzese JL. Pancreatic cancer. The Lancet 2004;363(9414):1049-1057.
2. Siegel RL, Miller KD, Jemal A. Cancer statistics, 2017. CA: a cancer journal for clinicians 2017;67(1):7-30.
3. Zhang T-T, Wang L, Liu H-h, Zhang C-y, Li X-m, Lu J-p, Wang D-bJO. Differentiation of pancreatic carcinoma and mass-forming focal pancreatitis: qualitative and quantitative assessment by dynamic contrast-enhanced MRI combined with diffusion-weighted imaging. 2017;8(1):1744.
4. Tajima Y, Kuroki T, Tsutsumi R, Isomoto I, Uetani M, Kanematsu TJWjogW. Pancreatic carcinoma coexisting with chronic pancreatitis versus tumor-forming pancreatitis: diagnostic utility of the time-signal intensity curve from dynamic contrast-enhanced MR imaging. 2007;13(6):858.
5. Johnson PT, Outwater EKJR. Pancreatic carcinoma versus chronic pancreatitis: dynamic MR imaging. 1999;212(1):213-218.
6. Wang N, Christodoulou AG, Gaddam S, Wang L, Xie Y, Deng Z, Zhou Z, Yang W, Fan Z, Tuli R, Lo S, Hendifar A, Pandol S, Li D. Three-dimensional Free-breathing Quantitative Dynamic Contrast Enhanced (DCE) MR Imaging of Pancreatic Ductal Adenocarcinoma (PDAC) with Fast T1 Mapping Using Multitasking. In Proceedings of the 27th Annual Meeting of ISMRM, Montreal, Canada 2019. p 1722
7. Wang N, Christodoulou AG, Xie Y, Wang Z, Deng Z, Zhou B, Lee S, Fan Z, Chang H, Yu WJMrim. Quantitative 3D dynamic contrast‐enhanced (DCE) MR imaging of carotid vessel wall by fast T1 mapping using Multitasking. 2019;81(4):2302-2314.
8. Christodoulou AG, Shaw JL, Nguyen C, Yang Q, Xie Y, Wang N, Li D. Magnetic resonance multitasking for motion-resolved quantitative cardiovascular imaging. Nature Biomedical Engineering 2018;2(4):215.
9. Tofts PS, Brix G, Buckley DL, Evelhoch JL, Henderson E, Knopp MV, Larsson HB, Lee TY, Mayr NA, Parker GJ, Port RE, Taylor J, Weisskoff RM. Estimating kinetic parameters from dynamic contrast-enhanced T(1)-weighted MRI of a diffusable tracer: standardized quantities and symbols. J Magn Reson Imaging 1999;10(3):223-232.
Figures