0324
Visibility of deuterium-labeled liver glycogen in vivo.1Dept. of Radiology and Biomedical Imaging, Yale University, New Haven, CT, United States, 2Dept. of Psychiatry, Yale University, New Haven, CT, United States
Synopsis
Deuterium metabolic imaging (DMI) is a novel technique for mapping metabolism in vivo, that combines 2H MRSI with administration of a 2H-labeled substrate. DMI combined with [6,6'-2H2]-glucose has the potential to detect glycogen synthesis in the liver. However, the similar 2H chemical shifts of glucose and glycogen make unambiguous detection and separation difficult in vivo. Here we investigate the NMR-detectability of glycogen using high resolution 2H NMR of 2H-labeled glycogen isolated from mouse liver, and show that 2H-labeled glycogen is not detectable with DMI under in vivo conditions.
Introduction
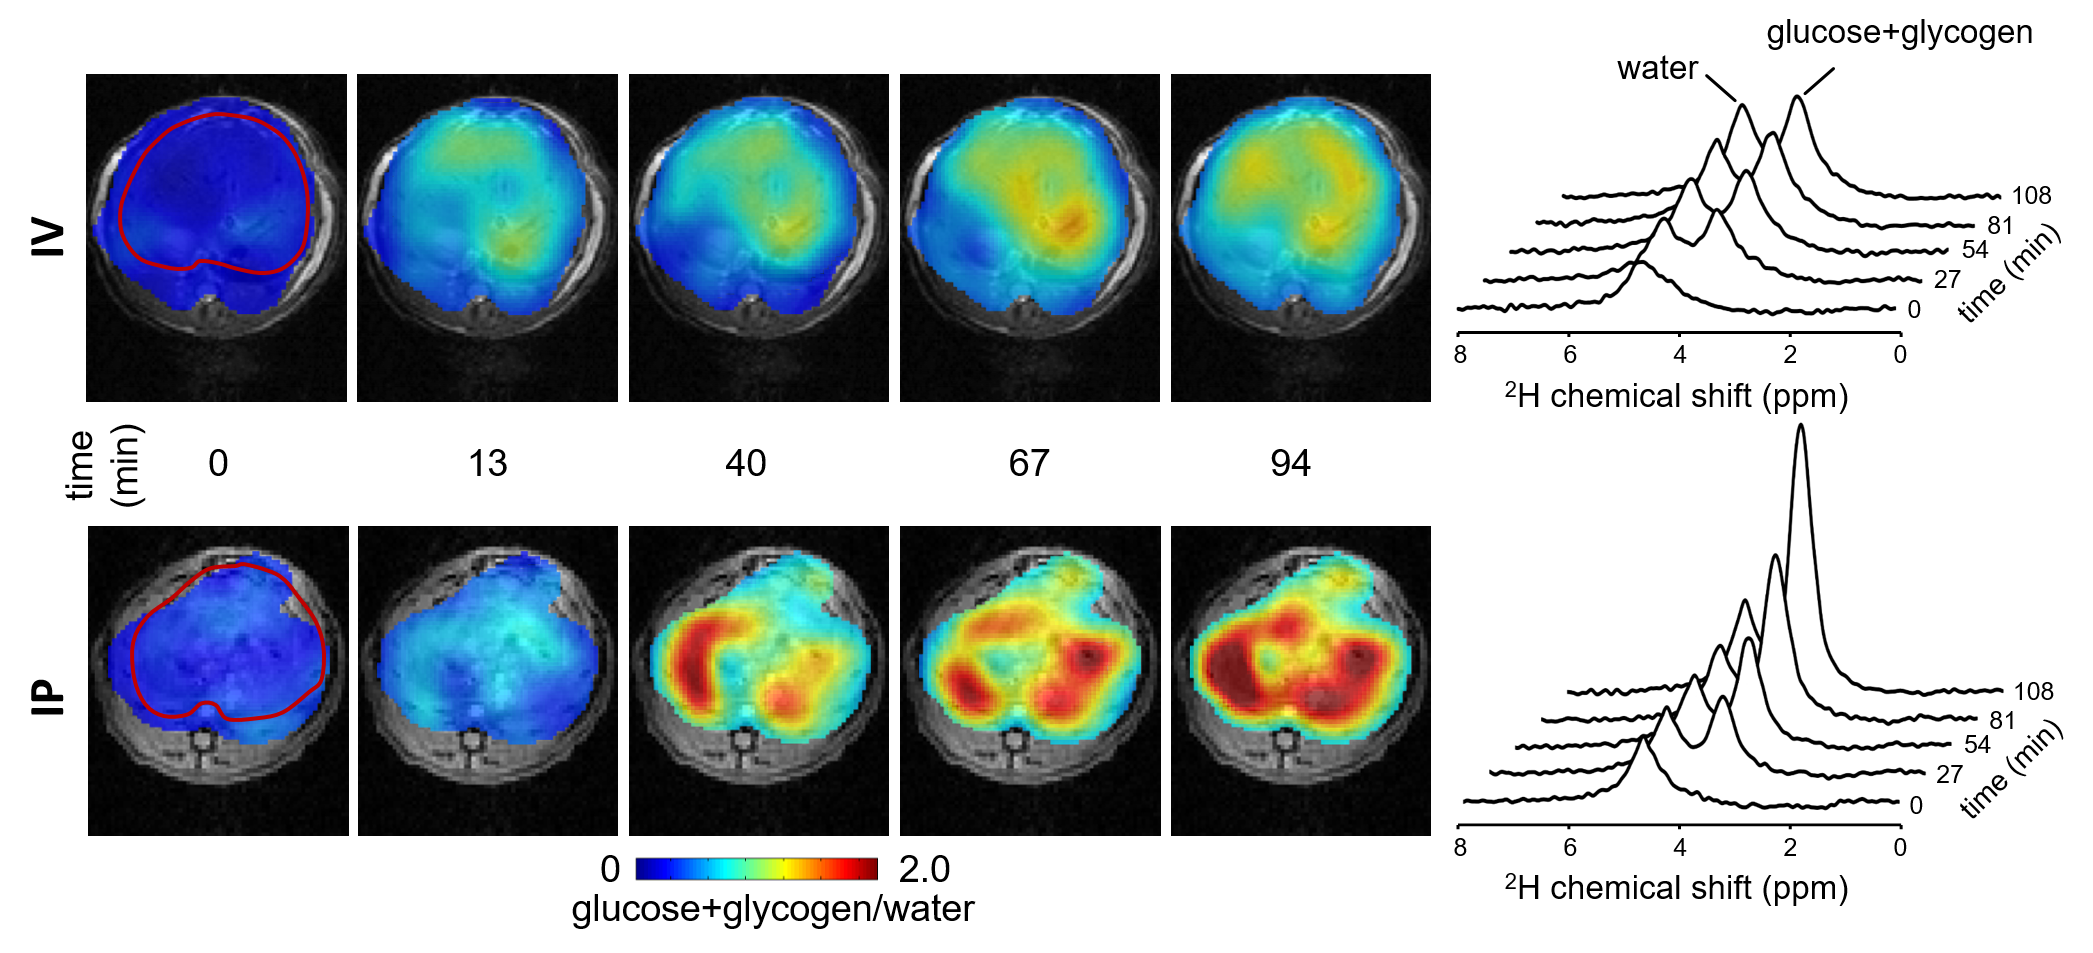
Deuterium Metabolic Imaging (DMI) is a novel approach providing high spatial resolution 3D metabolic data from both animal models and human subjects by combining 2H MRSI with administration of 2H-labeled substrates (1). One application of DMI is the detection of 2H-labeled glucose and glycogen in rodent and human liver (1). Unfortunately, the 2H chemical shift differences between glucose and glycogen are too small compared to the intrinsic linewidths for an unambiguous detection and separation of the two compounds. Significant differences have been observed in DMI-based maps of glucose+glycogen from liver of healthy rats, depending on whether the 2H-labeled glucose was administered intravenously or via intraperitoneal injection (Fig. 1). However, as the relative glucose and glycogen contributions to the detected signal are unknown, interpretation of liver DMI studies is ambiguous. Glycogen is a relatively large biopolymer of glucose characterized by large internal motions that give rise to NMR detectable, albeit broad, 1H and 13C resonances. Glycogen has been detected in vivo in several organs using 13C MRS after infusion of 13C-labeled glucose as well as by relying on the naturally abundant 1.1% of 13C (5–7). Glycogen has also been detected using 1H NMR, when dissolved in solution, and even in vivo (4,8). The 13C NMR visibility has been extensively studied and reported to be 100% (2). The broad glycogen resonances observed with 13C NMR are likely to be broadened even further for 2H-labeled glycogen that exhibits a modest, but significant quadrupole moment. Here we investigate the detectability of 2H-labeled glycogen produced in the liver of mice fed [6,6’-2H2]-glucose, and discuss the consequences for detection of glycogen in vivo using DMI.Materials and Methods
After a night with limited food (0.5 gram per mouse), C57Bl/6J mice (n=4) were provided with 1% [6,6’-2H2]-glucose and 7 mg/l of the beta-blocker propranolol (Millipore) in drinking water. After 4-5 days the mice were anesthetized using 3.5% isoflurane and 70%/30% N2O/O2 via a nose cone. An intraperitoneal injection was given with 5mg/kg body weight of a glycogen phosphorylase inhibitor (2-chloro-4,5-difluoro-N-[[[2-methoxy-5-[[(methylamino)carbonyl]amino]phenyl]amino]carbonyl]-benzamide, Cayman Chemical). Twenty minutes later parts of the liver were snap-frozen using clamps precooled in liquid N2. Glycogen was extracted by grinding the liver tissue while frozen, followed by a quick transfer to boiling water for 10 min, and further homogenization using a bead mill. The resulting homogenate was centrifuged, the supernatant collected and methanol was added to precipitate the glycogen. The glycogen-containing pellets of all liver samples were combined, dried under N2 flow, and resuspended in 600 uL 100 mM phosphate buffer at pH 7.4, made in 2H-depleted water (Cambridge Isotopes Laboratories, CIL), and containing 5 mM of 2H-labeled formate (CIL) for chemical shift referencing. 1H and 2H NMR experiments were performed on the glycogen-containing solution at 310K, before and after the addition of amyloglucosidase (Millipore) to break down glycogen into glucose. All NMR experiments were performed on a Bruker Avance spectrometer (Bruker Instruments, Billerica, MA) operating at 500.13 MHz for 1H and 76.77 MHz for 2H, and equipped with 5-mm probes optimized for 1H and broadband (BB) acquisition, respectively. Proton NMR spectra were acquired with a pulse-acquire method (TR=15s) using pre-saturation water suppression, as 16,384 points over a 10 kHz spectral width. Direct 2H NMR spectra were acquired using the BB probe with a pulse-acquire method (TR=1s, 14,400 averages per block) as 2,048 complex points over a 5.0 kHz spectral width.Results
Figure 2 shows 1H and 2H NMR spectra from mouse liver glycogen before and after adding amyloglucosidase to break glycogen down into glucose. The 1H spectrum of glycogen clearly shows the H2-H6 resonances between 3 and 4 ppm, as well as a well separated signal from the H1 protons at 5.39 ppm. The spectrum also contains a dominant signal from methanol (and its 13C satellites *) which is residue from the extraction procedure. The 2H NMR spectrum is largely empty with natural abundance 2H signals from water and the methanol. A very broad (~200 Hz, T2* ~ 1.6 ms) signal centered around 3.7 ppm was tentatively assigned to 2H-labeled glycogen. Addition of amyloglucosidase leads to a partial breakdown of glycogen into glucose, which is visible as multiple sharp 1H NMR resonances between 3 and 5.25 ppm. The 2H NMR spectrum also reveals sharp [6,6'-2H2]-glucose signals, thus proving that 2H-labeled glycogen was present in the sample.Discussion and conclusion
Deuterated glycogen has been shown to exhibit broad resonances in 2H NMR spectra in vitro, making it essentially NMR invisible under in vivo conditions with lower SNR, longer RF pulses and possible non-zero echo-times. The quadrupolar moment characteristic for 2H provides an additional relaxation pathway compared to 1H and 13C that likely broadens the glycogen signal below the in vivo detection limit. DMI with [6,6'-2H2]-glucose on liver can now be seen as a glucose mapping technique without the complications of an unresolved glycogen contribution.Acknowledgements
This research was supported by NIH grant R01- EB025840.References
1. De Feyter HM, Behar KL, Corbin ZA, et al. Deuterium metabolic imaging (DMI) for MRI-based 3D mapping of metabolism in vivo. Sci. Adv. 2018;4:eaat7314 doi: 10.1126/sciadv.aat7314.
2. Gruetter R, Magnusson I, Rothman DL, Avison MJ, Shulman RG, Shulman GI. Validation of 13C NMR measurements of liver glycogen in vivo. Magn. Reson. Med. 1994;31:583–588 doi: 10.1002/mrm.1910310602.
3. Jue T, Lohman J a. B, Ordidge RJ, Shulman RG. Natural abundance 13C NMR spectrum of glycogen in humans. Magn. Reson. Med. 1987;5:377–379 doi: 10.1002/mrm.1910050410.
4. Chen W, Avison MJ, Bloch G, Shulman RG. Proton NMR observation of glycogen in vivo. Magn. Reson. Med. 1994;31:576–579 doi: 10.1002/mrm.1910310518.
5. Avison MJ, Rothman DL, Nadel E, Shulman RG. Detection of human muscle glycogen by natural abundance 13C NMR. Proc. Natl. Acad. Sci. 1988;85:1634–1636 doi: 10.1073/pnas.85.5.1634.
6. Taylor R, Magnusson I, Rothman DL, et al. Direct assessment of liver glycogen storage by 13C nuclear magnetic resonance spectroscopy and regulation of glucose homeostasis after a mixed meal in normal subjects. J. Clin. Invest. 1996;97:126–132 doi: 10.1172/JCI118379.
7. Öz G, Kumar A, Rao JP, et al. Human Brain Glycogen Metabolism During and After Hypoglycemia. Diabetes 2009;58:1978–1985 doi: 10.2337/db09-0226.
8. Zang LH, Rothman DL, Shulman RG. 1H NMR visibility of mammalian glycogen in solution. Proc. Natl. Acad. Sci. U. S. A. 1990;87:1678–1680.
9. De Feyter HM, Brown PB, Behar KL, Rothman DL, De Graaf RA. Glycogen Synthesis Mapping Using In Vivo Deuterium Metabolic Imaging (DMI). In: Proc. Intl. Soc. Mag. Reson. Med. 26 (2018). Paris, France; 2018.
Figures