0323
Quantitative MRI to assess portal hypertension in cirrhosis patients1Sir Peter Mansfield Imaging Centre, University of Nottingham, Nottingham, United Kingdom, 2NIHR Nottingham Biomedical Research Centre, Nottingham University Hospitals NHS Trust and University of Nottingham, Nottingham, United Kingdom
Synopsis
Hepatic venous pressure gradient (HVPG) is the gold standard method for the assessment of portal pressure, but highly invasive. We scanned patients with portal hypertension at both 1.5T and 3T to assess MRI parameters related to portal pressure as defined by HVPG. Iron-corrected liver T1 highly correlated over the full range of HVPG (3T p<0.0002, 1.5T p<0.0001), spleen T1 and superior mesenteric artery velocity correlated up to HVPG of 15 mmHg (spleen T1: 3T p<0.0003, 1.5T p<0.0006; SMA velocity: p<<0.00001), after which at HVPG >15 mmHg no correlation was observed.
Introduction
The majority of complications in liver cirrhosis arise from portal hypertension. Hepatic Venous Pressure Gradient (HVPG) [1] is the gold standard method for assessment of portal hypertension, but is highly invasive and performed in only a limited number of centres. We previously validated MRI as a surrogate measure of HVPG at 1.5T using liver T1 and splanchnic haemodynamics [2]. Here, we combine a new cohort of patients scanned at 3T MRI with those at 1.5T [2] to examine the relation of MRI measures with HVPG for individual patient care.Methods
Participants underwent HVPG measurement for clinical indications and MRI was performed within 6 weeks in a fasted state. 43 patients (22 Non-alcoholic fatty liver disease (NAFLD)/11 Alcohol-related liver disease (ArLD )/10 other, 60±11 years) were scanned on a 3T Philips Ingenia scanner and collated with a previous cohort of 30 patients (11 NAFLD/9 ArLD/5 autoimmune hepatitis/5 other, 55±13 years) scanned on a 1.5T Philips Achieva scanner [2]. Liver stiffness was measured using transient elastography (Fibroscan®).MR Protocol:
T1 longitudinal relaxation time of the liver and spleen was measured using a respiratory triggered inversion recovery fat-suppressed spin-echo EPI scheme (3T: 9 axial slices, 10 inversion times (TI) 100-1500ms, 58ms temporal slice spacing, ascending/descending slice order; 1.5T: 9 axial slices, 13 inversion times 100-1200ms in 100ms steps and 1500ms). Liver and spleen transverse relaxation time (T2*) was measured using a multishot-fast field echo (mFFE) sequence (3T: 12 echoes, TE1 2.5ms, ΔTE 2.5ms) to assess liver iron content. Phase-contrast (PC)-MRI was used to assess flow in the superior mesenteric artery (SMA), splenic artery (SPA) and ascending aorta. Liver and spleen fat fraction and volume were measured using mDIXON QUANT (Philips Medical Systems).
Data Analysis:
SE-EPI T1 data was motion corrected and fit to generate a T1 map (MATLAB), T1 maps were corrected for iron content using the mFFE-computed T2* maps [3]. Histogram analysis was performed to compute the mode of T1, T2* within the liver. Q-flow software (Philips Medical Systems) was used to analyse the PC-MRI data to compute mean vessel cross-sectional area, velocity, and flux over the cardiac cycle. Cardiac index was computed by correcting the ascending aorta flux for body surface area. Liver and spleen volume were estimated using Analyze9.
Statistical Analysis:
Data was Shapiro-Wilk normality tested, and correlations assessed with the full range of HVPG, HVPG up to 15 and >15mmHg (an independent risk factor for adverse liver related outcomes [4,5]) using a Pearson or Spearman test. Coefficients of variation have been assessed previously [6].
Results
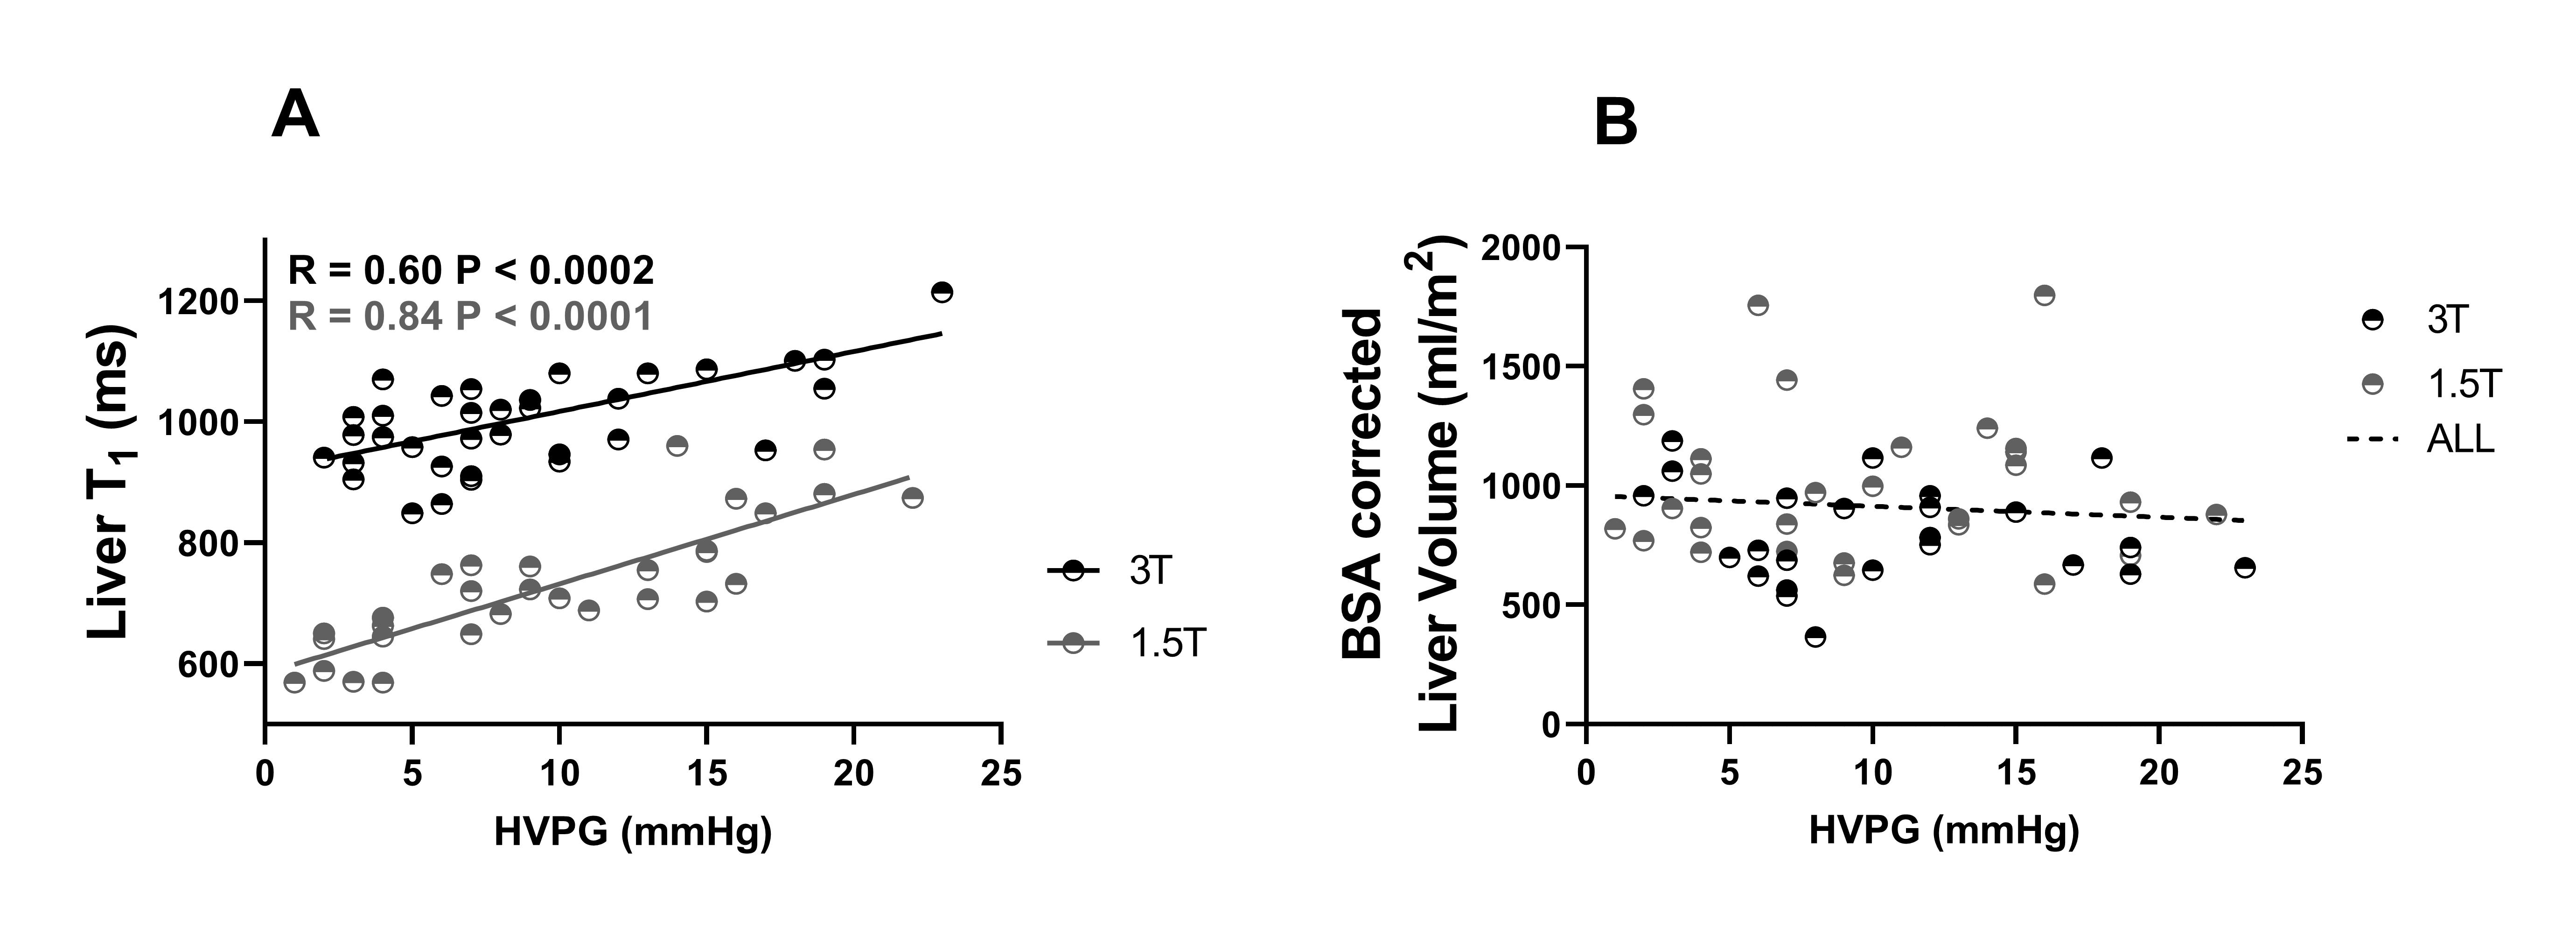
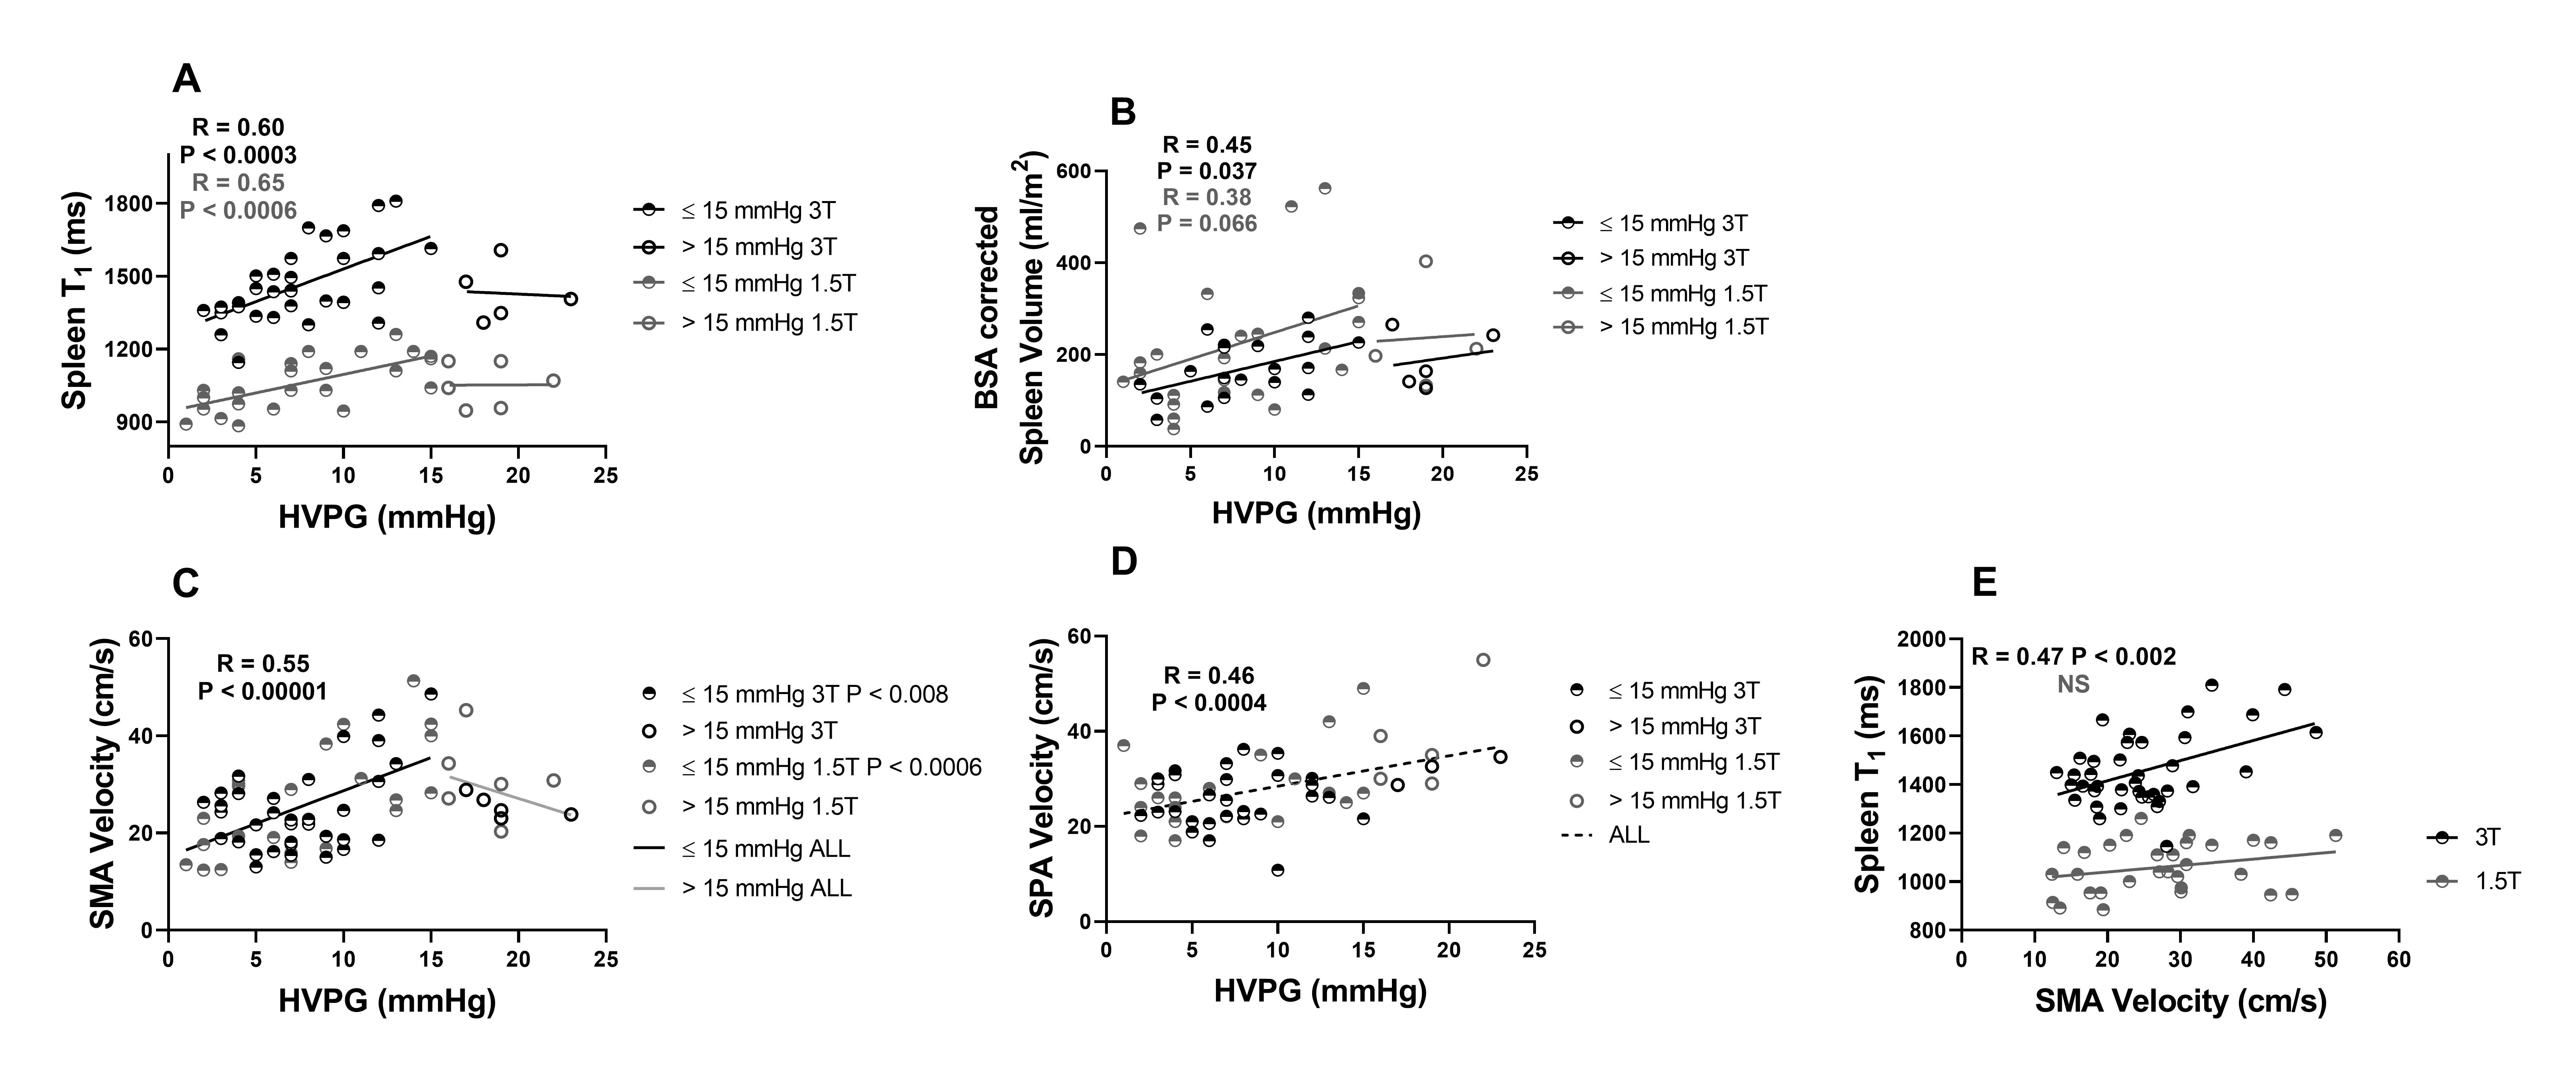
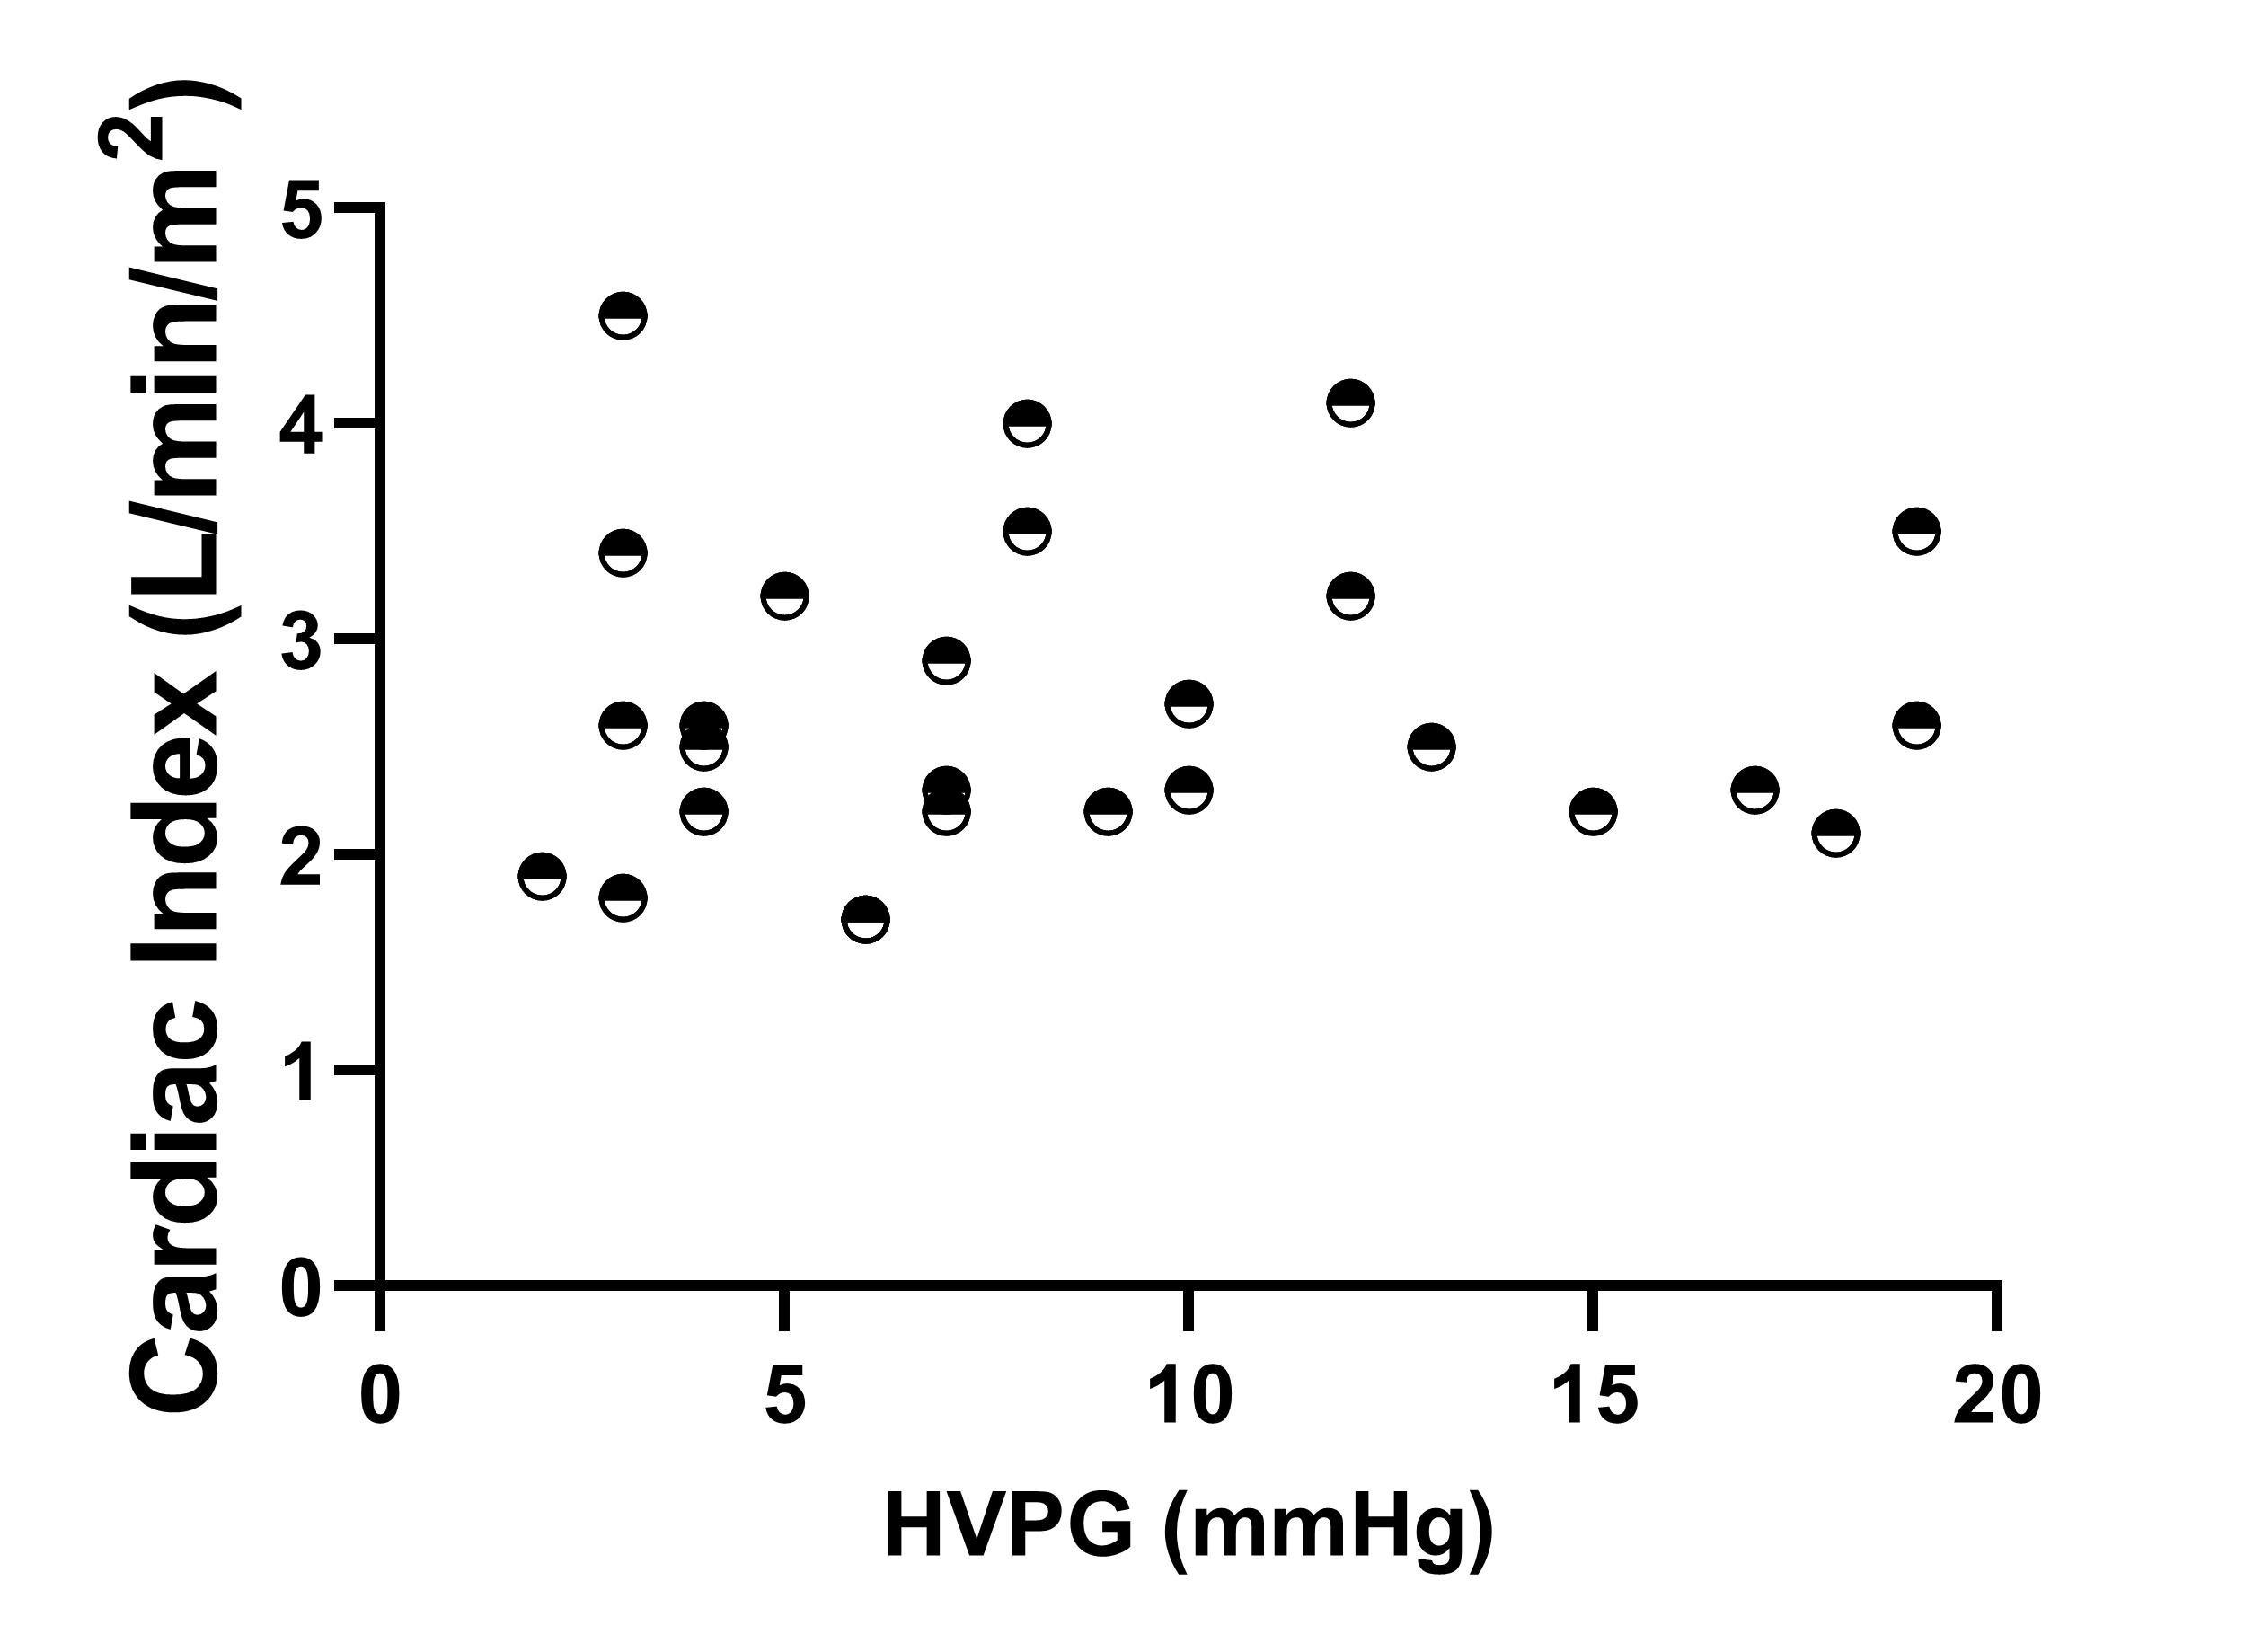
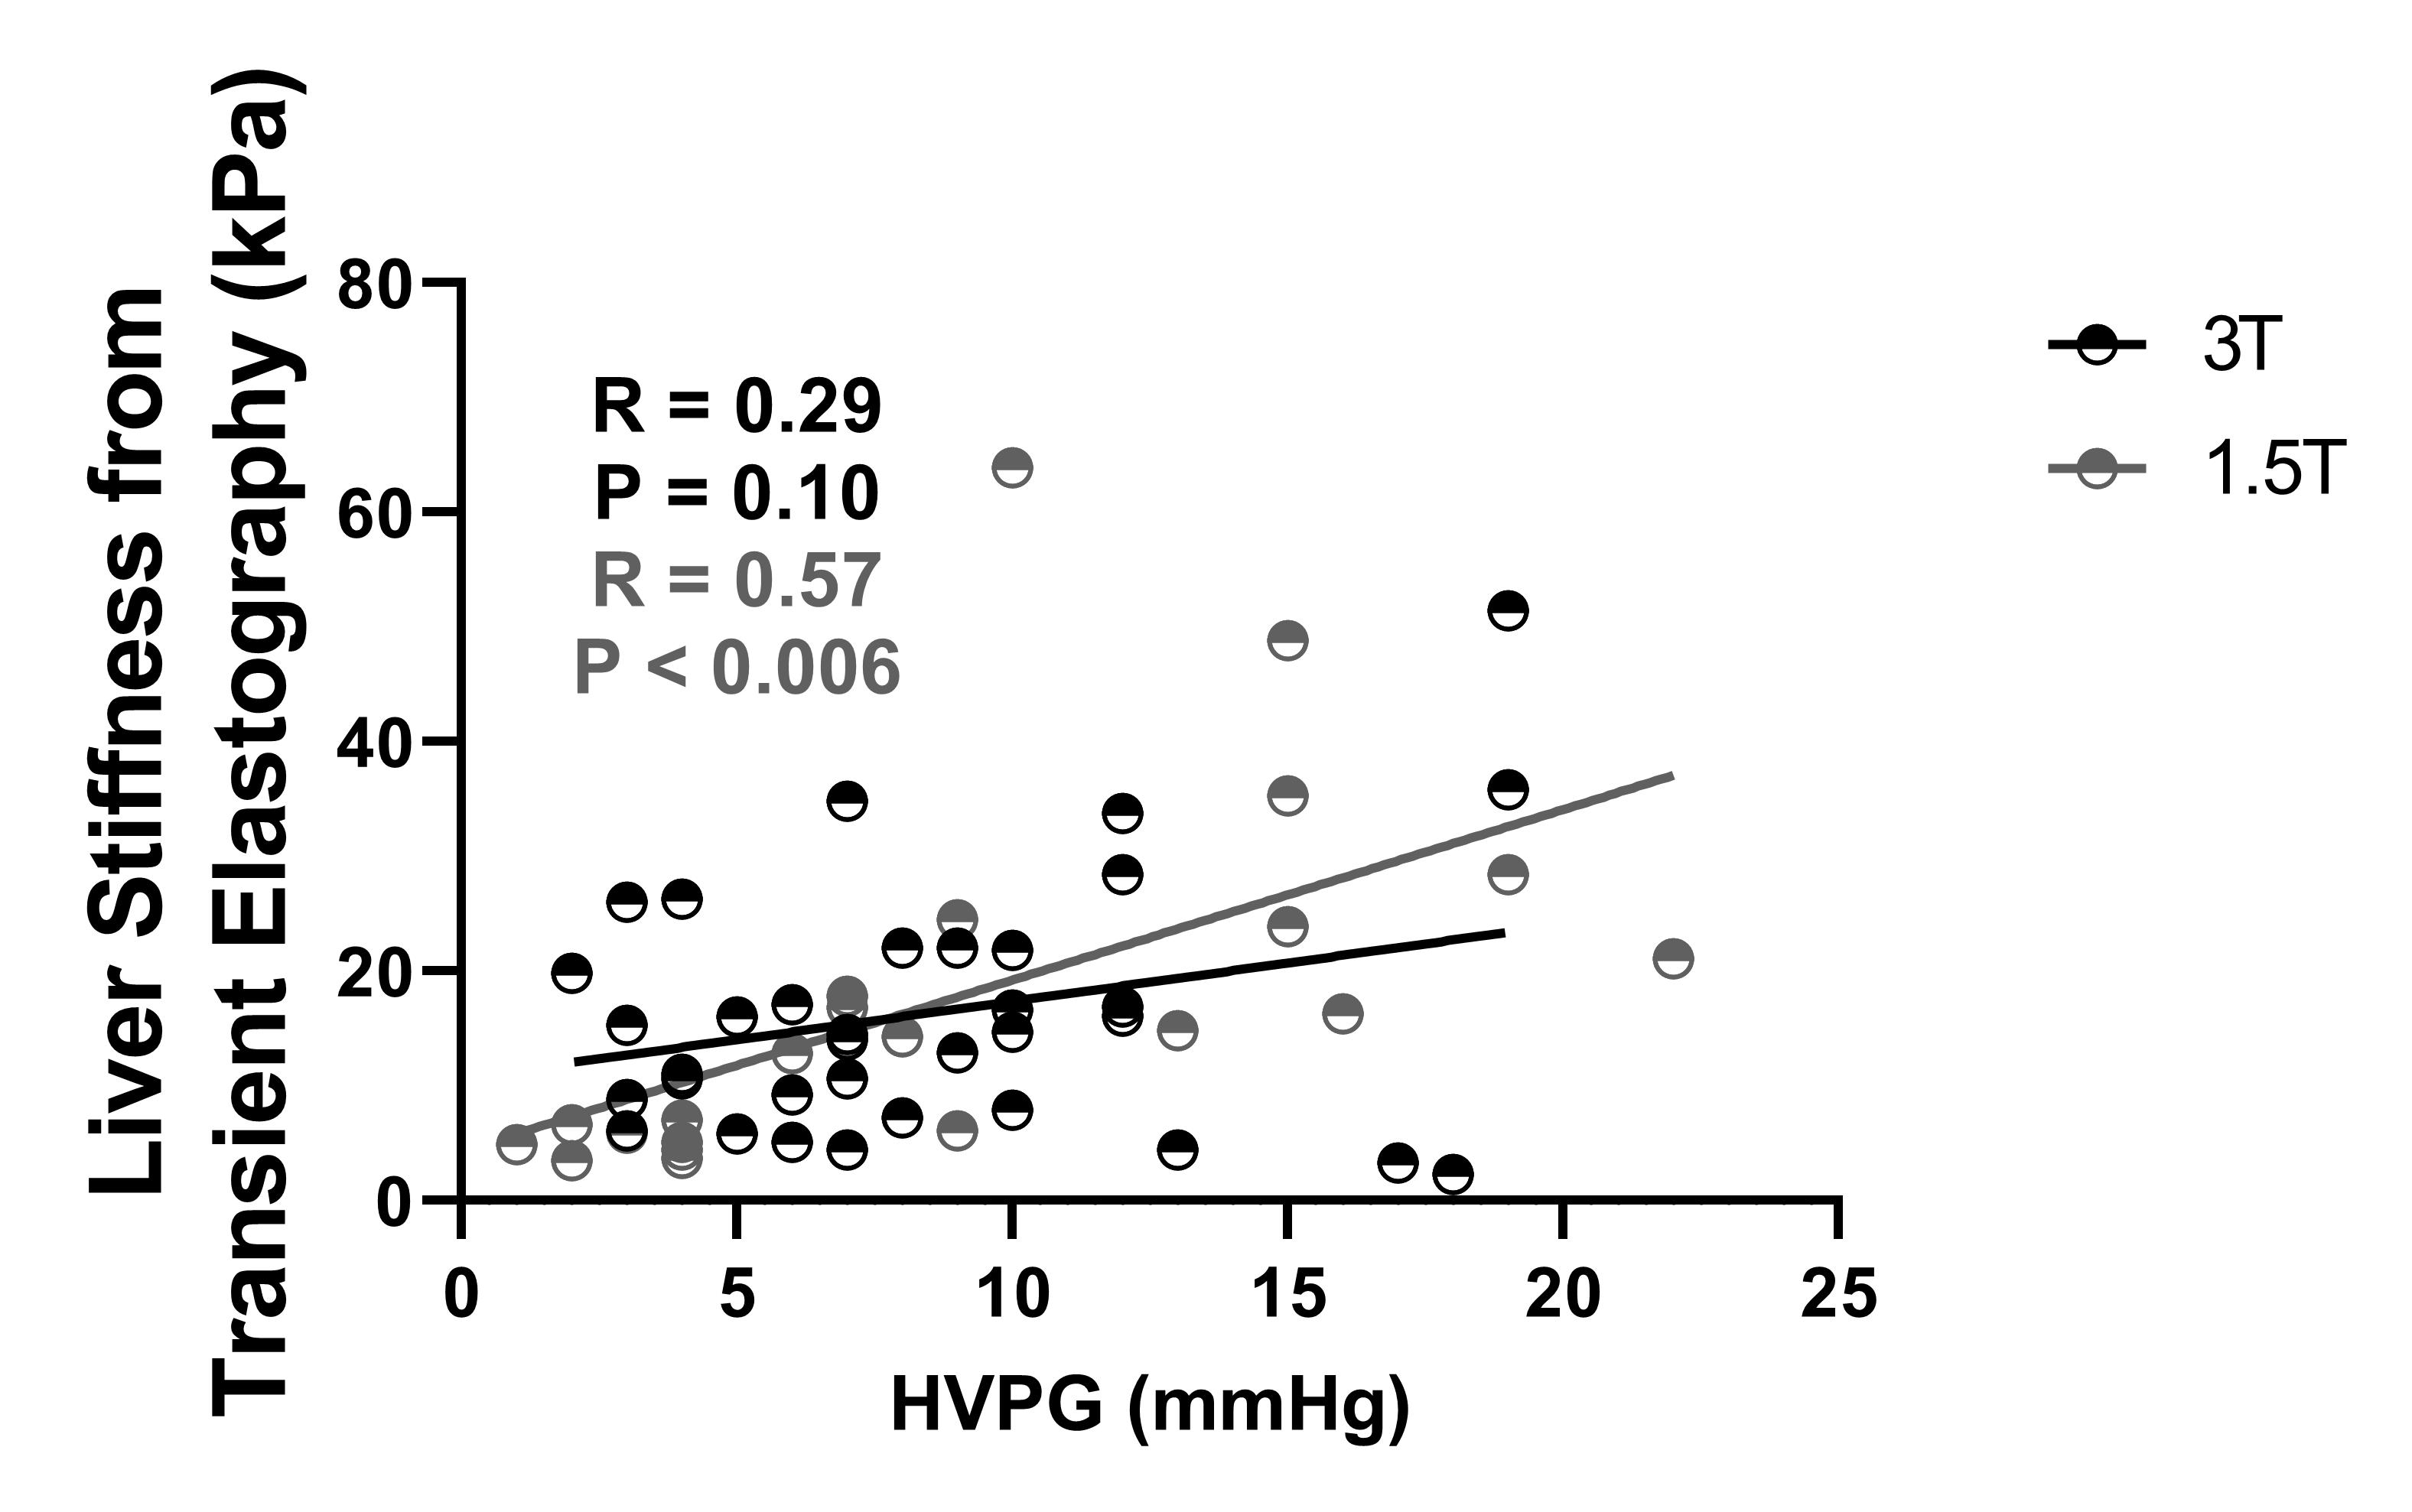
HVPG ranged from 1-23mmHg, with a strong linear correlation between HVPG and iron corrected liver T1 (p<0.0002, Fig. 1A), liver volume showed no change (Fig. 1B). Spleen T1 (Fig. 2A) correlated with HVPG up to a portal pressure of 15mmHg (spleen T1: p<0.0003 at 3T, p<0.0006 at 1.5T), after which (>15mmHg) no significance was observed, spleen volume showed a similar pattern (Fig. 2B). SMA velocity also showed a significant increase up to 15mmHg (p<<0.00001, Fig. 2C), after which it declined. SPA velocity correlated with HVPG (p<0.0004, Fig. 2D). SMA velocity and spleen T1 correlated at 3T (p<0.002, Fig. 2E). No correlation was seen between cardiac index and HVPG (Fig. 3). Liver stiffness measured from Fibroscan® weakly correlated with HVPG in the 3T cohort (R=0.29, P=0.10), reaching significance for the combined cohort (R=0.44, P<0.001), Fig. 4.Discussion
Liver T1 at 3T highly correlated across the full range of HVPG (Fig. 1), as previously shown at 1.5T [2]. Importantly, we show across both 1.5 and 3 T that spleen T1 increases with increased HVPG only up to 15mmHg (Fig. 2), after which a reduction in spleen T1 is seen. This pattern is also reflected in spleen volume and SMA velocity, with a significant correlation between spleen T1 and SMA velocity. This suggests that as sphanchnic flow increases and splenic venous flow into the portal vein is impeded by elevated portal pressure, congestion of intrasplenic blood and spleen enlargement occurs, with the spleen T1 plateauing at blood T for each field strength (~1800ms at 3T, 1300ms at 1.5T [7]). The drop in splanchnic MRI measures at HVPG >15mmHg is likely due to an increase in collaterals [8]. The finding of a threshold HVPG of 15mmHg is in line with a lack of correlation at high HVPG between HVPG and splenic stiffness from Fibroscan® [9]. The assessment of multi-organ measures in this study suggests MRI provides a way to identify the potential therapeutic window in portal hypertension [8]. The 1.5T cohort had a strong correlation between liver stiffness from Fibroscan® and HVPG which was not seen in the 3T cohort, likely due to the higher prevalence of varices or higher BMI (BMI >30 in 59% participants at 3T and 41% at 1.5T) in the 3T cohort.Conclusion
Liver T1 is a good surrogate measure for the prediction of portal pressure. Spleen T1, spleen volume and SMA flow correlate up to a HVPG of 15 mmHg, after which a reduction is observed, which together could predict when the window of therapeutic opportunity begins to close, and when beta blocker therapy may become less effective or have adverse effects.Acknowledgements
Financial support from NIHR Nottingham Digestive Diseases Biomedical Research Centre, Nottingham University Hospitals NHS Trust and University of Nottingham.References
1. Groszmann RJ, Wongcharatrawee S (2004) The hepatic venous pressure gradient: Anything worth doing should be done right. Hepatology 39:280–283 . doi: 10.1002/hep.20062
2. Palaniyappan N, Cox E, Bradley C, et al (2016) Non-invasive assessment of portal hypertension using quantitative magnetic resonance imaging. J Hepatol 65:1131–1139 . doi: 10.1016/j.jhep.2016.07.021
3. Wood JC, Enriquez C, Ghugre N, et al (2005) MRI R2 and R2* mapping accurately estimates hepatic iron concentration in transfusion-dependent thalassemia and sickle cell disease patients. Blood 106:1460–1465 . doi: 10.1182/blood-2004-10-3982
4. Merkel, C., et al., The hemodynamic response to medical treatment of portal hypertension as a predictor of clinical effectiveness in the primary prophylaxis of variceal bleeding in cirrhosis. Hepatology, 2000. Nov;32(5):930-4 doi: 10.1053/jhep.2000.19322
5. Silva-Junior, G., et al., The prognostic value of hepatic venous pressure gradient in patients with cirrhosis is highly dependent on the accuracy of the technique. Hepatology, 2015. 62(5): p. 1584-92. doi: 10.1002/hep.28031.
6. Bradley CR, Cox EF, Scott RA, et al (2018) Multi-organ assessment of compensated cirrhosis patients using quantitative magnetic resonance imaging. J Hepatol 69:1015–1024 . doi: 10.1016/j.jhep.2018.05.037
7. Zhang X, Petersen ET, Ghariq E, et al (2013) In vivo blood T(1) measurements at 1.5 T, 3 T, and 7 T. Magn Reson Med 70:1082–6 . doi: 10.1002/mrm.24550
8. Krag A, Wiest R, Albillos A, Lotte Gluud L The window hypothesis: haemodynamic and non-haemodynamic effects of b-blockers improve survival of patients with cirrhosis during a window in the disease. doi: 10.1136/gutjnl-2011-301348
9. Tseng Y, Li F, Wang J, et al (2018) Spleen and liver stiffness for noninvasive assessment of portal hypertension in cirrhotic patients with large esophageal varices. J Clin Ultrasound 46(7):442–449. doi: 10.1002/jcu.22635.
Figures