0321
Proton-density fat fraction-derived R2* liver iron concentration – an exploratory study of Revita-2 phase II trial data1UCL Centre for Medical Imaging, University College London, London, United Kingdom, 2Department of Medical Physics, University College London Hospitals NHS Trust, London, United Kingdom, 3Fractyl Laboratories Inc., Lexington, MA, United States
Synopsis
R2* derived liver iron concentration (LIC) measurements from proton density fat fraction (PDFF) data obtained in patients with normal LIC levels may be useful. Here we present data from the Revita-2 trial demonstrating strong significant positive correlations between baseline liver fat fraction (FF) and LIC. Significant and stronger correlations between relative % change in liver FF and LIC in the treatment arms of the trial raise the possibility of treatment-related mechanistic effects on hepatic iron metabolism.
Introduction
Use of MRI proton density fat fraction (PDFF) sequences for quantitative, portable and accurate measurements of liver fat for clinical trial primary endpoints is well established. Accuracy of PDFF liver fat fraction measurements are reliant on correction for T2/T2* related signal decay, and multi-echo gradient echo sequences used to derive PDFF maps therefore also generate R2* maps1. These can be used to measure liver iron concentration (LIC), which can yield mechanistic insights, as dysregulation of iron homeostasis has been associated with non-alcoholic fatty liver disease (NAFLD) and type 2 diabetes mellitus (T2DM)2.Some studies have demonstrated the value of PDFF-derived R2* for quantification of LIC across varying severities of hepatic siderosis3, but others have suggested that within steatotic patients with low-levels of LIC, fat-fraction (FF) itself is the most influential of covariate for hepatic R2*4. The accuracy of PDFF-derived R2* measurements in patients with hepatic steatosis and no/mild siderosis is therefore essential to be able to draw mechanistic conclusions from studies where patients typically demonstrate low R2* levels.
Here we present data from Revita-2, a phase II blinded, sham-controlled, international multi-site, multi-vendor cross-over trial (NCT02879383) designed to evaluate the effects of duodenal mucosal resurfacing (DMR), a novel endoscopic procedure to treat patients with poorly controlled T2DM on liver FF. We aim to (a) explore the association between PDFF-derived R2* LIC measurements and liver FF; and (b) determine if there is a difference in the strength of association between relative change in FF and LIC at 12 weeks in DMR and sham-treatment cohorts, to support the presence of any treatment-induced mechanistic differences in hepatic iron metabolism.
Methods
Data were acquired at 7 scanning sites (4 Philips 3T systems, 1 GE 3T system, 1 Philips 1.5T system and 1 GE 1.5 system).T2DM patients were recruited at 8 clinical sites prospectively as per trial inclusion criteria. Study sites complete upto 5 training (non-randomised) cases each to familiarise themselves with the procedure prior to randomisation.
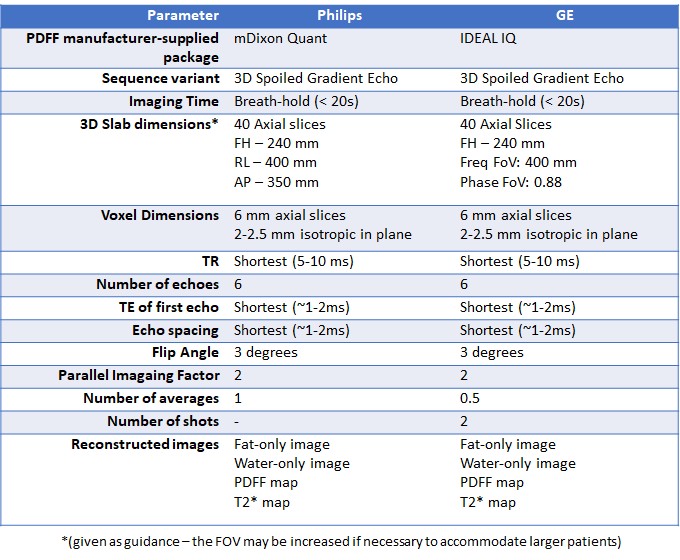
Thereafter, patients are randomised to either DMR or sham treatment. Participants included n=17 receiving DMR as part of the training cohort, n=39 randomised to DMR and n=23 randomised to sham treatment, with MRI-PDFF of the liver at baseline and 12 weeks following DMR treatment, using specified acquisition parameters (figure 1).
Measurement coherence and longitudinal stability of site PDFF measurements was assessed at 6-monthly intervals using custom-built fat-water QA phantoms5. Scans were reviewed to ensure compliance with acquisition parameters, adequate anatomical coverage and absence of significant artefacts.
Studies were analysed using a custom-developed online platform (Ambra Health, New York, USA). A circular region of interest (ROI) measuring upto 20 mm2 in diameter was placed in each of the 9 Coinaud liver segments colocalised on proton density fat fraction (PDFF) maps and R2* maps (for LIC), avoiding vessels and the biliary tree. LIC (μmol/g) was estimated from R2* data based on previously published methods6.
Linear regression with calculation of Pearson’s correlation coefficient was used to explore the relationship between (a) baseline absolute liver FF and LIC measurements and (b) relative (% of baseline) within-subject change in liver FF and LIC for each cohort.
Results
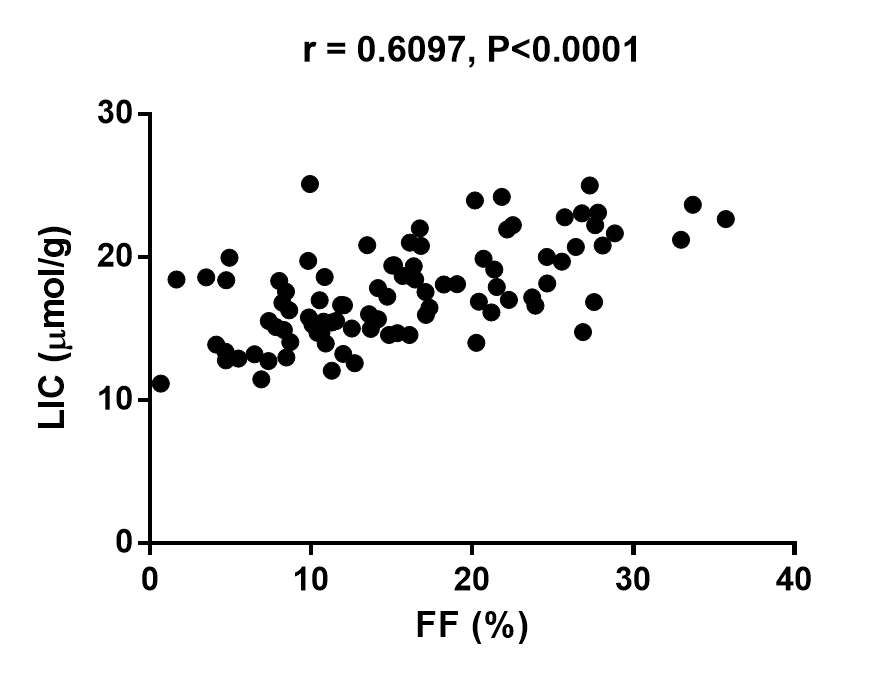
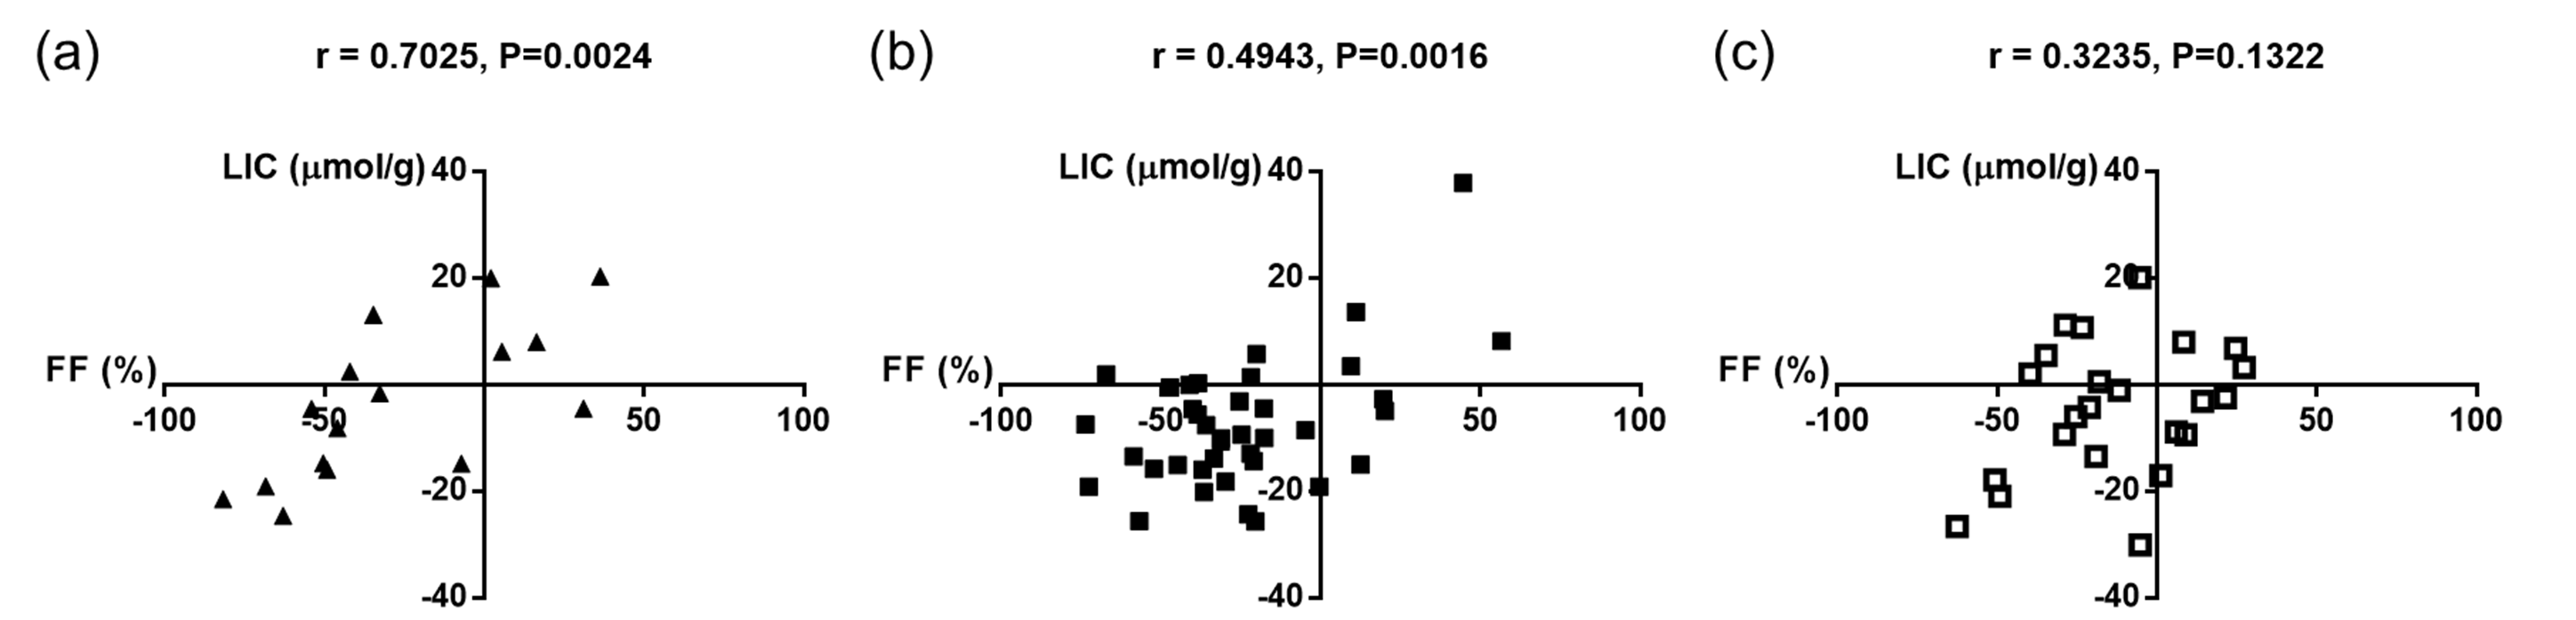
A significant positive correlation was demonstrated between baseline absolute liver FF and LIC (r=0.6097, P<0.0001; figure 2). Significant positive correlations were demonstrated between % change in FF and % change in LIC at 12 weeks for the training case cohort (r=0.7025, P=0.0024; figure 3a) and the DMR cohort (r=0.4943, P=0.0016; figure 3b). Following sham treatment the correlation between % change in FF and % change in LIC at 12 weeks was weaker and not significant (r=0.3235, P=0.1322; figure 3c).Discussion
The strong positive correlation demonstrated between PDFF-derived liver FF and LIC is comparable with previously reported results4, despite collating data from multiple field strengths and patients with normal range LIC levels (<36 μmol/g)7. Significant linear correlations between post-treatment relative (%) change in liver FF and LIC in both training and DMR cohorts, with weaker non-significant correlations in the sham cohort raise the possibility of altered mechanistic effects on hepatic iron metabolism as a result of treatment. To better understand this phenomenon, ongoing studies using non-imaging biomarkers of iron metabolism are underway.Conclusion
PDFF-derived liver FF and LIC are strongly positively correlated at baseline. Relative change in liver FF and LIC at 12 weeks is more strongly correlated post-DMR than in sham-treated patients raising the possibility of altered mechanistic effects on hepatic iron metabolism as a result of DMR.Acknowledgements
No acknowledgement found.References
1. Bray, T. J., Chouhan, M. D., Punwani, S., Bainbridge, A. & Hall-Craggs, M. A. Fat fraction mapping using magnetic resonance imaging: insight into pathophysiology. Br J Radiol 20170344 (2017). doi:10.1259/bjr.20170344
2. Fernández-Real, J. M. & Manco, M. Effects of iron overload on chronic metabolic diseases. Lancet Diabetes Endocrinol. 2, 513–526 (2014).
3. Kühn, J.-P. et al. Prevalence of Fatty Liver Disease and Hepatic Iron Overload in a Northeastern German Population by Using Quantitative MR Imaging. Radiology 284, 706–716 (2017).
4. Bashir, M. R. et al. Hepatic R2* is more strongly associated with proton density fat fraction than histologic liver iron scores in patients with nonalcoholic fatty liver disease. J. Magn. Reson. Imaging 49, 1456–1466 (2019).
5. Sakai, N. et al. Liver proton density fat fraction as a trial endpoint in an international multi-site phase-II trial in patients with type 2 diabetes mellitus following treatment with duodenal mucosal resurfacing. in International Society of Magnetic Resonance in Medicine 1758 (2019).
6. Paisant, A., d’Assignies, G., Bannier, E., Bardou-Jacquet, E. & Gandon, Y. MRI for the measurement of liver iron content, and for the diagnosis and follow-up of iron overload disorders. Press. Medicale 46, e279–e287 (2017).
7. Alústiza Echeverría, J. M., Castiella, A. & Emparanza, J. I. Quantification of iron concentration in the liver by MRI. Insights Imaging 3, 173–80 (2012).
Figures