0320
Splenic T1ρ as a noninvasive biomarker for portal hypertension1BioMedical Engineering and Imaging Institute, Icahn School of Medicine at Mount Sinai, New York, NY, United States, 2Department of Diagnostic, Molecular and Interventional Radiology, Icahn School of Medicine at Mount Sinai, New York, NY, United States, 3Department of Radiology, Weill Cornell Medicine, New York, NY, United States, 4Recanati/Miller Transplantation Institute, Icahn School of Medicine at Mount Sinai, New York, NY, United States, 5Department of Pathology, Icahn School of Medicine at Mount Sinai, New York, NY, United States
Synopsis
In this study we explored the used of liver and spleen T1 and T1ρ parameters for noninvasive assessment of portal hypertension (PH) and compared the performance of the MRI relaxation parameters with that of radiological assessment. Spleen T1ρ showed a strong significant positive correlation with quantitative portal pressure measurements (r=0.613, P=0.001), while the other relaxation parameters did not. Spleen T1ρ also outperformed other relaxation parameters and radiological assessment for prediction of (clinically significant) PH (AUC 0.778 – 0.817). Our results indicate that spleen T1ρ may be a suitable noninvasive biomarker for prediction of PH.
Purpose
Portal hypertension (PH) is one of the major serious consequences of liver cirrhosis and is associated with major severe complications including ascites, hepatic encephalopathy and bleeding from gastro-esophageal varices (1). For clinical management and prognostication of cirrhotic patients, measurement of portal pressure is of key importance (2). In addition, monitoring of portal pressure is essential to measure the efficacy of medical therapies for portal hypertension, including treatment with non-selective beta-blockers (2). The reference standard for the diagnosis and staging is the transvenous measurement of the hepatic venous pressure gradient (HVPG) (3). Limitations of HVPG measurements include the limited availability and invasiveness with risk of complications. Therefore, there is a need for noninvasive methods to assess portal pressure. The goals of this study were to (1) assess the correlation of liver and spleen T1 and T1ρ measurements with portal pressure measurements in patients with chronic liver disease and (2) to compare the diagnostic performance of the relaxation parameters with radiological assessment for prediction of PH.Materials and Methods
This initial prospective IRB-approved study included 25 patients (M/F 16/9, mean age 56 y, range 21 – 78 y). All patient underwent abdominal MRI at 1.5T, including T1ρ and T1 mapping of the liver and spleen, and portal pressure [hepatic venous pressure gradient (HVPG)] measurements. Radiological evaluation of PH was performed by assessment of PH score (4), absolute spleen size and spleen size normalized to the patient’s height and gender (5). Spearman correlation of all parameters with HVPG was assessed. The diagnostic performance of the assessed parameters for prediction of PH (HVPG ≥ 5 mmHg) and clinically significant PH (CSPH, HVPG ≥ 10 mmHg) was determined by ROC analysis.Results
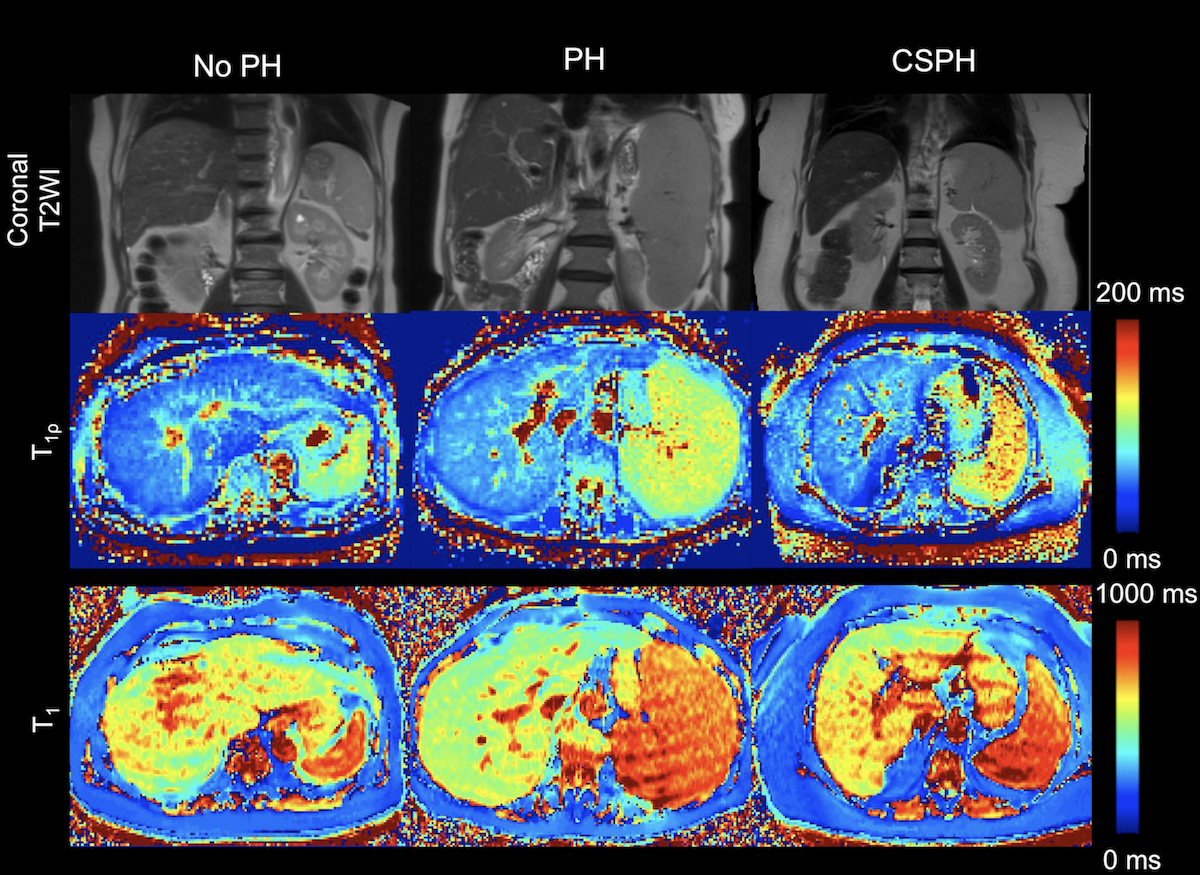
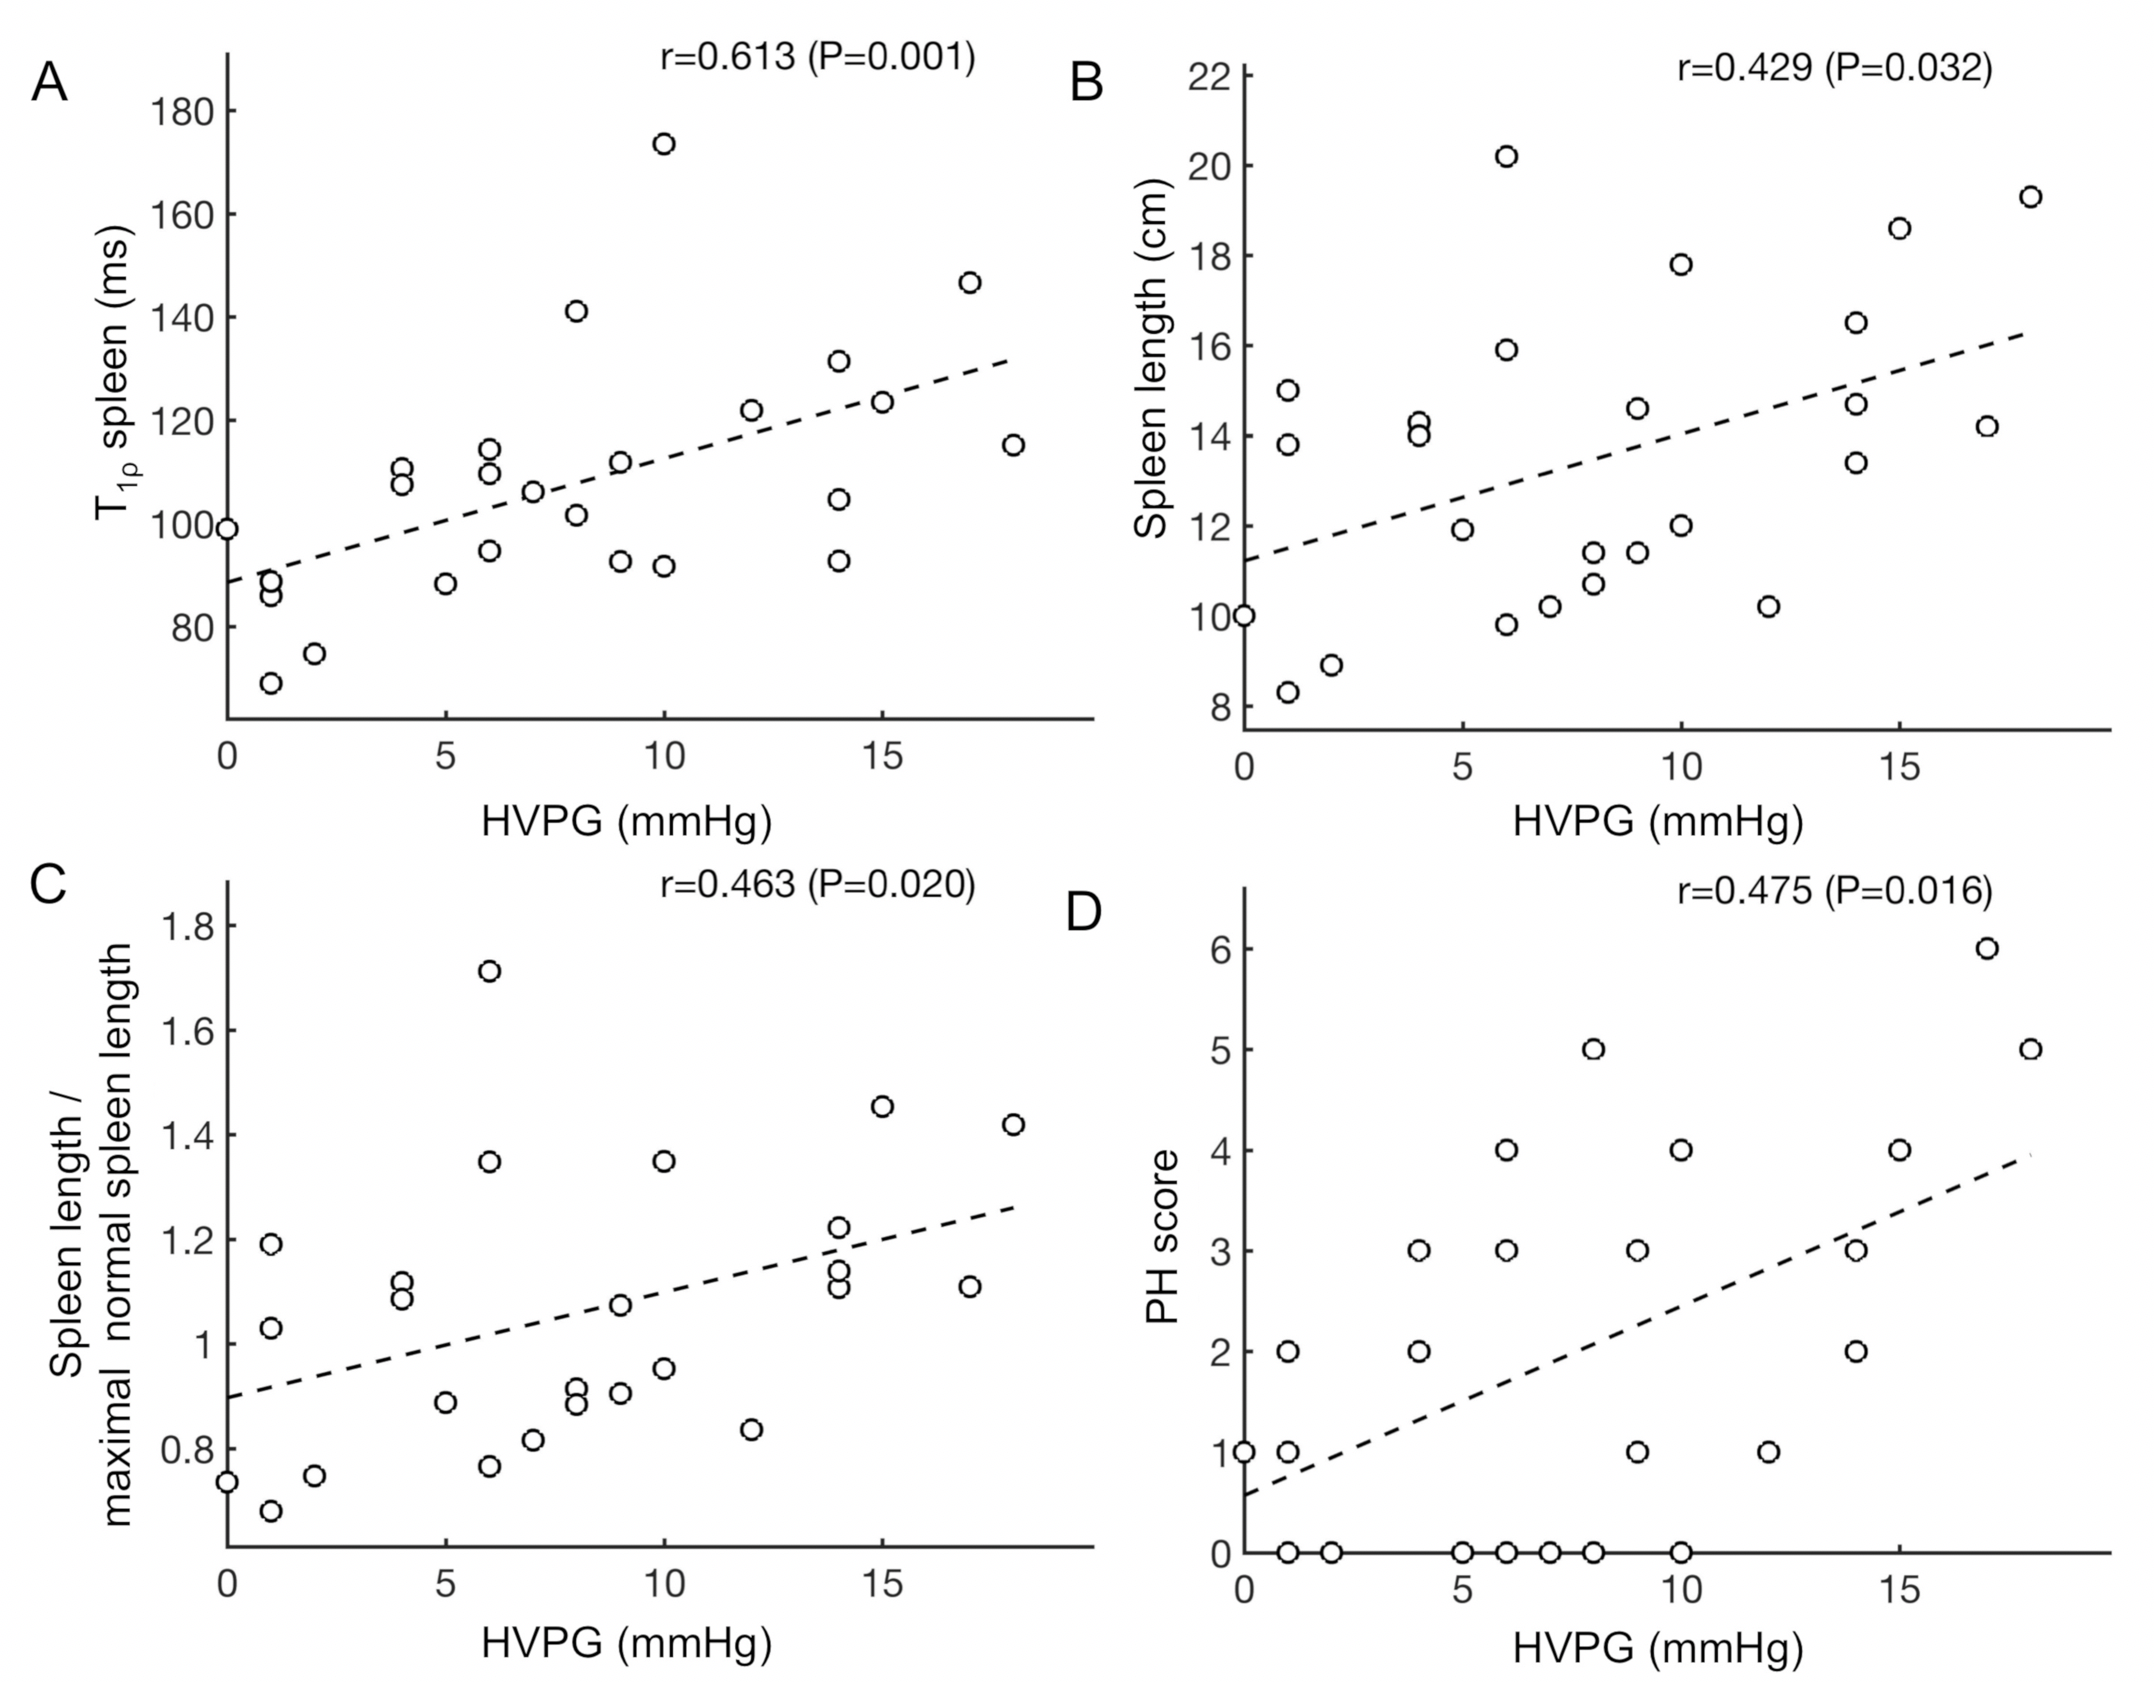
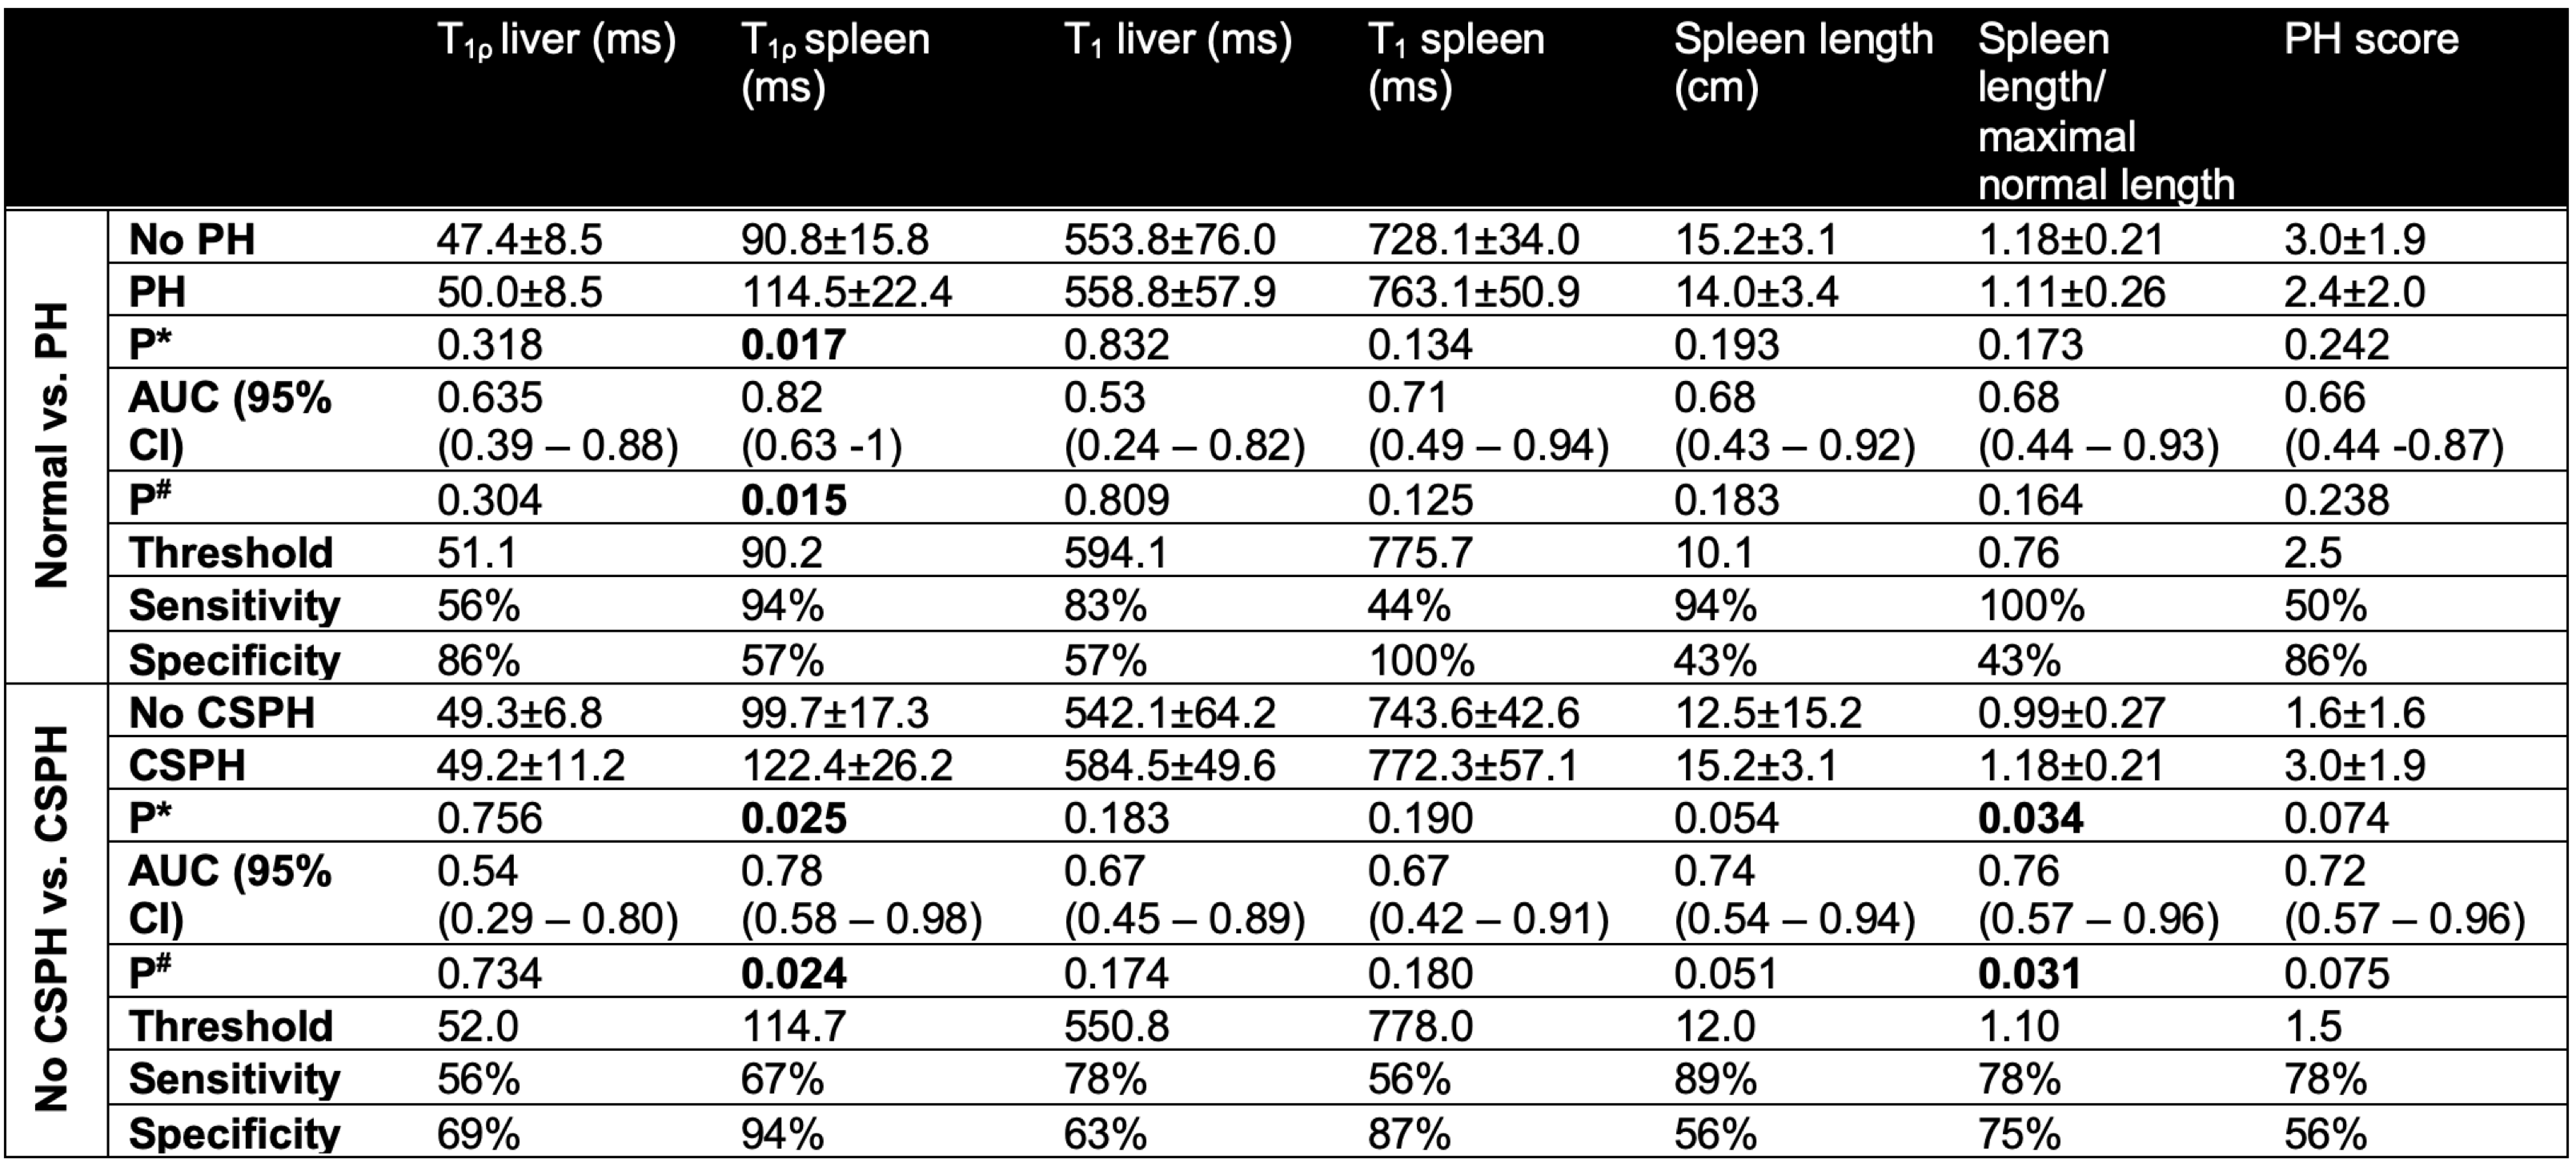
Mean HVPG measurement was 7.8±5.3 mmHg (PH, n=18 (72%) including CSPH, n=9 (36%)]. Representative T1 and T1ρ maps of patients with no PH, PH and CSPH are shown in Figure 1. PH score, (normalized) spleen length and spleen T1ρ positively significantly correlated with HVPG, with strongest correlation found for spleen T1ρ (r=0.613, P=0.001; Figure 2). Table 1 shows the diagnostic performance for each of the assessed parameters for prediction of (CS)PH. Spleen T1ρ was the only parameter that showed significant diagnostic performance for assessment of PH (AUC 0.817, P=0.015; Table 1). For prediction of CSPH, the strongest diagnostic performance was also observed for spleen T1ρ (AUC=0.778, P=0.024). Normalized spleen length also showed significant diagnostic performance for prediction of CSPH, with a slightly lower AUC (AUC=0.764, P=0.031). Radiological PH score, T1ρ and T1 of the liver and T1 in the spleen did not show significant diagnostic performance for assessment of (CS)PH (P>0.075).Discussion
In our pilot study, we found that splenic T1ρ showed a highly significant positive correlation with HVPG, while liver T1ρ and T1 in both liver and spleen did not show any significant correlation with HVPG. Splenic T1ρ showed improved diagnostic performance of PH compared to radiological assessment, including the previously described radiological PH score (4). The significant correlation of spleen T1ρ with portal pressure may sound counterintuitive, since the pathophysiology of splenomegaly in PH patients is often believed to be caused by blockage of the blood flow through the splenic vasculature and consequent pooling of blood in the red pulp (congestion) (6). The congestive splenomegaly does not likely affect T1ρ. However, histopathological assessment of splenic tissues has shown other effects of PH on the splenic parenchyma, including hyperplasia of histiocytes and increase of reticuloendothelial fibers that evolves into diffuse fibrosis (6). The elevation in T1ρ in the spleen with increased PH severity may reflect the deposition of collagen during the fibrogenesis. In the liver, we did not find significant correlation of HVPG with T1ρ, while it would be expected that the increase in portal pressure would be related to the amount of scarring/fibrosis in the liver leading to obstructed flow (7). We believe that the lack of correlation in the liver may be attributable to possible confounding factors to accurate T1ρ measurement in the liver, including iron deposition and presence of inflammation (8). Similarly, the lack of correlation of T1 measurements with HVPG may also be due to confounding factors on T1 estimation (9).Conclusion
Spleen T1ρ may be a suitable noninvasive biomarker for prediction of portal hypertension. Our initial results need to be validated in a larger cohort.Acknowledgements
This research was supported by NIDDK grant R01DK113272.References
1. de Franchis R, Baveno VF. Revising consensus in portal hypertension: report of the Baveno V consensus workshop on methodology of diagnosis and therapy in portal hypertension. J Hepatol 2010;53(4):762-768.
2. Qi X, Berzigotti A, Cardenas A, Sarin SK. Emerging non-invasive approaches for diagnosis and monitoring of portal hypertension. The lancet Gastroenterology & hepatology 2018;3(10):708-719.
3. Escorsell A, Garcia-Pagan JC, Bosch J. Assessment of portal hypertension in humans. Clin Liver Dis 2001;5(3):575-589.
4. Kihira S, Kagen AC, Vasudevan P, Jajamovich GH, Schiano TD, Andrle AF, Babb JS, Fischman A, Taouli B. Non-invasive prediction of portal pressures using CT and MRI in chronic liver disease. Abdominal radiology 2016;41(1):42-49.
5. Chow KU, Luxembourg B, Seifried E, Bonig H. Spleen Size Is Significantly Influenced by Body Height and Sex: Establishment of Normal Values for Spleen Size at US with a Cohort of 1200 Healthy Individuals. Radiology 2016;279(1):306-313.
6. Bolognesi M, Merkel C, Sacerdoti D, Nava V, Gatta A. Role of spleen enlargement in cirrhosis with portal hypertension. Digestive and liver disease : official journal of the Italian Society of Gastroenterology and the Italian Association for the Study of the Liver 2002;34(2):144-150.
7. Sourianarayanane A, Talluri J, Humar A, McCullough AJ. Stage of fibrosis and portal pressure correlation in nonalcoholic steatohepatitis. Eur J Gastroenterol Hepatol 2017;29(5):516-523.
8. Xiang J. Wang Y, Chen W, Deng M. How liver pathologies contribute to T1rho contrast require more careful studies. Quant Imaging Med Surg 2017;7(5):608-613.
9. Hoad CL, Palaniyappan N, Kaye P, Chernova Y, James MW, Costigan C, Austin A, Marciani L, Gowland PA, Guha IN, Francis ST, Aithal GP. A study of T(1) relaxation time as a measure of liver fibrosis and the influence of confounding histological factors. NMR Biomed 2015;28(6):706-714.
Figures