0319
Gd-EOB-DTPA-enhanced MRI in Nonalcoholic Steatohepatitis (NASH): Liver Fibrosis or Liver Function?1Athinoula A. Martinos Center for Biomedical Imaging, Institute for Innovation in Imaging (i3), Department of Radiology, Massachusetts General Hospital and Harvard Medical School, Charlestown, MA, United States, 2Department of Gastroenterology and Hepatology, Zhongshan Hospital, Fudan University, Shanghai, China, 3Division of Surgical Oncology, Massachusetts General Hospital and Harvard Medical School, Boston, MA, United States
Synopsis
Nonalcoholic steatohepatitis (NASH) promotes fibrotic remodeling of the liver parenchyma, which may lead to cirrhosis, liver failure, or hepatocellular carcinoma. Gd-EOB-DTPA is a hepatobiliary T1 MRI contrast agent, receiving increasing attention as a tool for detecting and staging liver fibrosis. Here, using a choline-deficient high-fat diet (CDAHFD) for different durations we modeled NASH disease progression in rats and performed Gd-EOB-DTPA-enhanced MRI at different disease stages, correlating imaging histological measures of fibrosis as well as liver function tests. Gd-EOB-DTPA-enhanced MRI correlated well with liver function tests but not with liver fibrosis.
Introduction
Nonalcoholic steatohepatitis (NASH) is a type of nonalcoholic fatty liver disease (NAFLD), with an estimated prevalence of 5% in the general population (1). NASH promotes fibrotic remodeling of the liver parenchyma, which may lead to cirrhosis, liver failure, or hepatocellular carcinoma (2). Liver biopsy is the gold standard for diagnosing NASH, but is limited by sampling error, complication risk, and cannot be used for serial monitoring. Gd-EOB-DTPA, a hepatobiliary T1 MRI contrast agent, is routinely used in clinical setting for detection and characterization of focal liver lesions and has recently received increasing attention as a tool for detecting and staging liver fibrosis (3-5). Here, using a choline-deficient high-fat diet for different durations we modeled NASH disease progression in rats and evaluated the relationship between Gd-EOB-DTPA-induced changes in longitudinal relaxation R1 and the degree of liver fibrosis assessed by histology as well as liver function measured by serum biomarkers, with the goal of determinin the diagnostic performance of Gd-EOB-DTPA-enhanced MRI in staging liver fibrosis.Methods
Animal model: Male Wistar rats were fed a choline-deficient, L-amino acid-defined, high-fat diet consisting of 60 kcal% fat and 0.1% methionine by weight for 2, 6, 9 or 12 weeks (N=8/group) to induce NASH. Age-matched animals receiving standard diet were used as controls (N=14).In vivo MRI: Animals were anesthetized with isoflurane (1-2%) and imaged with a 1.5T Siemens MRI scanner. T1 mapping was performed with respiratory-gated, three-dimensional inversion recovery (IR) images at multiple inversion time (TI) (50-1500 ms) prior to and 20 minutes following intravenous administration of Gd-EOB-DTPA (10 µmol/kg). Additional IR images with the TI closest to the null point of liver before contrast agent were repeated 4-5 times after contrast injection before the post-contrast T1 mapping.
Image analysis: T1 maps before and after Gd-EOB-DTPA was generated using a MATLAB (MathWorks, Natick, MA) program for the voxel-wise nonlinear least-squares fitting of the IR signal intensity (S) as a function of TI and TR. The fitted parameters were used to estimate the T1 maps from the additional single-TI IR images after contrast injection. ROI analysis of liver tissue was performed on the R1 (=1/T1) maps at before, 5 and 20 minutes after Gd-EOB-DTPA injection to obtain ∆R1 values. The washout rate of Gd-EOB-DTPA was defined as the linear regression slope of the ∆R1 values between 5 and 20min post-injection.
Tissue and serum biomarker analyses: After MRI, the livers were collected, fixed, and stained with Sirius Red and hematoxylin and eosin (H&E). Collagen proportional area (CPA), defined as the %-area stained positive by Sirius Red, was measured using Image J (NIH, Bethesda MD). Similarly, morphometric quantitation of hepatic steatosis was measured as the percentage of lipid vacuolization (%LV) on the H&E slides. Other pieces of liver tissue were digested and analyzed for hydroxyproline (Hyp) content. Serum biomarkers of liver function including alanine aminotransferase (ALT), alkaline phosphatase, albumin, total bilirubin, and glucose were measured (DRI-CHEM; Heska AG, Switzerland).
Statistical Analysis: Differences among groups were tested with one-way ANOVA followed by Tukey-Kramer post-hoc test with P<0.05 considered as significant. Correlation between in vivo MR measurements and ex vivo tissue quantification was assessed by Spearman's rank correlation coefficient.
Results
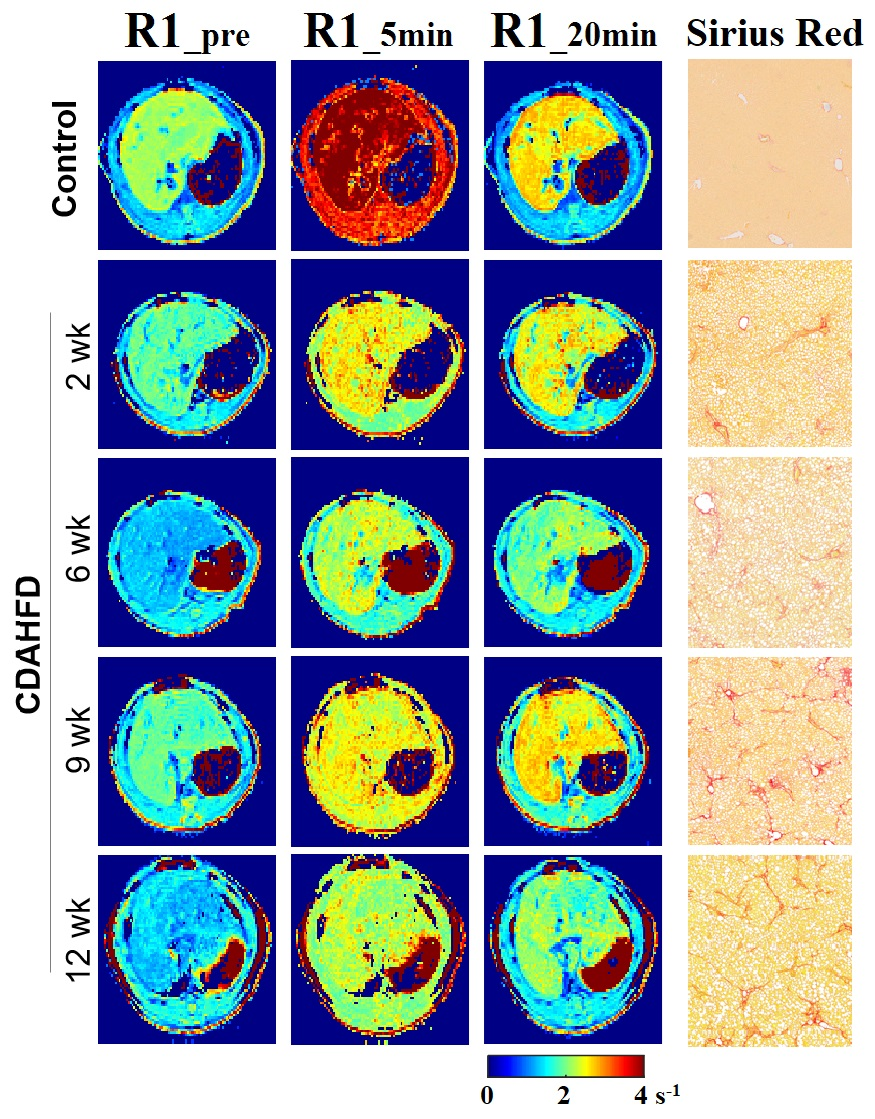
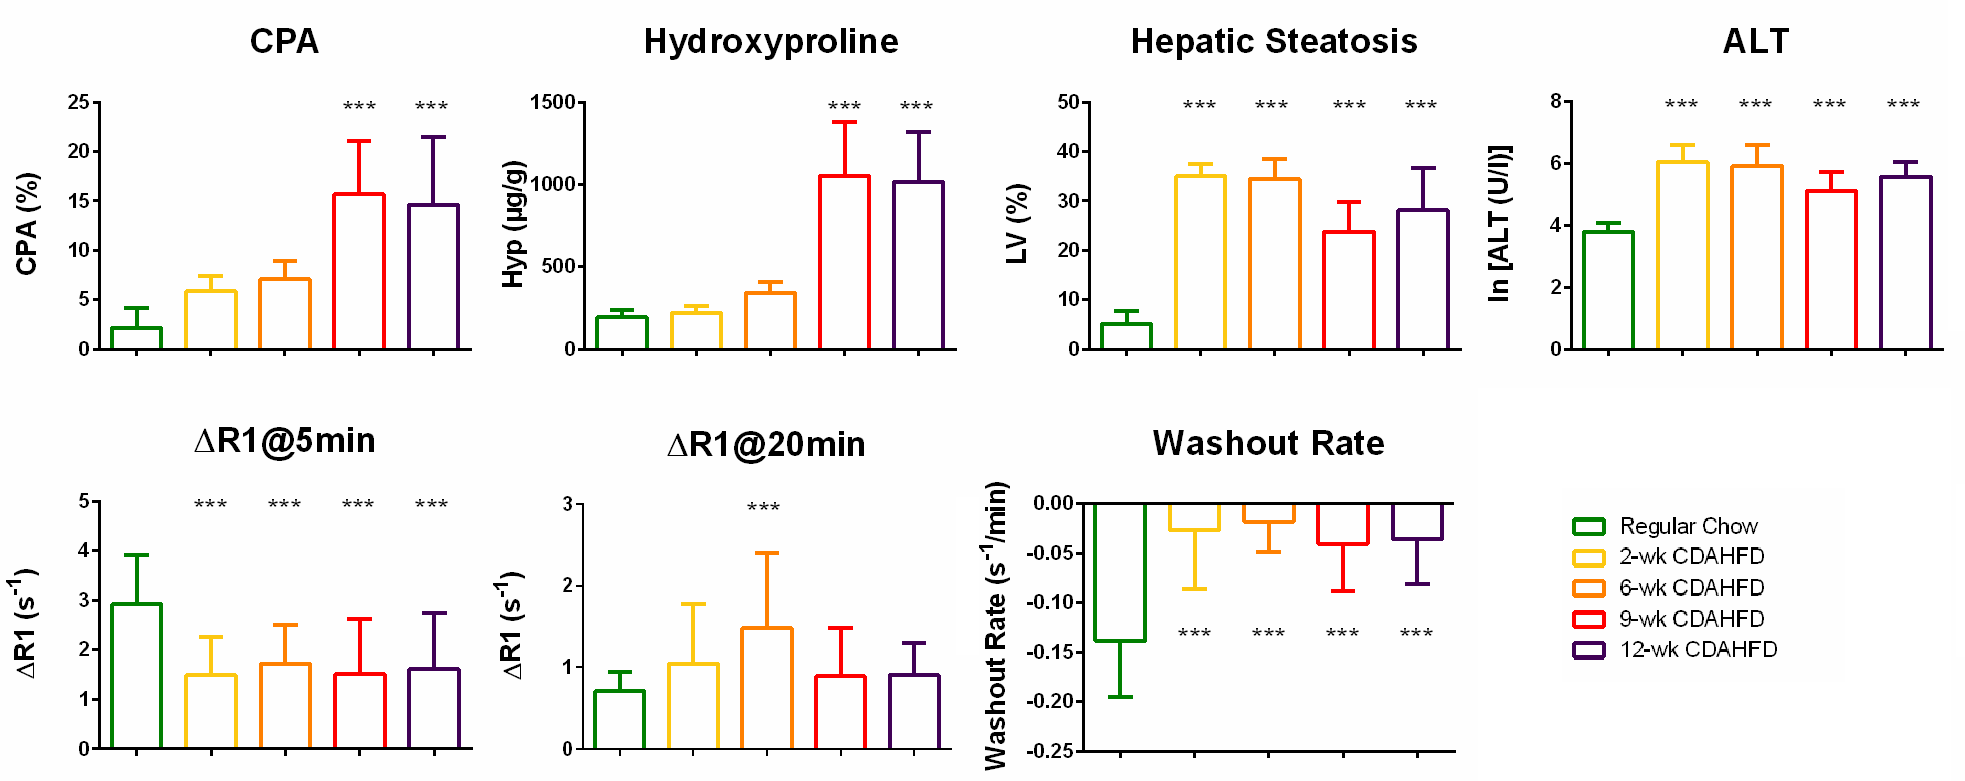
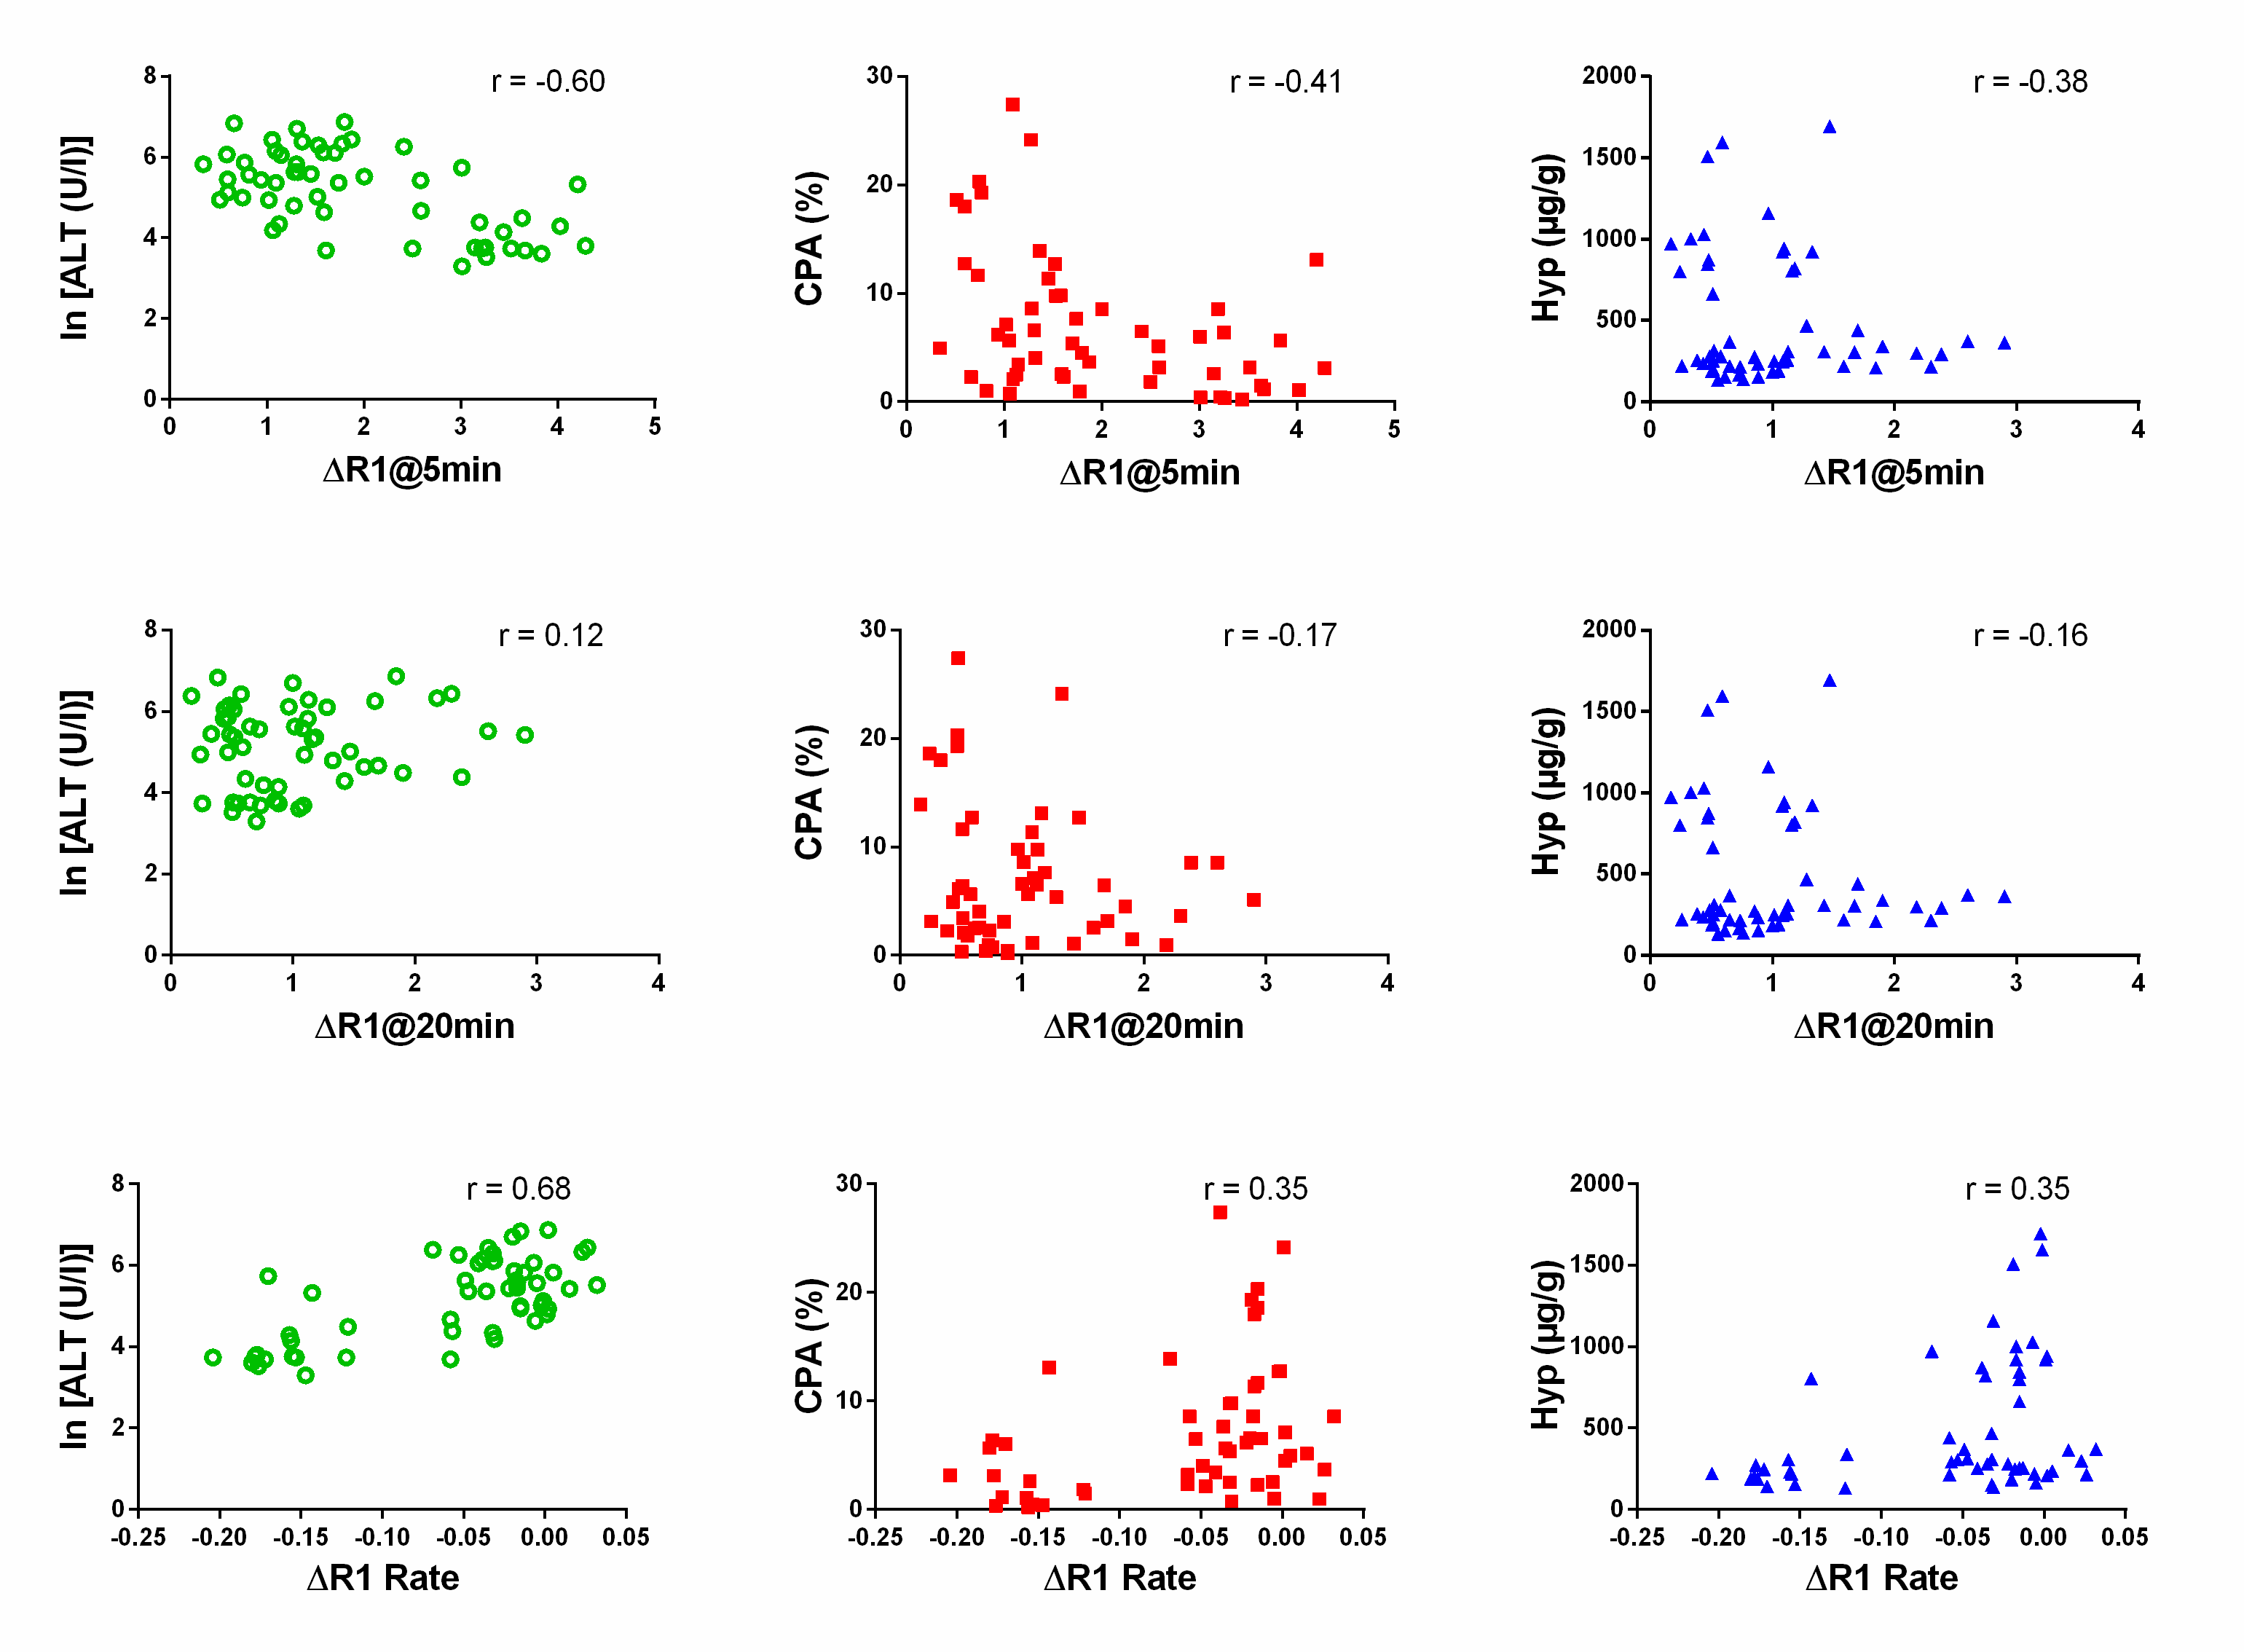
Representative R1 images acquired before and 20 min after Gd-EOB-DTPA and corresponding Sirius Red staining are shown in Fig. 1. CDAHFD-induced liver fibrosis was found in rats received 9 or 12 weeks of diet, seen as significantly increased CPA and Hyp as compared to that in control animals (Fig. 2a&2b). Two weeks of CDAHFD resulted in rapid formation of liver steatosis that evidenced by increased %LV in H&E images, which remain elevated for longer duration on diet with a small reduction at later stage as steatosis was replaced by fibrosis (Fig. 2c). Liver serum ALT was elevated in all CDAHFD groups as compared to normal controls (Fig. 2d). ∆R1 at 5 min post-contrast was significantly lower in all CDAHFD groups, indicating lower initial uptake of Gd-EOB-DTPA (Fig. 2e). Compared to normal controls, increased ∆R1 at 20 min post-contrast was only observed after 6 weeks of CDAHFD (Fig. 2f). The washout rate of Gd-EOB-DTPA was significantly slower in all CDAHFD groups (Fig. 2g). No significant difference in ∆R15min or washout rate was observed among different duration on CDAHFD. Fig. 3 shows significant correlation of ∆R15min, washout rate with serum ALT but not with CPA and Hyp.Discussion
Gd-EOB-DTPA is taken up selectively by hepatocytes and subsequently excreted into the bile by transporters. Recently, several clinical studies used the relative signal enhancement of Gd-EOB-DTPA in liver parenchyma to quantify fibrosis progression in liver diseases like NASH and hepatitis B/C (5-11). However, the altered uptake and kinetics of Gd-EOB-DTPA may not be specific to liver fibrosis in the way that a molecularly targeted probe is (12). Inflammation (13), collagen deposition during fibrosis (7,9), and suppressed biliary excretion (4) can all affect the uptake and diffusion of Gd-EOB-DTPA. Here, we found that ∆R15min and washout rate correlated well with liver function as measured by serum biomarker but not with fibrosis degree as determined by histology or biochemical assay.Conclusion
Using a well-controlled rat model of NASH, we found Gd-EOB-DTPA-enhanced MRI assesses liver function but not liver fibrosis.Acknowledgements
No acknowledgement found.References
[1] Vernon G, et al. Alimentary pharmacology & therapeutics 2011;34:274-85.
[2] Bataller R, et al. The Journal of clinical investigation 2005;115:209-18.
[3] Tsuda N, et al. Invest Radiol 2007;42:242-7.
[4] Tsuda N, et al. Eur J Radiol 2010;73:137-42.
[5] Haimerl M, et al. Scientific reports 2017;7:41429.
[6] Saito K, et al. European radiology 2014;24:112-9.
[7] Chen BB, et al. European radiology 2012;22:171-80.
[8] Bastati N, et al. Radiology 2014;271:739-47.
[9] Feier D, et al. Radiology 2013;269:460-8.
[10] Haimerl M, et al. PloS one 2013;8:e85658.
[11] Pan S, et al. World journal of gastroenterology 2018;24:2024-35.
[12] Caravan P, et al. Angewandte Chemie 2007;46:8171-3.
[13] Yamada T, et al. Magn Reson Imaging 2016;34:724-29.
Figures