0318
B1 inhomogeneity-corrected T1 mapping in quantitative evaluation of liver fibrosis using Gd-BOPTA enhanced MR imaging1Department of Radiology, Shandong Provincial Hospital, Jinan, China, 2MR Scientific Marketing, Siemens Healthcare, Beijing, China, 3MR Scientific Marketing, Siemens Healthcare, Shanghai, China
Synopsis
The purpose of this study was to determine whether B1 inhomogeneity-corrected volumetric T1 mapping of Gd-BOPTA enhanced liver MR imaging are able to evaluate the degree of liver cirrhosis and to investigate their relationship with the histological grading. Our study found that B1 inhomogeneity-corrected T1 mapping using Gd-BOPTA enhanced MR imaging could be used in the quantitative evaluation of liver fibrosis.
Introduction
Liver fibrosis is a common progressive chronic liver disease, which might be developed at increasing risk of cirrhosis and hepatocellular carcinoma (HCC)1. Accurate assessment of liver fibrosis is crucial in determining the treatment plan for patients and improving the prognosis. Liver fibrosis could cause the changes of tissue properties, such as, iron overloading and edema, and thus affected the T1 values. Gd-BOPTA, as a widely used hepatobiliary-specific MR contrast agent, has advantages in diagnosing focal liver lesions and may be a valuable assessment tool for the estimation of liver function2,3. The purpose of this study was to determine whether B1 inhomogeneity-corrected volumetric T1 mapping of Gd-BOPTA enhanced liver MR imaging are able to evaluate the degree of liver cirrhosis and to investigate their relationship with the histological grading.Methods
118 patients with hepatitis B virus infection (47 female; mean age 41.6±5.9 years) were enrolled in the present study. The inclusion criteria were (i) liver surgery or biopsy was performed; (ii) Child-Pugh class A based on Child-Pugh classification. Exclusion criteria included (i) hepatitis C virus infection, nonalcoholic steatohepatitis or other chronic liver diseases; (ii) Child-Pugh class B or higher. All patients underwent MRI scan at a 3T scanner (MAGNETOM Prisma, Siemens Healthcare, Erlangen, Germany) with an 18-channel body matrix coil. The axial T1-weighted VIBE sequence with dual flip angles was acquired with the following parameters: repetition time (TR), 5.01 ms; echo time (TE), 2.3 ms; flip angles, 3o and 15o; slice thickness, 3 mm; number of partitions, 48; FOV, 350 mm × 308 mm; bandwidth, 300 Hz/pixel; acquisition time, 17 s. Prior to T1-weighted VIBE acquisition, to correct B1 heterogeneity, a B1 mapping pulse sequence was performed to cover the entire liver using the saturated 2D Turbo FLASH method with the following parameters: Slice thickness, 8mm; number of slices, 15; TR, 5050.0 ms; TE, 1.83 ms; flip angle, 8o; FOV, 350 mm × 308 mm; bandwidth, 490 Hz/pixel, acquisition time, 8 s. Gd-BOPTA was used via vessel injection, with the injection rate of 1 ml/s and the bolus of 0.2ml/kg. T1-weighted VIBE sequences were acquired with breath holding both before and after contrast media injection in the hepatobiliary phase (90 min). All the scans were performed with breath-holding. B1-corrected T1 maps were constructed inline using the vendor software MapIt (Siemens Healthcare). Regions of interest (ROIs) were manually drawn to cover the maximum of liver parenchyma at the same slices of both pre- and post-contrast enhanced (CE) T1 maps, carefully avoiding focal lesions and major branches of the vessels. The changes of T1 values after CE was calculated and correlated with the degrees of liver fibrosis, indicated by histological grades of biopsy or samples after surgery.Results
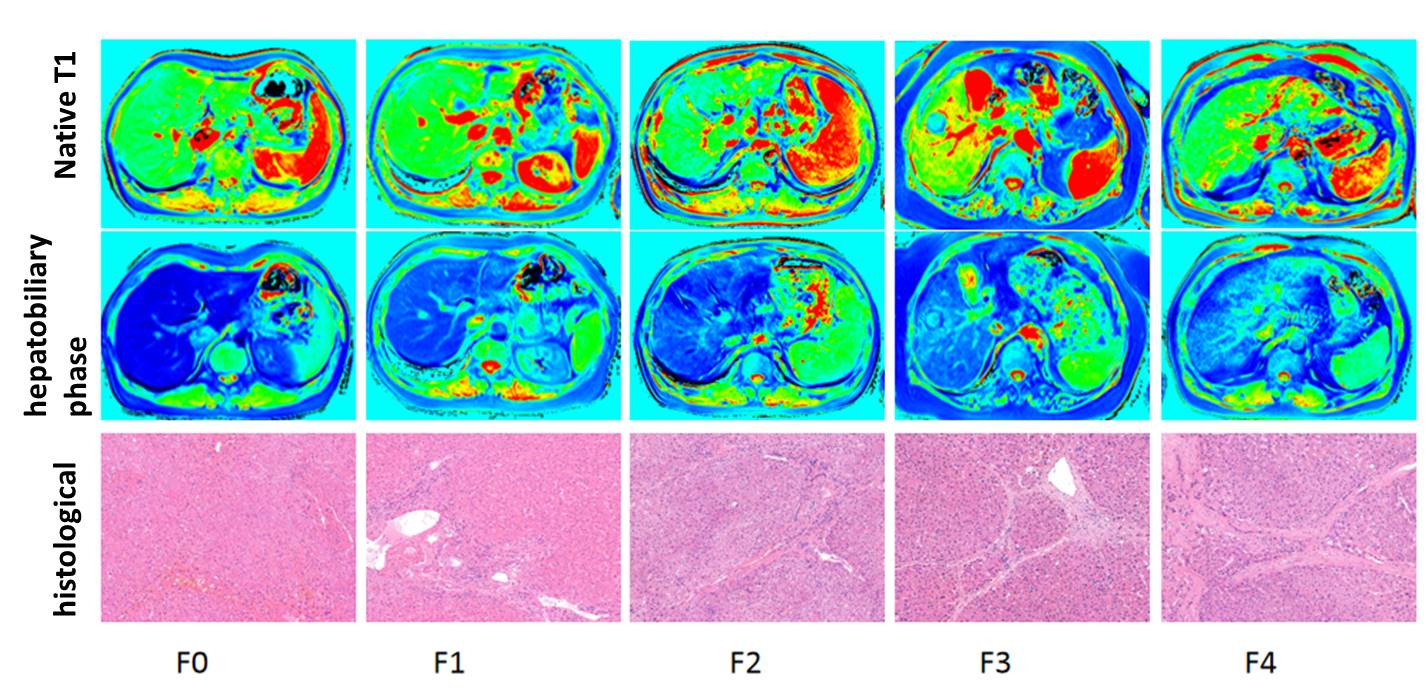
Figure 1 shows a demonstration that the B1-corrected T1 maps could substantially improve the distribution of T1 values in the liver, compared to uncorrected T1 maps. Using histopathological analysis, the stages of fibrosis in all patients were distributed with fibrosis (F) from F0 to F4. Figure 2 shows five patients with different F stages, and their corresponding T1 maps at pre-contrast and hepatobiliary phase. The mean native T1 values and shorted T1 values at hepatobiliary phase at F0 to F4 stage were extracted by manual ROIs, and then the T1 value changes were calculated: 637.48 ms, 601.55 ms, 575.85 ms, 529.89 ms, 499.50 ms, respectively. The T1 value changes between F1 or lower and F2 or higher were significantly different (P<0.05), while the T1 value changes between F3 or lower and F4 were significantly different (P<0.05) (Figure 3). ROC analysis were displayed in Figure 4.Discussion & Conclusion
There were no significant differences in native T1 among different F stages. However, using Gd-BOPTA enhanced MR imaging, the T1 shortening effect is substantially different, especially between F1 and F2, which could be used for early detection of fibrosis and in distinguishing slight and moderate fribosis. , and between F3 or lower and F4, indicating advancement into liver cirrhosis. In conclusion, B1 inhomogeneity-corrected T1 mapping using Gd-BOPTA enhanced MR imaging could be used in the quantitative evaluation of liver fibrosis.Acknowledgements
NoneReferences
1. Gupta, R.T., et al., Hepatic hemangiomas: difference in enhancement pattern on 3T MR imaging with gadobenate dimeglumine versus gadoxetate disodium. Eur J Radiol, 2012. 81(10): p. 2457-62.
2. Smith, A.D. and J.C. Veniero, Gd-EOB-DTPA as a functional MR cholangiography contrast agent: imaging gallbladder filling in patients with and without hepatobiliary dysfunction. J Comput Assist Tomogr, 2011. 35(4): p. 439-45.
3. Jia, J., et al., A LC-MS/MS method to evaluate the hepatic uptake of the liver-specific magnetic resonance imaging contrast agent gadoxetate (Gd-EOB-DTPA) in vitro and in humans. J Chromatogr B Analyt Technol Biomed Life Sci, 2012. 891-892: p. 20-6.
Figures