0317
Mapping Metabolic Inflexibility in NAFLD: Comparison With Healthy Volunteers and Following L-Carnitine Intervention Using Advanced MRS.1NIHR Nottingham Biomedical Research Centre, University of Nottingham, Nottingham University Hospitals NHS Trust and the University of Nottingham, Nottingham, United Kingdom, 2Sir Peter Mansfield Imaging Centre, University of Nottingham, Nottingham, United Kingdom, 3School of Life Sciences, University of Nottingham, Nottingham, United Kingdom
Synopsis
Advanced MRI techniques such as 1H MRS at 7T and saturation transfer 31P MRS offer unique capabilities to map metabolic conditions and complement current physiological methodologies. The aim of this study was to build a metabolic profile for NAFLD v healthy volunteers by measuring physiological metabolic markers alongside 1H MRS measurement of liver lipid, intra- (IMCL) and extra- (EMCL) myocellular lipid fraction, and dynamic 31P MRS measurements of ATP flux rates, and to investigate the effect of a 24 week L-carnitine intervention. Interim analysis shows metabolic inflexibility in NAFLD patients compared with HV and a potential benefit of L-carnitine supplementation
INTRODUCTION
Insulin resistance has emerged as the pathogenic hallmark of non-alcoholic fatty liver disease (NAFLD) and studies suggest that both structural and functional defects in hepatic mitochondrial metabolism occur in the setting of NAFLD [1].Recent dynamic imaging and physiological studies have identified ectopic skeletal muscle fat accumulation as the precursor to whole-body insulin resistance and NAFLD progression [1, 2]. L-Carnitine has been shown to reduce these lipid stores leading to potential improvements in liver fat [3], however few studies have considered the impact on hepatic oxidative metabolism and whole-body insulin sensitivity.
The aim of this study was to build a complete metabolic profile for NAFLD v Healthy Volunteers (HV) by measuring physiological metabolic markers alongside 1H MRS measurement of liver lipid, intra- (IMCL) and extra- (EMCL) myocellular lipid fraction, and dynamic 31P MRS measurements of ATP flux rates.
METHODS
Non-diabetic males with elevated liver fat >5.5% (NAFLD) were recruited alongside healthy volunteers.Following an overnight fast, participants were scanned in a Philips 3T Acheiva for intra hepatic triglycerides (IHTG derived from proton density fat fractions) and ATP flux measurements, and then in a Philips 7T Acheiva for intra- (IMCL) and extra- (EMCL) myocellular lipid fractions. Blood samples were taken for Alanine aminotransferase (ALT), and participants also underwent a dual-step euglycaemic clamp with indirect calorimetry and femoral arteriovenous sampling to measure whole body insulin sensitivity, substrate oxidation and insulin-mediated glucose transport.
NAFLD patients subsequently underwent a randomized, double-blind, placebo-controlled 24 week intervention where they received either L-carnitine L-tartrate (2 grams twice per day) together with a Slimfast supplement, or maltodextrin placebo with Slimfast. Following the 24 week period, patients repeated baseline measures.
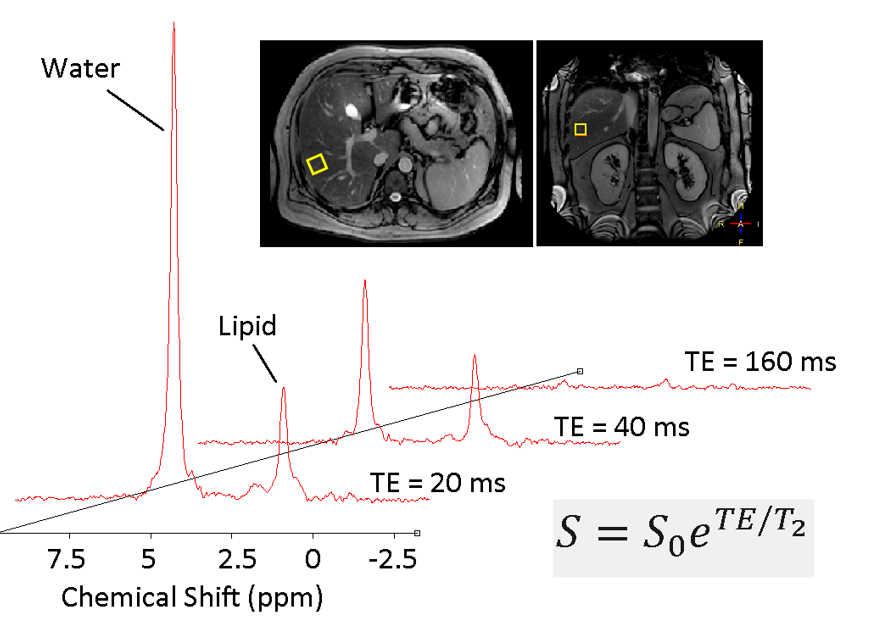
1H MRS Liver fat fraction. STEAM localised 1H MRS were acquired from a 20x20x20mm voxel in the lower right lobe of the liver with a Philips XL 16 channel torso coil. Spectra were acquired during one breath hold (TR=4000 ms, TE=20,40,80,160ms) and repeated with water suppression (4 averages per spectra). Data was post-processed in jMRUI (manually phase corrected, frequency aligned, line broadened) and fitted using AMARES peak fitting with prior knowledge [4]. Multi-echo amplitudes were used to determine water and fat T2, and IHTG was calculated [5].
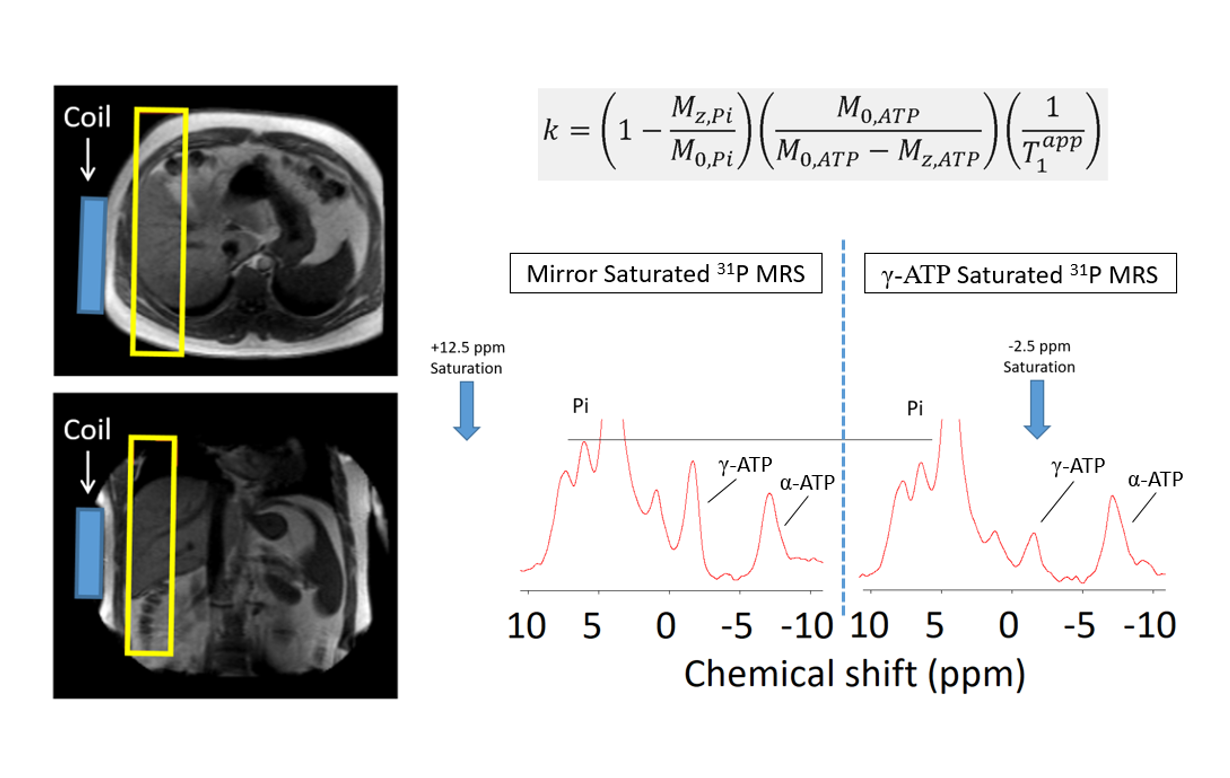
31P MRS Hepatic ATP flux. Slice localized 31P MRS were acquired from the liver using a Philip 31P single loop surface coil. Apparent T1 (T1app) was measured using progressive saturation 31P MRS (5 spectra fitted using jMRUI) as described previously [6]. ATP rate constant (k) was then calculated from two 31P MRS spectra, one fully saturating γ-ATP (-2.5ppm) and the second mirrored about the Pi peak [6]. Total scan time for participants was ~1 hour 15 minutes.
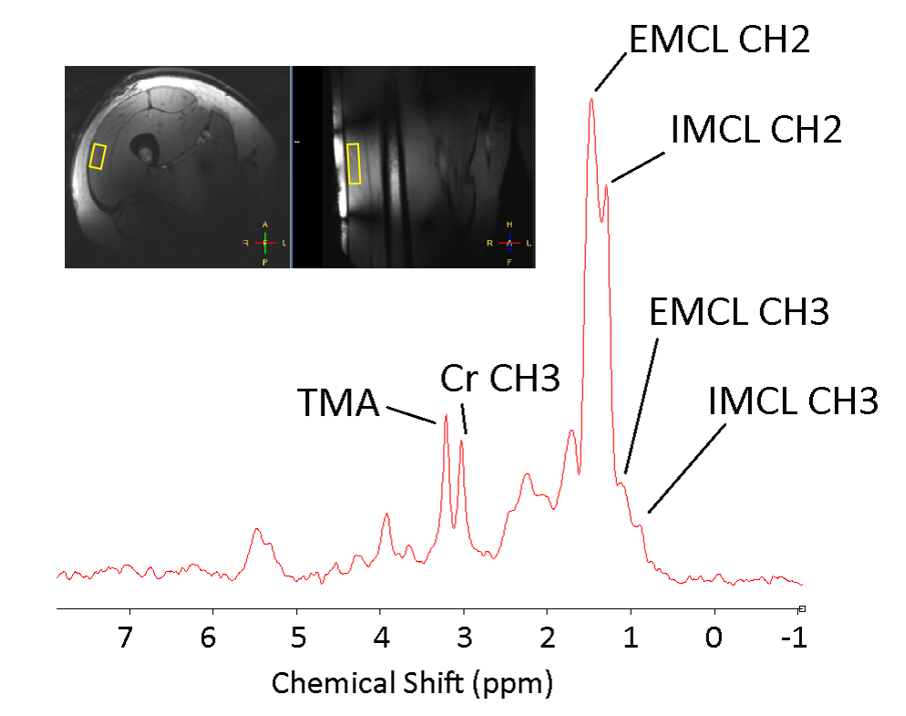
1H MRS IMCL/EMCL. STEAM localized 1H MRS were acquired from a 10x30x50mm voxel in the vastus lateralis with an MRCoils quadrature surface coil on a Philips 7T Acheiva scanner. Non-water supressed and water suppressed spectra were acquired at 4 different echo times (TR=4000ms,16 averages at TE=20ms and 8 averages at TE=40,80 and 160ms). Spectra were line broadened and phase corrected using an in-house Matlab script, and a peak-dispersion fitting algorithm was developed to fit EMCL and IMCL peaks accounting for muscle fibre orientation [7]. Multi-echo amplitudes were used to determine water and fat T2, lipid fraction and IMCL/EMCL ratios.
RESULTS
18 NAFLD patients (Age=33±8yrs, BMI=27±3kg/m2) and 13 HV (Age=37±9yrs, BMI=32±4 kg/m2) have been recruited and completed baseline scans to data. Acquired 1H MRS have shown good SNR and spectral resolution, with increased field at 7T providing obvious splitting of IMCL and EMCL peaks (figures 1–3). IHTG is 1±1% in HV and 26±12% in NAFLD, ALT is 28±12 IU/l in HV and 66±31 UI/L in NAFLD. ATP flux rate constant k for each participant is shown in Figure 4A, and is significantly lower in NAFLD (0.12±0.11) compared with HV (0.30±0.18, p=0.002). EMCL/IMCL ratios are significantly greater (P=0.05) in NAFLD (1.56±1.5) compared with HV (0.27±0.2). Whole-body insulin sensitivity profiles are significantly lower in NAFLD (p<0.01) with indirect calorimetry data demonstrating metabolic inflexibility (reduced carbohydrate oxidation and attenuated leg glucose uptake during hyperinsulinemia).11 NAFLD patients have completed the intervention period to date, and data remains blinded to intervention group (L-Carnitine vs Placebo). Interim analyses shows that BMI remains constant across visits, whilst k increases in both groups (Figure 4b). ALT values are also reduced in both groups with a greater reduction in group I. Average IHTG values decrease in Group I and increase in Group II (Group I: Visit1 IHTG=22±15%, Visit2=19±17%; Group II: Visit1 IHTG=35±7%, Visit2 IHTG=43±12%, Group I Visit1 vs Visit2 p=0.028).
DISCUSSION
Advanced MRI techniques such as 1H MRS at 7T and saturation transfer 31P MRS offer unique capabilities to map metabolic conditions and complement current physiological methodologies providing a complete metabolic picture. Interim analysis of this study shows metabolic inflexibility in NAFLD patients and the potential beneficial impact of L-carnitine on liver fat and carbohydrate and lipid metabolism. Completion of the intervention part of this study will help to determine whether L-Carnitine provides a potential adjunctive treatment option in NAFLD relevant to clinical practice. Understanding the impact on skeletal muscle lipids and hepatic ATP flux rates will also help elucidate the mechanisms of metabolic disease progression.Acknowledgements
No acknowledgement found.References
1. Petersen, K.F., et al., The role of skeletal muscle insulin resistance in the pathogenesis of the metabolic syndrome. Proc Natl Acad Sci U S A, 2007. 104(31): p. 12587-94.
2. Kim, J.K., et al., Redistribution of substrates to adipose tissue promotes obesity in mice with selective insulin resistance in muscle. Journal of Clinical Investigation, 2000. 105(12): p. 1791-1797.
3. Malaguarnera, M., et al., L-Carnitine Supplementation to Diet: A New Tool in Treatment of Nonalcoholic Steatohepatitis-A Randomized and Controlled Clinical Trial. American Journal of Gastroenterology, 2010. 105(6): p. 1338-1345.
4. Hamilton, G., et al., In vivo characterization of the liver fat H-1 MR spectrum. Nmr in Biomedicine, 2011. 24(7): p. 784-790.
5. Stephenson, M.C., et al., Variability in fasting lipid and glycogen contents in hepatic and skeletal muscle tissue in subjects with and without type 2 diabetes: a 1H and 13C MRS study. NMR in Biomedicine, 2013. 26: p. 1518 - 1526.
6. Chen, C., et al., P-31 magnetization transfer magnetic resonance spectroscopy: Assessing the activation induced change in cerebral ATP metabolic rates at 3 T. Magnetic Resonance in Medicine, 2018. 79(1): p. 22-30.
7. Khuu, A., et al., Orientation of Lipid Strands in the Extracellular Compartment of Muscle: Effect on Quantitation of Intramyocellular Lipids. Magnetic Resonance in Medicine, 2009. 61(1): p. 16-21.
Figures
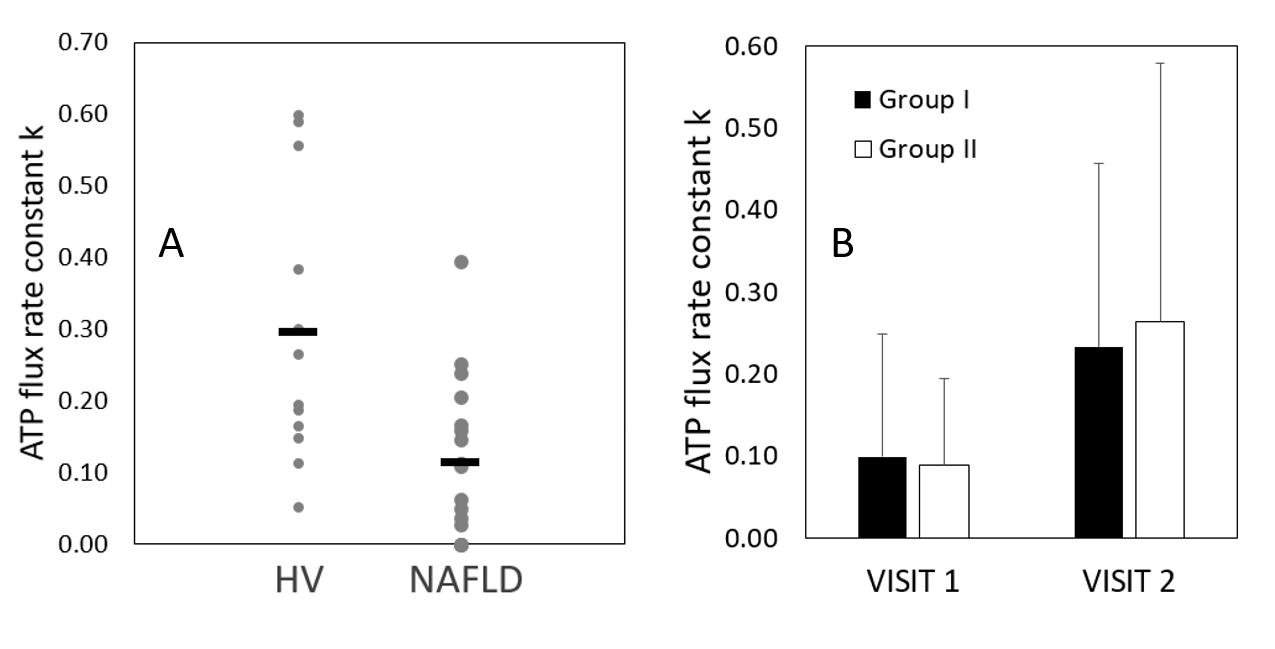
A. Graph showing ATP flux rate constant (k) in healthy volunteers (HV) and non-alcoholic fatty liver disease patients (NAFLD) with average value marked (–).
B. Graph showing changes in k in each group form Visit 1 to Visit 2.