0316
Mapping glycogen concentration in vivo based on the nuclear Overhauser enhancement (NOE) with water (glycoNOE)1The Russell H. Morgan Department of Radiology, The Johns Hopkins University School of Medicine, Baltimore, MD, United States, 2F.M. Kirby Research Center for Functional, Brain Imaging, Kennedy Krieger Institute, Baltimore, MD, United States
Synopsis
We recently reported a method for the enhanced detection of glycogen using the nuclear Overhauser enhancement (NOE) between glycogen and water (glycoNOE). Here we show that the glycoNOE signal is linearly dependent on glycogen concentration both in vitro and in mouse liver in vivo. The glycoNOE signal is affected by glycogen particle size, but not pH or temperature. glycoNOE MRI can non-invasively quantify liver glycogen levels in vivo and thus has the potential to assess disease where glycogen metabolism is altered.
Introduction
Glycogen is the primary form of glucose storage in animals (Fig. 1). The level of glycogen is reported to be abnormal in diseases such as cancer 1,2, diabetes 3,4, glycogen storage diseases 5 and liver diseases 6. 13C MRS has been a popular method to quantify glycogen non-invasively in vivo for over four decades,7 yet its impact in the clinic has been limited due the low sensitivity and the need for specialized instrumentation. We recently reported a 1H based method for the enhanced detection of glycogen in vivo using the glycogen proton NOE with water (glycoNOE).8 However, the use of glycoNOE method to quantify glycogen in vivo still needs to be validated. Here, we characterized the glycoNOE signal as a function of concentration, particle size, pH and temperature in vitro. We also quantified glycogen in vivo in mouse liver and show that the glycoNOE signal can be used to map glycogen concentration in vivo.Materials and Methods
In vitro experiments on glycogen. Rabbit liver glycogen and bovine liver glycogen from Sigma (St. Louis, MO) were dissolved in phosphate-buffered saline (PBS). To construct samples with different particle sizes, rabbit liver glycogen were hydrolyzed (pH 3.0, 80 °C) for 0 to 25 days. The particle size was measured using dynamic light scattering (DLS) based Zetasizer (Zetasizer Nano ZS90, Malvern Instruments).In vivo liver glycoNOE MRI of mice. All experiments were performed with the approval of and in accordance with Johns Hopkins University Animal Care and Use Committee guidelines. All MRI experiments were performed on an 11.7 T (500 MHz) Bruker Biospec scanner (Bruker, Ettlingen, Germany). Healthy adult mice (N = 13) were scanned with glycoNOE MRI as described previously.8 All Z-spectra were acquired with a RF saturation power B1 = 1.0 µT.
Chemical assay of liver glycogen content. After glycoNOE MRI, liver tissues were immediately isolated from mice (N = 8). Glycogen was extracted from liver tissues7,9 and measured using a fluorometric Glycogen Assay Kit (Cayman Chemical #700480).
Data analysis. The B0 field inhomogeneities were corrected using WASSR 10. For each in vitro glycogen Z-spectrum, the negative half (-0.2 ppm to -5 ppm) was assumed to consist of two resonances, centered at 0 ppm (water peak) and around -1.0 ppm (glycoNOE), and was fitted to Lorentzian shapes 11 on a voxel-by-voxel basis. For each in vivo Z-spectrum, the negative range was assumed to consist of a constant magnetization transfer contrast (MTC) background plus four resonances, centered at 0 ppm (water peak), -1.0 ppm (glycoNOE), around -3.0 ppm (broad NOE component) and -3.9 ppm. The glycoNOE map was constructed based on the integral from -0.6 ppm to -1.5 ppm (10 data points) for each voxel.
Results
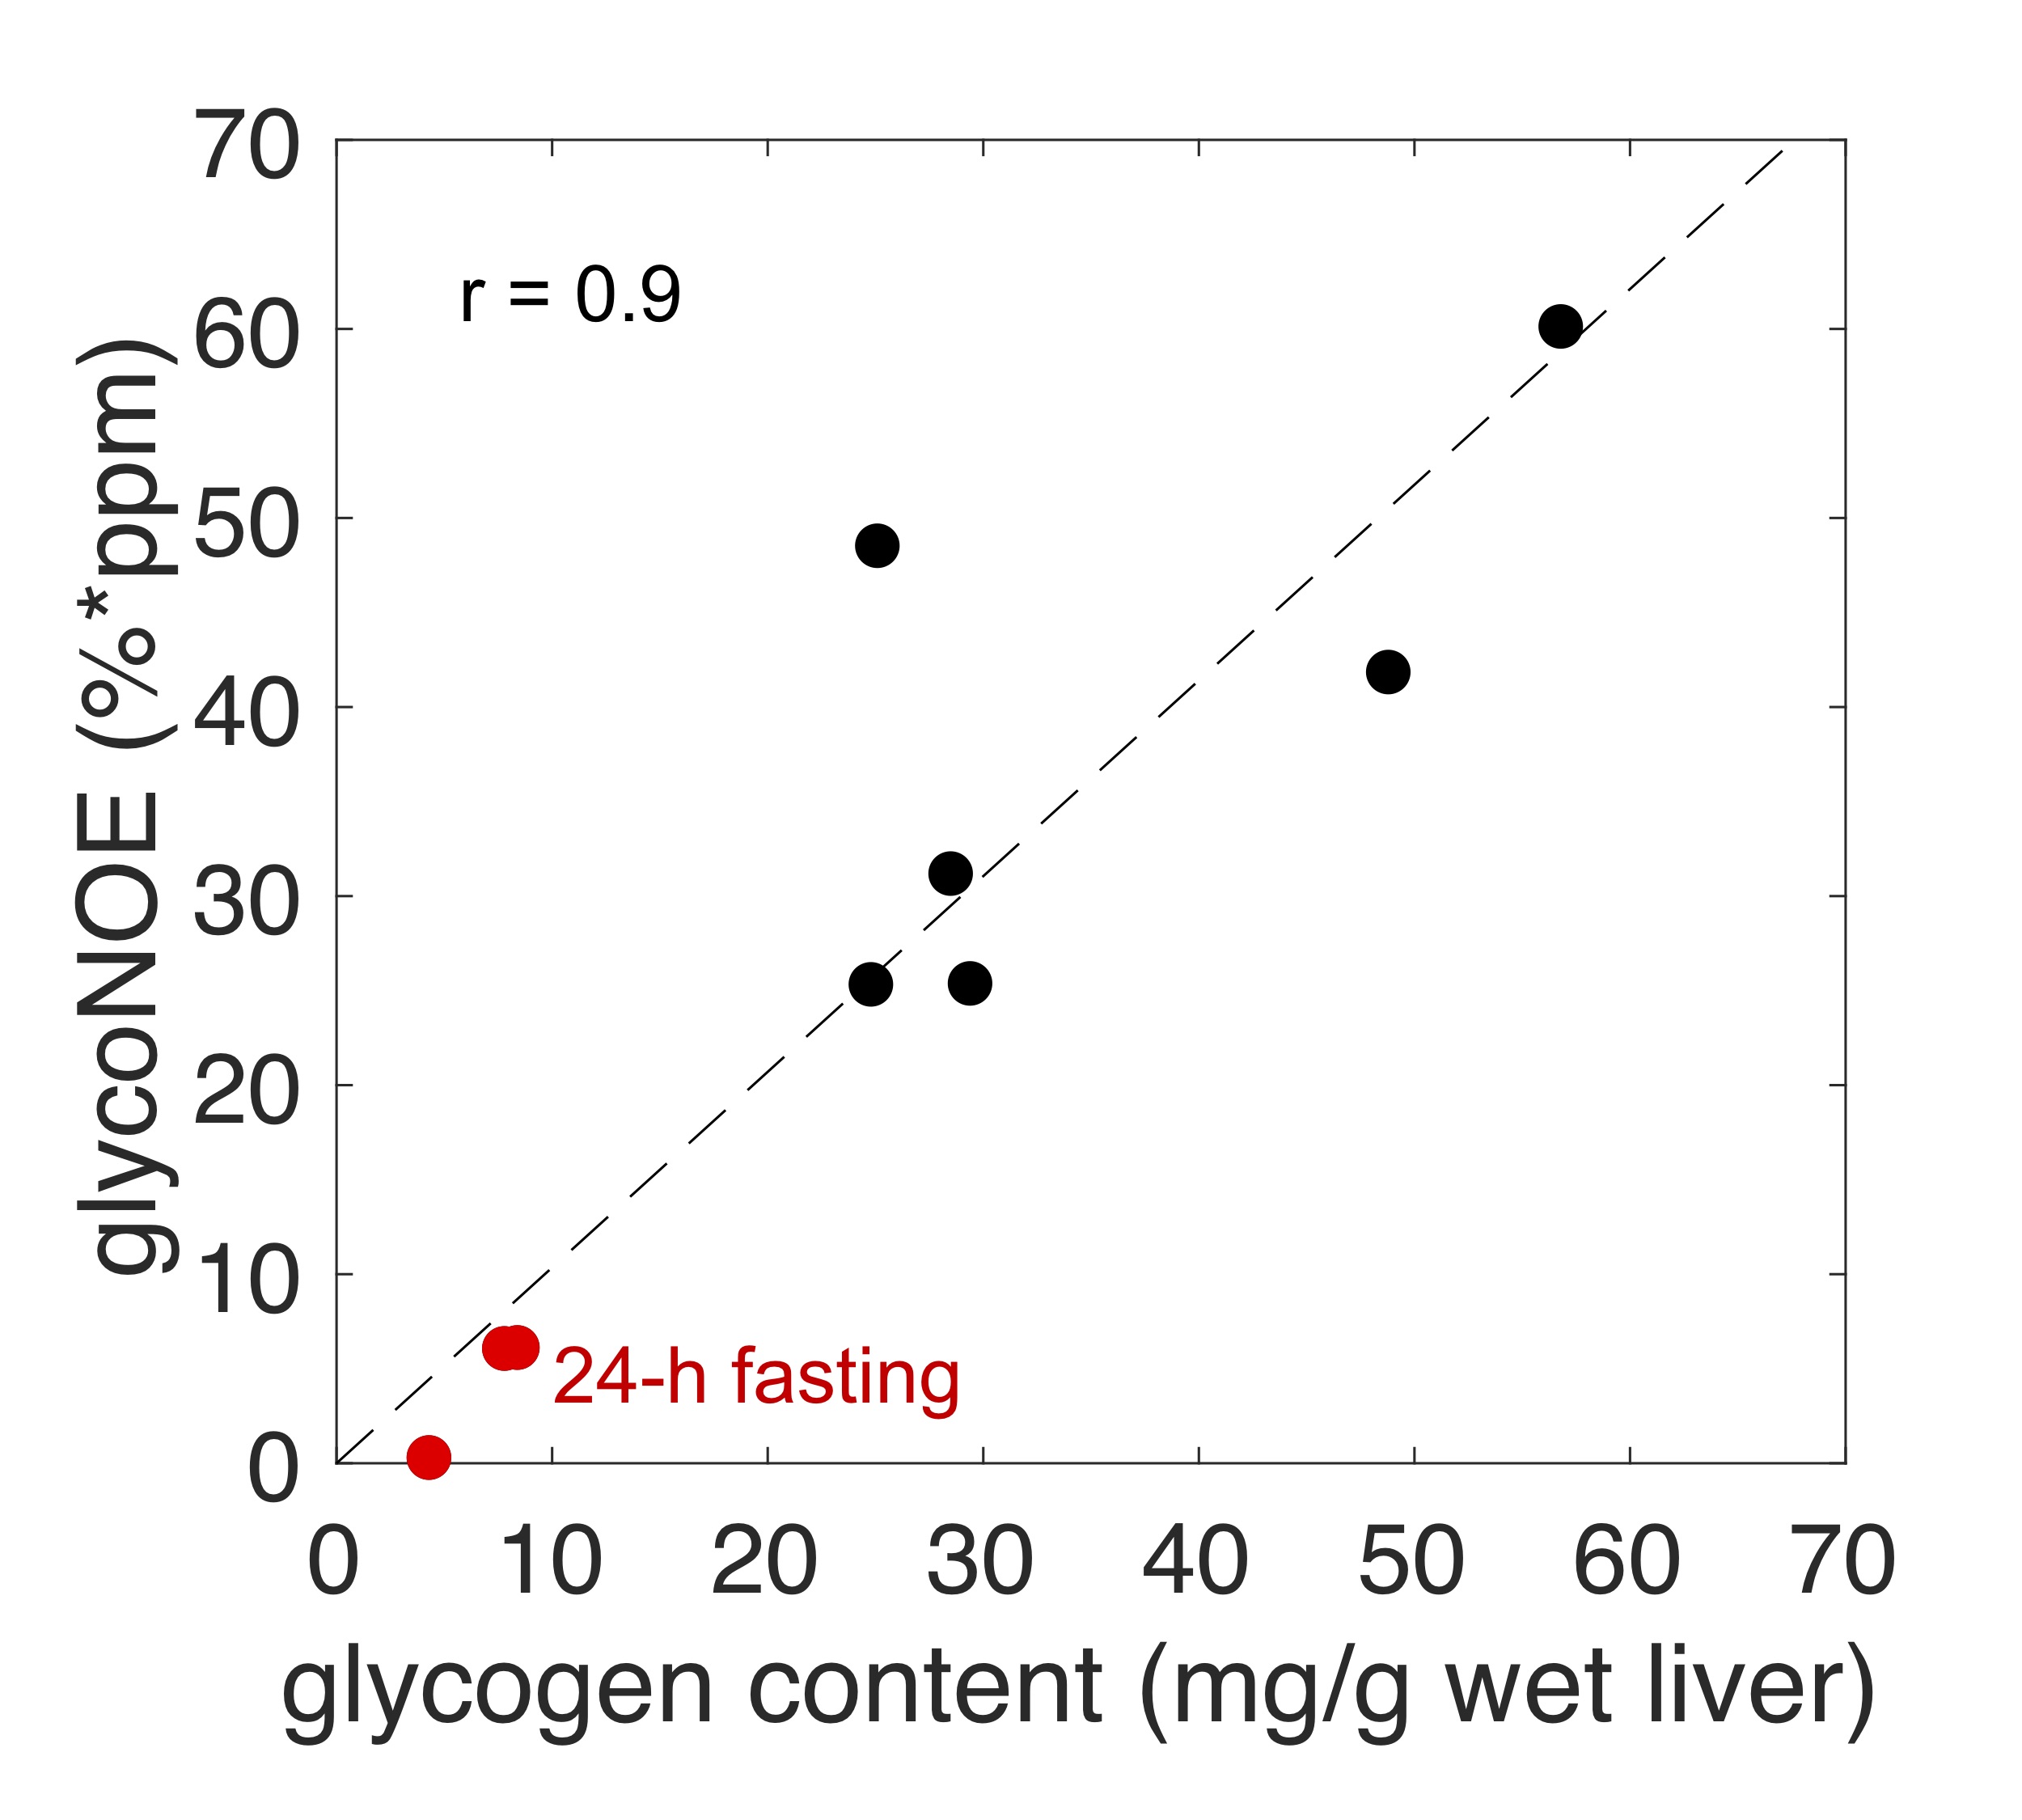
The glycoNOE signal at about -1 ppm in the Z-spectrum is enhanced by about two orders of magnitude relative to proton MRS (calculated from water percentage, Fig. 2C). The glycoNOE signal is linearly dependent on glycogen concentration and is affected by particle size but not by pH or temperature (Fig. 2). One unit (%*ppm, % times ppm range) of glycoNOE signal (under current experiment settings) is equivalent to about 1 mg glycogen per gram liver tissue. After fasting for 24-28 hours, the liver glycoNOE signal decreased on average from 49±8 %*ppm (equivalent to a glycogen concentration of about 47 mg/g wet liver) at fed state to 6±8 %*ppm (~6 mg/g) in the fasted state (N = 5, Fig. 3). The average glycoNOE signal in mouse liver in vivo is linearly correlated with measured liver glycogen concentration using a chemical assay method. (Fig. 4)Discussion
For a large proportion of glycogen in vivo (particle size above ~20 nm), glycoNOE signal is independent of particle size. The average glycogen particle size has been reported to fluctuate in small ranges in vivo,13 suggesting particle size may play a minor role in affecting glycoNOE signal. Since the signal is linearly correlated with glycogen concentration, it can be used to map glycogen concentration in vivo.Conclusion
We have validated that glycoNOE signal can be used to map liver glycogen levels in vivo. The glycoNOE method of quantifying glycogen with high spatial and temporal resolution has the potential to assess diseases where glycogen concentration is altered.Acknowledgements
No acknowledgement found.References
1 Rousset, M., Zweibaum, A. & Fogh, J. Presence of glycogen and growth-related variations in 58 cultured human tumor cell lines of various tissue origins. Cancer research 41, 1165-1170 (1981).
2 Favaro, E. et al. Glucose utilization via glycogen phosphorylase sustains proliferation and prevents premature senescence in cancer cells. Cell metabolism 16, 751-764 (2012).
3 Magnusson, I., Rothman, D., Katz, L., Shulman, R. & Shulman, G. Increased rate of gluconeogenesis in type II diabetes mellitus. A 13C nuclear magnetic resonance study. The Journal of clinical investigation 90, 1323-1327 (1992).
4 Krssak, M. et al. Alterations in postprandial hepatic glycogen metabolism in type 2 diabetes. Diabetes 53, 3048-3056 (2004).
5 Adeva-Andany, M. M., González-Lucán, M., Donapetry-García, C., Fernández-Fernández, C. & Ameneiros-Rodríguez, E. Glycogen metabolism in humans. BBA clinical 5, 85-100 (2016).
6 Krähenbühl, L. et al. Reduced hepatic glycogen stores in patients with liver cirrhosis. Liver international 23, 101-109 (2003).
7 Sillerud, L. O. & Shulman, R. G. Structure and metabolism of mammalian liver glycogen monitored by carbon-13 nuclear magnetic resonance. Biochemistry 22, 1087-1094 (1983).
8 Zhou, Y. et al. in Proc. Intl. Soc. Mag. Reson. Med. 27 (2019). 0546.
9 Shokri-Afra, H., Ostovar-Ravari, A. & Rasouli, M. Improvement of the classical assay method for liver glycogen fractions: ASG is the main and metabolic active fraction. European Review for Medical and Pharmacological Sciences 20, 4328-4336 (2016).
10 Kim, M., Gillen, J., Landman, B. A., Zhou, J. & Van Zijl, P. C. Water saturation shift referencing (WASSR) for chemical exchange saturation transfer (CEST) experiments. Magnetic Resonance in Medicine 61, 1441-1450 (2009).
11 Desmond, K. L., Moosvi, F. & Stanisz, G. J. Mapping of amide, amine, and aliphatic peaks in the CEST spectra of murine xenografts at 7 T. Magnetic resonance in medicine 71, 1841-1853 (2014).
12 Zang, L.-H., Howseman, A. M. & Shulman, R. G. Assignment of the 1H chemical shifts of glycogen. Carbohydrate research 220, 1-9 (1991).
13 Sullivan, M. A. et al. Changes in glycogen structure over feeding cycle sheds new light on blood-glucose control. Biomacromolecules 15, 660-665 (2014).
Figures