0315
Assessment of obesity-induced metabolic disorders in adipose tissue by multi-parametric MR Elastography (MRE)1Radiology, Mayo Clinic, Rochester, MN, United States, 2Gastroenterology, Mayo Clinic, Rochester, MN, United States, 3Mayo Clinic, Rochester, MN, United States
Synopsis
We performed multiparametric 3D MR Elastography (MRE) in 37 obese patients who underwent bariatric surgeries. MRI/MRE, anthropometrics, and liver biopsy were obtained within three months of bariatric surgery and one year later. 12/37 (32%) patients have biopsy-proven non-alcoholic fatty liver disease (NAFLD) at the time of surgery. The MRE-assessed shear stiffness (SS) and loss modulus (LM) of subcutaneous adipose tissue decreased significantly after the surgery, as well as the liver tissue. MRE-assessed SS and LM have potential in distinguishing the obesity-induced metabolic disorder in the adipose tissues. The mechanical change may correlate with the therapeutic response in these obese patients.
Introduction
Obesity has become one of the most serious public health problems with increasing prevalence. It often causes lots of medical disorders, including diabetes, nonalcoholic fatty liver disease (NAFLD), and nonalcoholic steatohepatitis (NASH)(1). It is well-accepted that obesity promotes a state of chronic low-grade systemic inflammation, which is reflected not only by increased production of cytokines and proinflammatory adipokines by adipose tissue, but also by a cellular component(2). Recently, a group found that the adipose tissue in obese rats is stiffer than normal rats by optical assessment(3). Magnetic Resonance Elastography (MRE) assessed shear stiffness (SS) is a well-established quantitative biomarker for fibrosis (4). Loss modulus (LM), as another mechanical parameter derived from MRE, has been demonstrated to have potentials in distinguishing inflammation(5). We aim to use multi-parametric MRE-derived SS and LM to assess the obesity-induced metabolic disorders in subcutaneous adipose tissue in obese patients, with an assessment of the liver simultaneously.Methods
All activities related to human subjects were reviewed and approved by our institutional review board. We enrolled 37 obese patients (BMI≥30 kg/m2), who underwent bariatric surgery and intraoperative hepatic biopsies within three months of MRI/MRE exams(6). We performed multi-parametric 3D MRE at 30Hz and multi-echo Dixon MRI. One year after the surgery, all patients had a follow-up MRI/MRE and a percutaneous liver biopsy. All subjects were imaged on 1.5T whole‐body scanners (GE Healthcare, Milwaukee, WI). We calculated the SS and LM of subcutaneous adipose tissue and liver from manually drawn ROIs in MRE. The ROIs of subcutaneous adipose tissue were drawn mainly on the right side and left anterior part of the abdominal wall with sufficient fat magnitude and wave signal, avoiding the back and areas beneath the actuator to avoid pre-loaded pressure from body weight or driver. The proton density fat fraction (PDFF) was obtained from 8 ROIs drown in each hepatic segments and weighted by the area of ROIs. Nonparametric Wilcoxon tests were used to compare the mean values of BMI and all MRI/MRE parameters at baseline and 1-year after surgery. Spearman’s correlations were used to analyze the relationships between stiffness measurements of subcutaneous adipose tissue and other parameters. For all statistical analyses, a significance level of 0.05 was used.Results
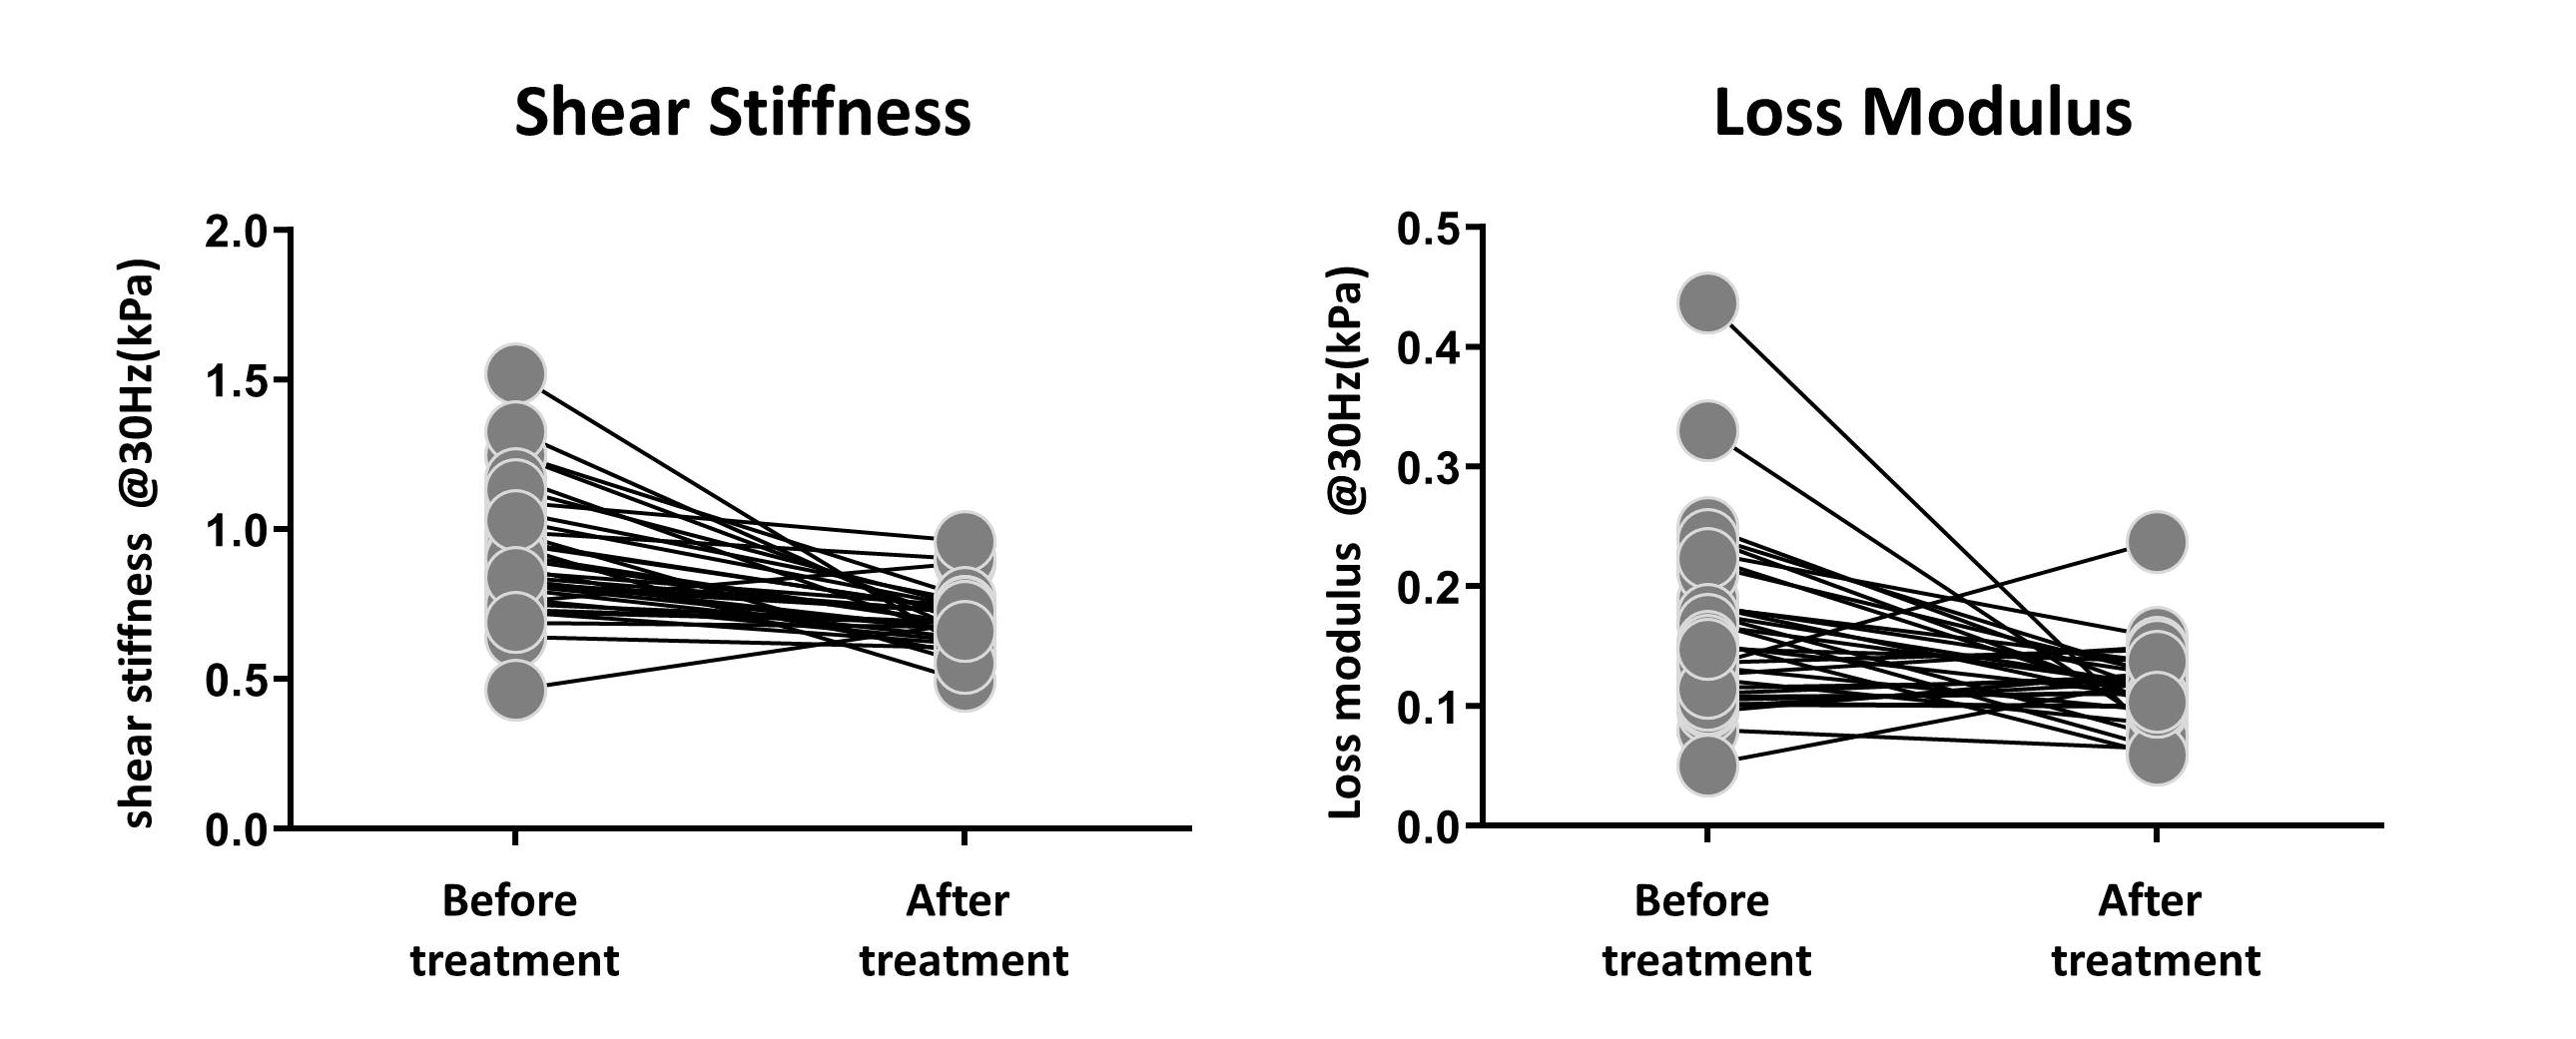
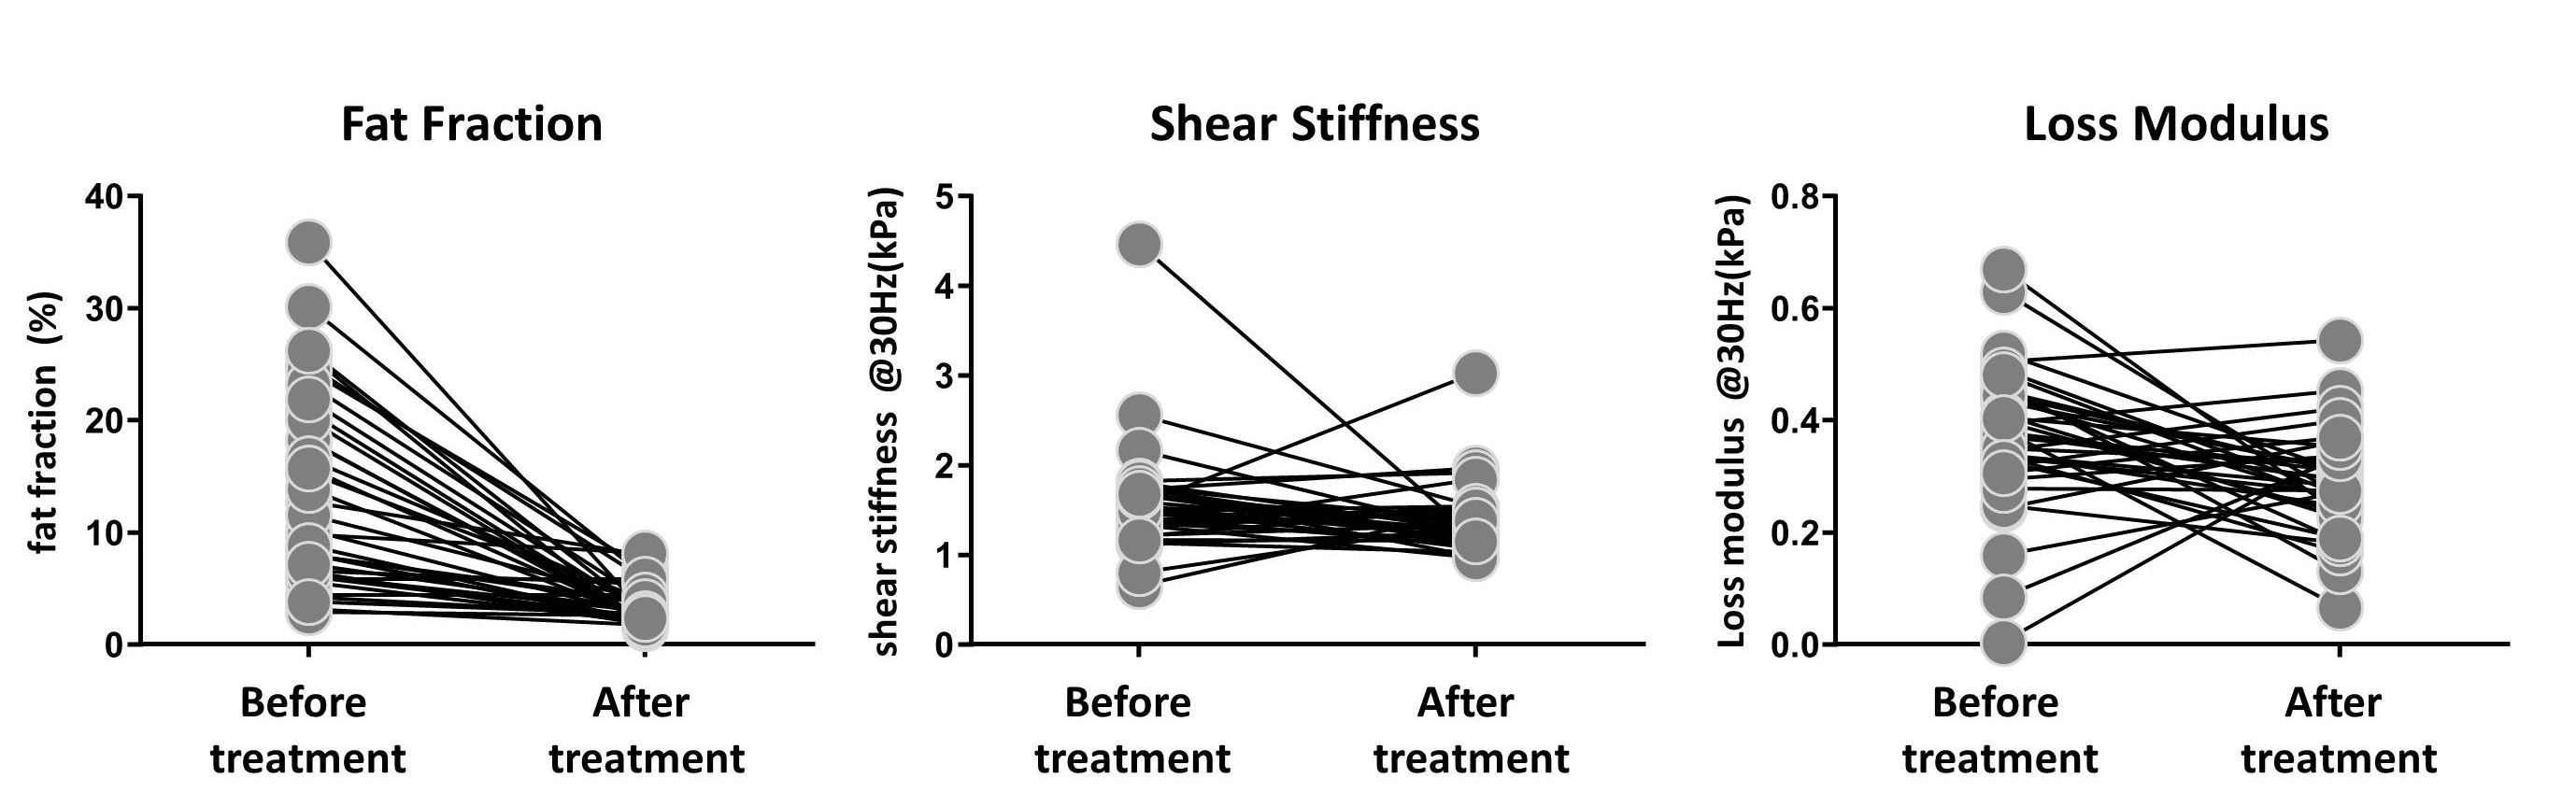
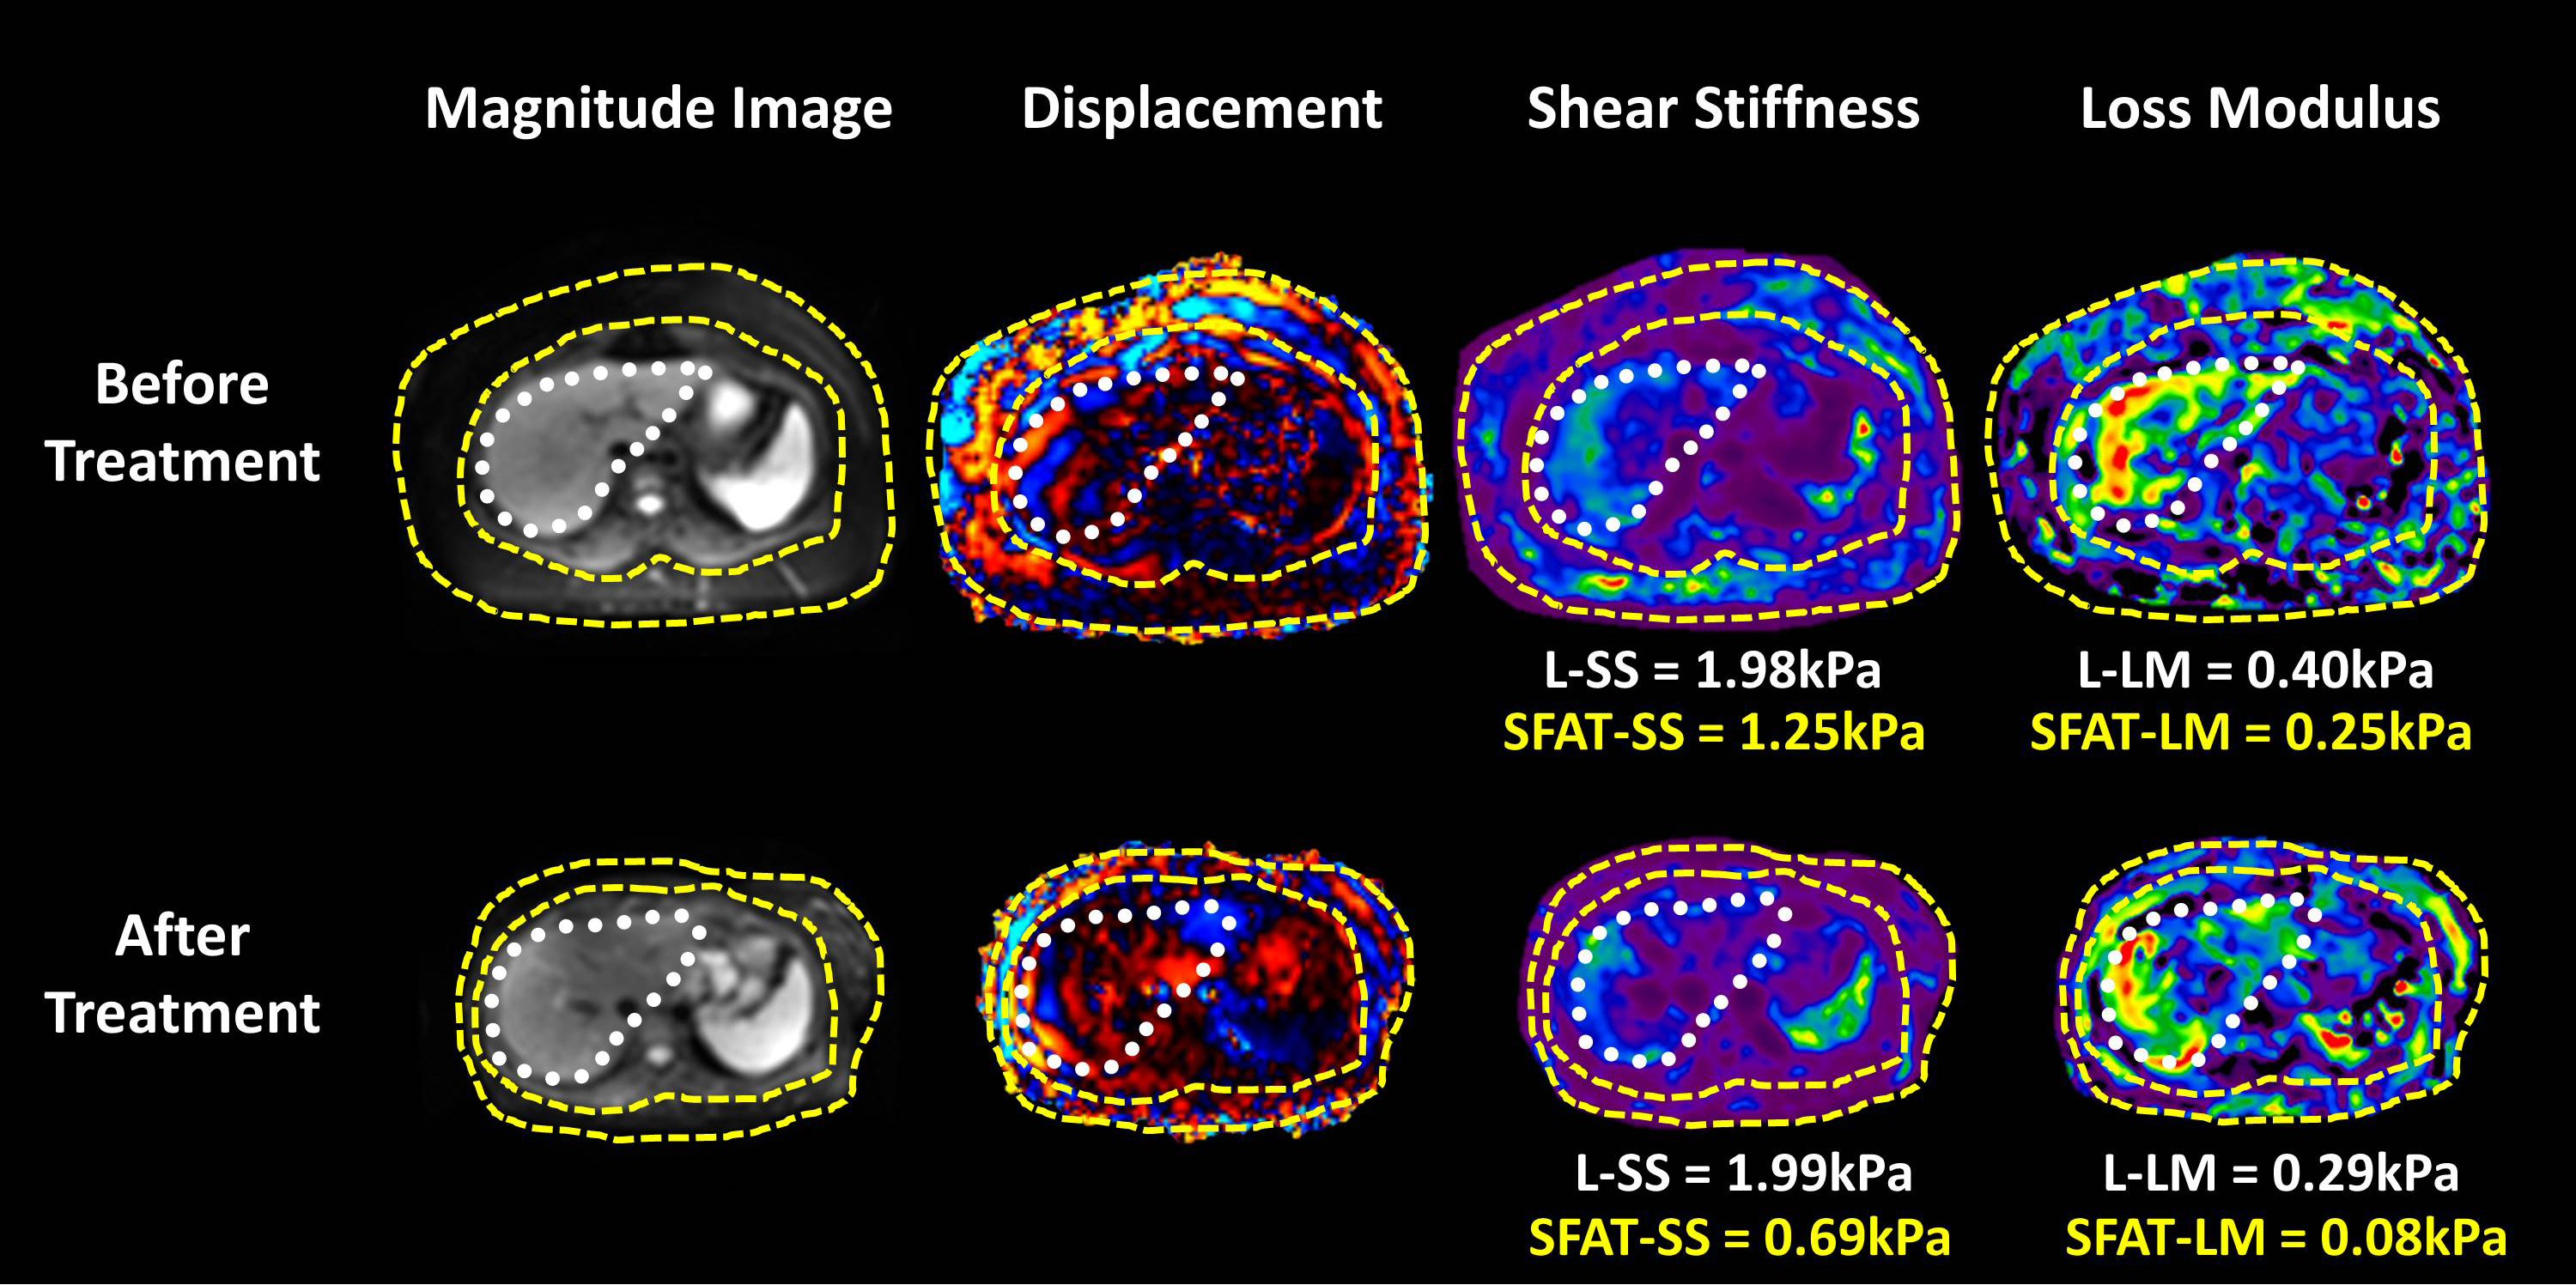
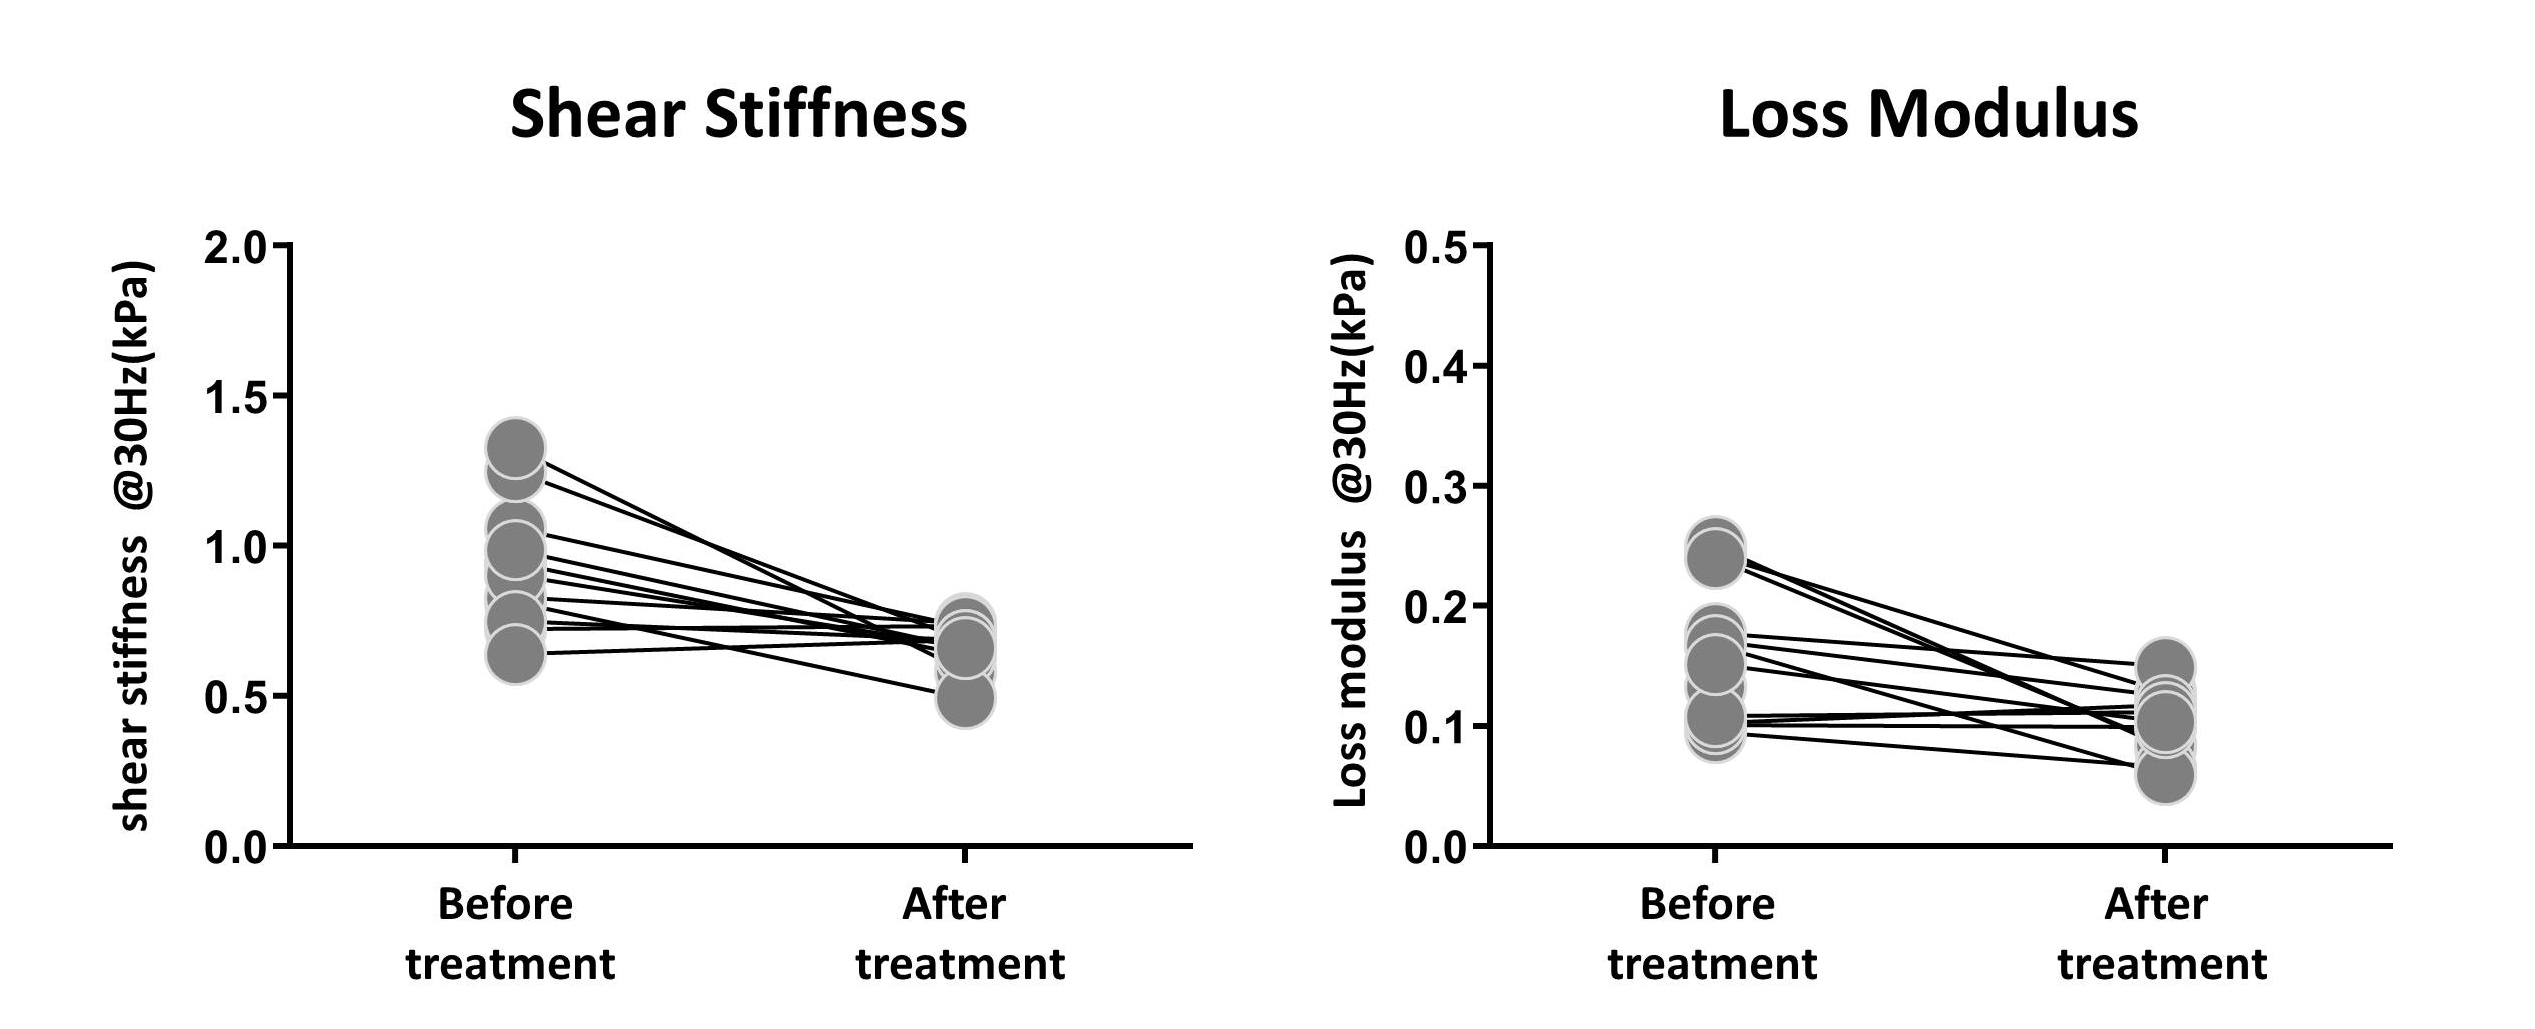
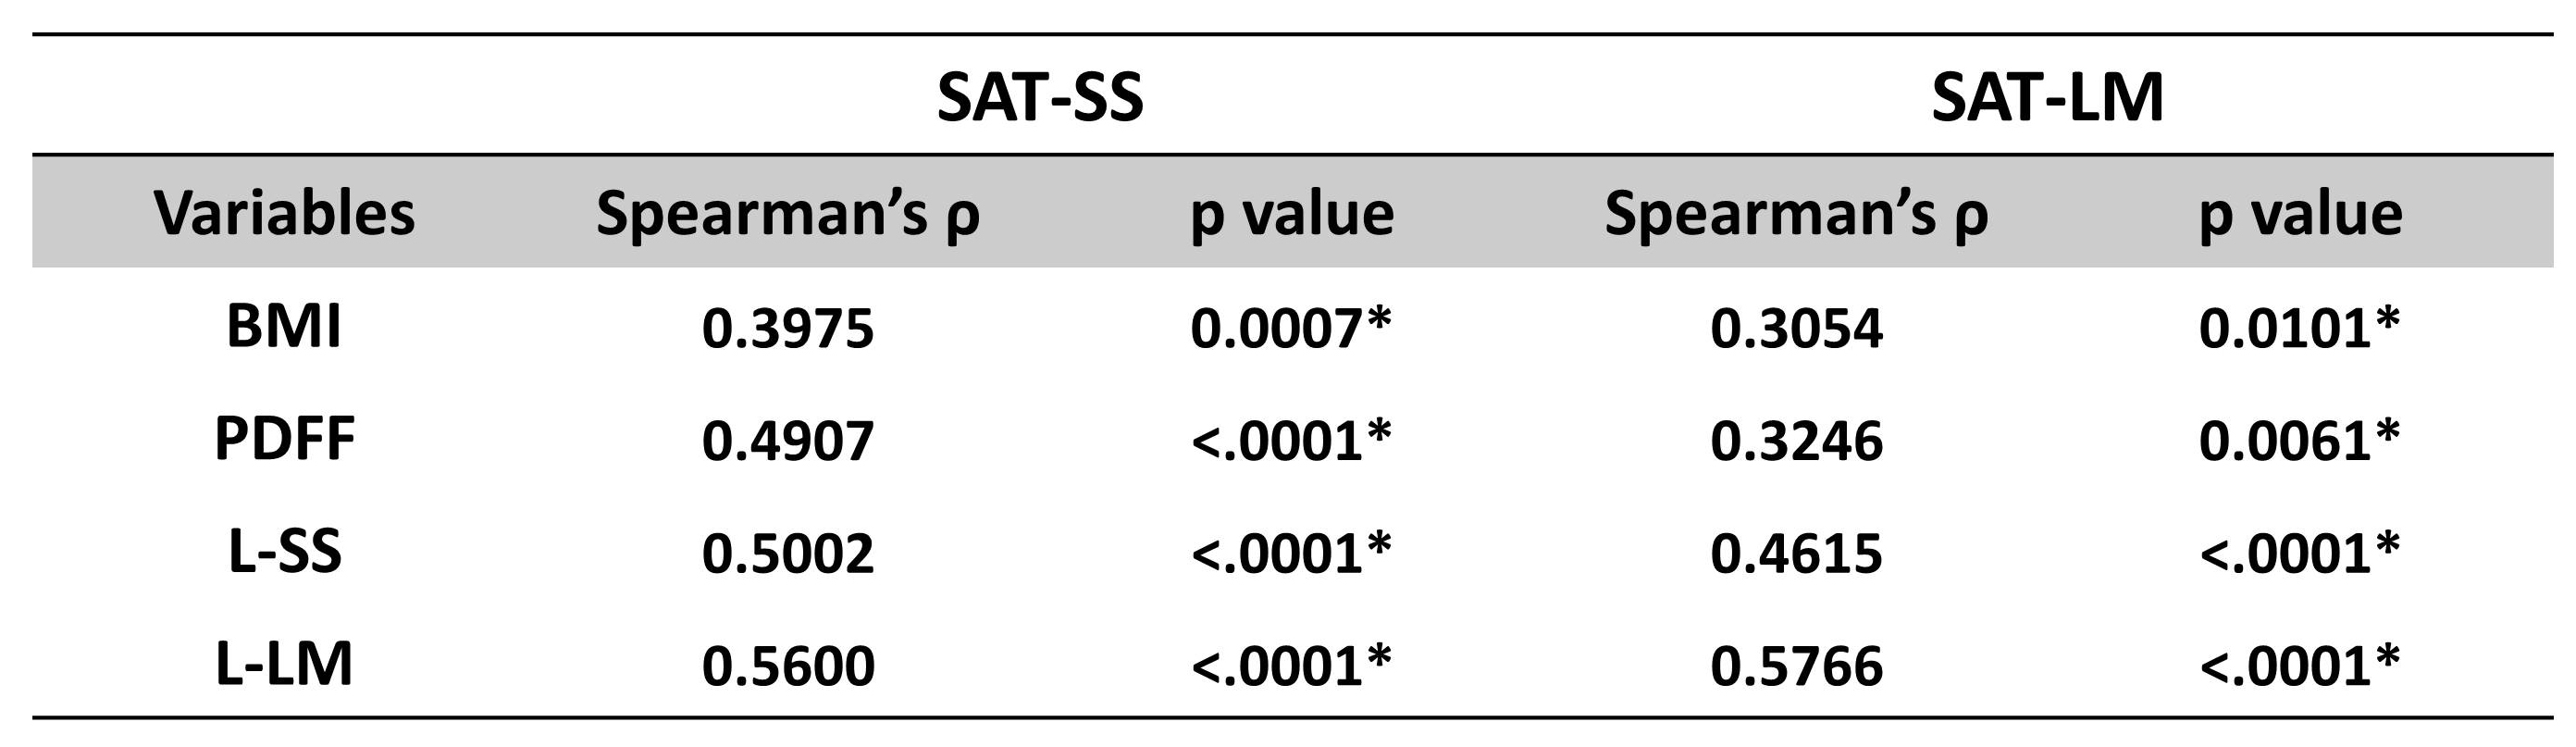
After the surgery, the mean value of BMI decreased significantly (47.38 ± 8.66 kg/m2 vs. 33.03 ± 5.28 kg/m2). The SS and LM of subcutaneous adipose tissue (SAT-SS, SAT-LM) showed significant decrease after surgery (SAT-SS: 0.92 ± 0.21 kPa vs. 0.70 ± 0.09 kPa, p < 0.01; SAT-LM: 0.17 ± 0.07 kPa vs. 0.11 ± 0.01 kPa, p<0.01) (Figure 1). The SS and LM of liver (L-SS: 1.58 ± 0.59 kPa vs. 1.37 ± 0.36 kPa, p < 0.01; L-LM: 0.37 ± 0.13 kPa vs. 0.29 ± 0.09 kPa, p<0.01), and hepatic PDFF decreased significantly (13.41 ± 8.68% vs. 3.41 ± 1.76%, p<0.01) (Figure 2). Figure 3 shows example MRI anatomical images, MRE wave images (shear displacement), and elastograms of a non-NAFLD obese patient before and after the surgery. In a subgroup of 12 obese patients with baseline biopsy results that were negative for steatosis, ballooning, and fibrosis (Non-NAFLD), we found that the SS and LM of subcutaneous adipose tissue and liver also decreased significantly after the surgery and showed no significant difference between patients with or without histological inflammation (Figure 4). Spearman’s correlation analysis demonstrates that both SAT-SS and SAT-LM have significant correlations with BMI, PDFF, L-SS and L-LM (Table 1).Discussion
Obesity arouses serious metabolic disorders in adipose tissue, including adipocyte hypertrophy, hypoxia and stress(2). Mechanically, SS is more sensitive to matrix deposition and structural changes, like hypertrophy, and fibrosis. In obese patients, the adipose hypertrophy and the overrepresented macrophages induced by inflammation may cause the elevation in SS. As LM is more sensitive to the precursory interstitial fluid changes that are parts of the inflammation process. After treatment, the production of cytokines and proinflammatory adipokines in adipose tissue may decrease, which leads to a decrease of LM. Adipose tissue is a very soft semi-liquid material at body temperature. Given the limited spatial resolution in a general liver MRE setup, we expect that mechanical response and its calculation are more prominent and reliable at a lower frequency (30Hz) rather than a higher frequency (60Hz). As an ongoing study, we will analyze the changes of cytokines in adipose tissue and measure the fat fraction of subcutaneous adipose tissue.Conclusion
Our preliminary results demonstrated that the SS and LM of subcutaneous adipose tissue decreased significantly after the surgery, as well as the liver. The results indicate that MRE-assessed SS and LM have potential in differentiating the obesity-induced metabolic disorder in adipose tissue, and may correlate with the therapeutic response in obese patients. Multi-parametric MRE may provide a promising diagnostic tool for detecting and monitoring systemic metabolic disorders in both adipose tissue and liver in obese patients.Acknowledgements
This study is funded by the National Institute of Diabetes and Digestive and Kidney Diseases (K23DK115594), Mayo Clinic Center for Cell Signaling in Gastroenterology (NIDDK P30DK084567), American College of Gastroenterology 2017 Junior Faculty Development Grant, Mayo Clinic Transform the Practice Grant, NIH grants EB017197 and EB001981, Mayo Clinic Center for Individualized Medicine Imaging Biomarker Discovery Program.References
1. Sun B, Karin M. Obesity, inflammation, and liver cancer. J Hepatol 2012;56(3):704-713. doi: 10.1016/j.jhep.2011.09.020
2. M.M.J. van Greevenbroek* CGS, C.D.A. Stehouwer. obesity-associated low-grade inflammation in type 2 diabetes mellitus: causes and consequences. Neth J Med 2013;71(4):174-187.
3. Troyanova-Wood M, Gobbell C, Meng Z, Gashev AA, Yakovlev VV. Optical assessment of changes in mechanical and chemical properties of adipose tissue in diet-induced obese rats. Journal of biophotonics 2017;10(12):1694-1702. doi: 10.1002/jbio.201600281
4. Yin M, Talwalkar JA, Glaser KJ, Manduca A, Grimm RC, Rossman PJ, Fidler JL, Ehman RL. Assessment of hepatic fibrosis with magnetic resonance elastography. Clinical gastroenterology and hepatology : the official clinical practice journal of the American Gastroenterological Association 2007;5(10):1207-1213.e1202. doi: 10.1016/j.cgh.2007.06.012
5. Li J. Detection of Early Hepatic Inflammation in Obese Patients with MR Elastography (MRE). ISMRM abstract 2019.
6. Allen AM, Shah VH, Therneau TM, Venkatesh SK, Mounajjed T, Larson JJ, Mara KC, Schulte PJ, Kellogg TA, Kendrick ML, McKenzie TJ, Greiner SM, Li J, Glaser KJ, Wells ML, Chen J, Ehman RL, Yin M. The Role of Three-Dimensional Magnetic Resonance Elastography in the Diagnosis of Nonalcoholic Steatohepatitis in Obese Patients Undergoing Bariatric Surgery. Hepatology (Baltimore, Md) 2018. doi: 10.1002/hep.30483
Figures