0312
Rapid multi-slice fat and water separated T1 and composite R2* mapping using a dual-echo radial inversion recovery SPGR pulse sequence1Department of Radiology, Stanford University, Stanford, CA, United States, 2Electrical Engineering, Stanford University, Stanford, CA, United States
Synopsis
A radial dual-echo IR-SPGR technique combined with a principal component based iterative reconstruction algorithm are demonstrated for fat and water separated rapid high-resolution abdominal multi-parameter mapping. This method can yield high-quality fat-signal-fraction map, B0 field map, composite T1 map, water component T1 map as well as a R2* map from a scan as fast as 3seconds/slice. The in-plane resolution of the resulting parameter maps is 1.25mm and the through-plane resolution is 5.00mm. With a selective inversion pulse, multiple slices can be acquired within a breath-hold.
Introduction
Quantitative measurements of MR physical parameters are becoming more desirable in clinical practice. It has been shown that T1 maps are valuable for various abdominal diseases such as cirrhosis [1], tumors [2] and kidney dysfunction [3]. However, accumulation of fat and iron in the abdomen can bias the measured T1 values. To avoid the bias introduced by fat, it is desirable, particularly for hepatic indications, to measure the T1 values of only the water component. Further, to account for the bias introduced by iron, it is also desirable to quantify R2* simultaneously to estimate iron concentration.Breath-holding puts a severe limitation on the spatiotemporal resolution for conventional parameter mapping techniques [4-7].
Here we present a radial dual-echo inversion-recovery (IR) Spoiled Gradient-Echo (SPGR) technique for high-resolution multi-parameter mapping. This method is demonstrated for breath-hold imaging studies that produced B0, fat-signal-fraction, composite T1, water T1, and R2* maps. Data can be acquired around 3 seconds/slice.
Technique and methods
In the proposed technique, data acquisition is initiated by a 180° adiabatic slice-selective inversion pulse, followed by a train of fixed flip-angle dual-echo radial views that are acquired in a single-shot. Tiny golden angle [8] view-ordering was used to avoid eddy current artifacts (Figure 1(a)). For fat-signal-fraction estimation, composite images of the two echoes were used. For subsequent parameter estimations, data is partitioned into TI-groups (N=16 views/group, ~4% Nyquist); the TI for each TI-group is approximated by the average TI of the views in the group (Figure 1(b)).This dual-echo radial IR-SPGR sequence was implemented on GE 3T MR750 scanner using an EPIC wrapper from Karolinska Foundation [9]. For a breath-hold acquisition, the following parameters were used: TE1=1.88ms, TE2=3.35ms, TR=5.8ms, TI=35ms, FA=10°, base resolution=256, FOV=320mm, radial views=512, bandwidth=976.6Hz/pixel.
A four-step reconstruction (Figure 1(c)) was used to recover multi-parameter maps. First, composite echo-images were reconstructed using a naïve non-uniform FFT [10]. B0 and fat-signal-fraction maps were then estimated from these two echo-images [11].
Secondly, a principal-component (PC) based algorithm was used for the reconstruction of TI-images [12]. Two TI-image series were reconstructed from the dual-echo data, but only the first echo was used to estimate the composite T1 maps due to SNR considerations. The algorithm was able to recover 3 PC images to reconstruct a series of 32 TI-images, which were then fitted to the T1 model in Eq.(1) [13].
Thirdly, the fat-signal-fraction map from step-1 and the composite T1 map from step-2 were used as the initial condition for the non-linear fitting of the fat/water separated T1 model described in Eq.(2) to recover water T1 map. $$$T_{1f}^{*}$$$in the equation is treated as known and is estimated using the composite T1 values with corresponding fat-signal-fraction values > 95%.
Lastly, the R2* map was estimated using the last 10 dual-echo TI-images in order to avoid the low signal intensity around the zero-crossing due to the inversion-recovery. Before fitting for R2*, the T1 recovery effect between the dual-echo TI-images was corrected using the estimated composite T1 maps. The corrected data was then fitted to Eq.(3). A clinically available R2* mapping sequence IDEAL was used as a reference for R2* accuracy analysis.
A NIST phantom [14] was used to verify the accuracy of the T1 mapping technique using an IR-Spin-Echo (IR-SE) method as a reference. With IRB approval, a subject with hepatic steatosis was imaged using the proposed technique with informed consent.
Reconstruction algorithms were implemented on dual NVIDIA GTX-1080 GPUs using C++ with OpenCL, and supporting routines in python and MATLAB.
Results and discussion
In Table 1 from Figure 4(a), the T1 measured by IR-SE and the proposed technique on the NIST phantom are shown. Percentage error along with a Bland-Altman plot is also presented. It can be seen that the proposed method matches the reference very well.In Figure 2 the first row shows the 2 composite echo-images and B0 map, the second row shows the fat/water separated images and the fat-signal-fraction map. The third row of the image shows a comparison between the R2* maps from the IDEAL reference and the proposed technique. Note on the R2* ROI analysis, the proposed technique produced R2* values matching the reference, but with much better image quality and resolution.
In Figure 3, representative slices of the composite T1, water T1 and the R2* maps are shown. Multi-slice data acquisition took a 15-second breath-hold. The spatial resolution of the maps is 1.25mm×1.25mm×5.00mm. Note the sharp details presented in the parameter maps. The high spatial resolution in the T1 maps, allows the kidney’s cortex and medulla to be conspicuously delineated. As for the liver and spleen parenchyma, few artifacts are present and values are generally uniform.
In Figure 4(b), ROI analysis of the composite and water T1 maps are shown. With fat signals excluded, the water T1 maps show higher estimates in the liver and pancreas. Other organs with little fat, such as spleen, the estimates are unchanged.
Conclusion
A fast multi-slice dual-echo IR-SPGR technique is proposed for high-resolution abdominal multi-parameter mapping. B0, fat-signal-fraction, composite T1, water component T1 and R2* maps can be acquired around 3seconds/slice. The proposed method is efficient in data acquisition and can provide high-quality estimations of multiple parameters.Acknowledgements
The authors would like to thank NIH R01 EB009690, NIH R01 EB026136, GE HealthcareReferences
[1] Kim KA, Park MS, Kim IS, Kim IS, et al. Quantitative evaluation of liver cirrhosis using T1 relaxation time with 3 Tesla MRI before and after oxygen inhalation. JMR. 2012;36:405-410.
[2] Goldberg MA, Hahn PF, Saini S, Cohen MS, Reimer P, Brady TJ, Mueller PR. Value of T1 and T2 relaxation times from echoplanar MR imaging in the characterization of focal hepatic lesions. AJR Am J Roentgenol. 1993;160(5):1011-1017.
[3] Huang Y, Sadowski EA, Artz NS, et al. Measurement and comparison of T1 relaxation times in native and transplanted kidney cortex and medulla. J Magn Reson Imaging. 2011;33:1241-1247.
[4] Messroghli DR, Radjenovic A, Kozerke S, Higgins DM, Sivananthan MU, Ridgway JP. Modified Look-Locker inversion recovery (MOLLI) for high-resolution T1 mapping of the heart. Magn Reson Med. 2004;52:141-146.
[5] Ma D, Gulani V, Seiberlich N, Liu K, Sunshine JL, Duerk JL, Griswold MA. Magnetic resonance fingerprinting. Nature. 2013;495:187-192.
[6] Chen Y, Jiang Y, Pahwa S, Ma D, Lu L, Twieg MD, Wright KL, Seiberlich N, Griswold MA, Gulani V. MR fingerprinting for rapid quantitative abdominal imaging. Radiology. 2016;279(1):278-286.
[7] Wang X, Roeloffs V, Klosowski J, Tan Z, Voit D, Uecker M, Frahm J. Model-based T1 mapping with sparsity constraints using single-shot inversion-recovery radial FLASH. Magn Reson Med. 2017;00:00-00.
[8] Wundrak S, Paul J, Ulrici J, et al. Golden ratio sparse MRI using tiny golden angles. Magn Reson Med 2016;75:2372–2378.
[9] http://ksfoundationepic.org/
[10] Fessler JA, Sutton BP. Nonuniform fast Fourier transforms using min-max interpolation. IEEE Transactions on Signal Processing. 2003;51(2):560-574.
[11] Berglund J, Ahlström H, Johansson L, Kullberg J, Two-point dixom method with flexible echo times, Magn Reson Med. 2011;65:994-1004.
[12] Li Z, Bilgin A, Johnson K, Galons JP, Vedantham S, Martin DR, Altbach MI, Rapid high-resolution T1 mapping using a highly accelerated radial steady-state free-precession technique, J Magn Reson Imaging 2019;49:239-252.
[13] Barral JK, Gudmundson R, Stikov N, Etezadi-Amoli M, Stoica P, Nishimura DG. A robust methodology for in vivo T1 mapping. Magn Reson Med. 2010;64:1057-1067.
[14] Russek SE, Boss M, Jackson EF, et al. Characterization of NIST/ISMRM MRI System Phantom. In: Proceedings of the 20th Annual Meeting of ISMRM, Melbourne Australia, 2012. (abstract 2456).
Figures
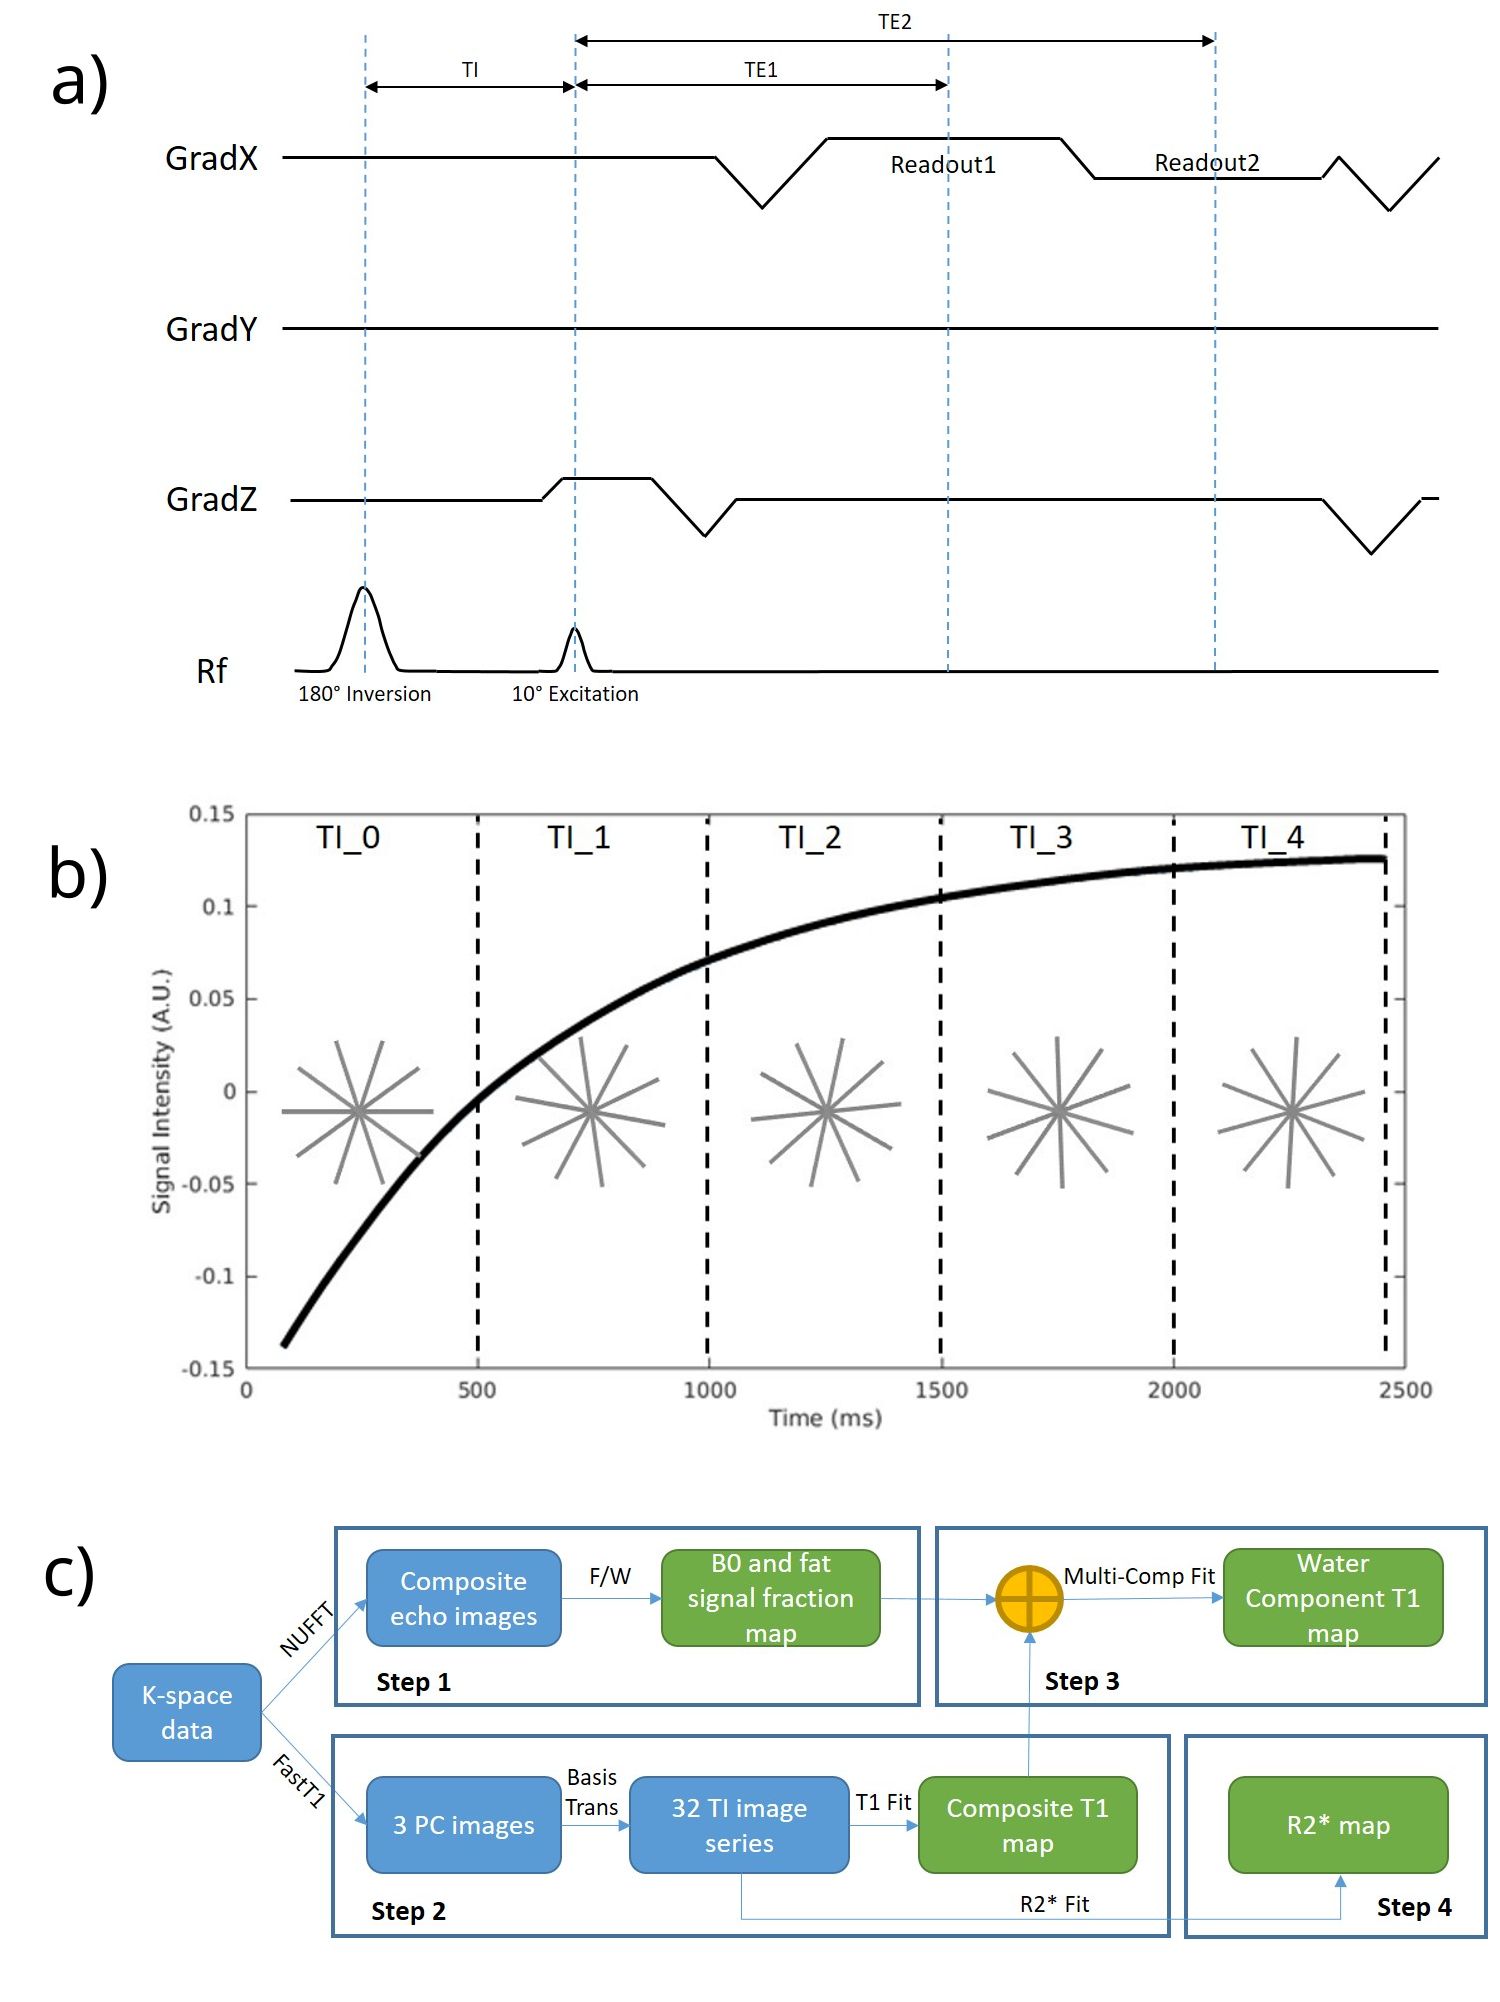
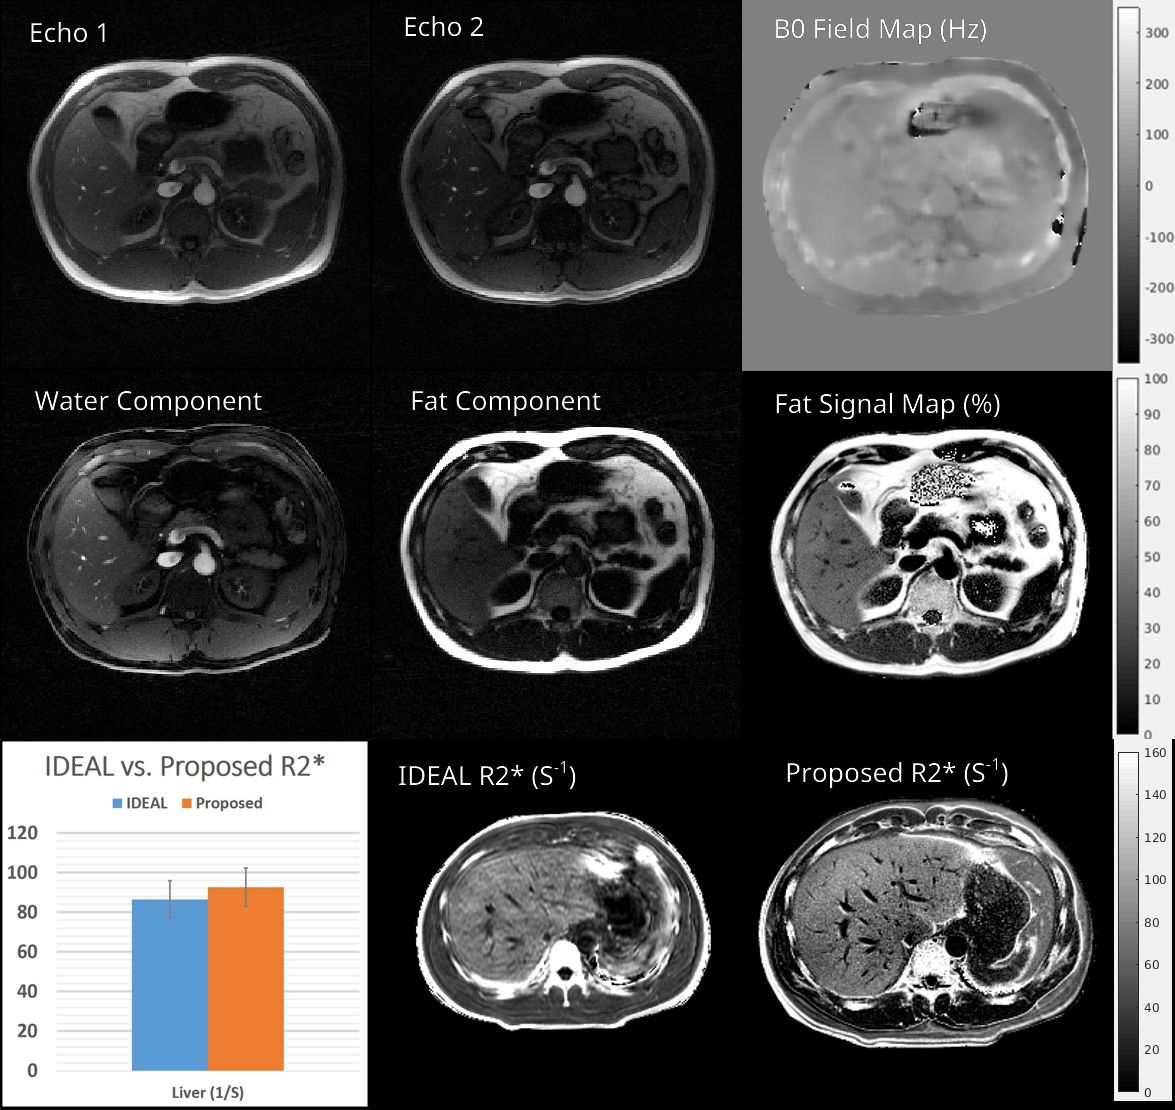
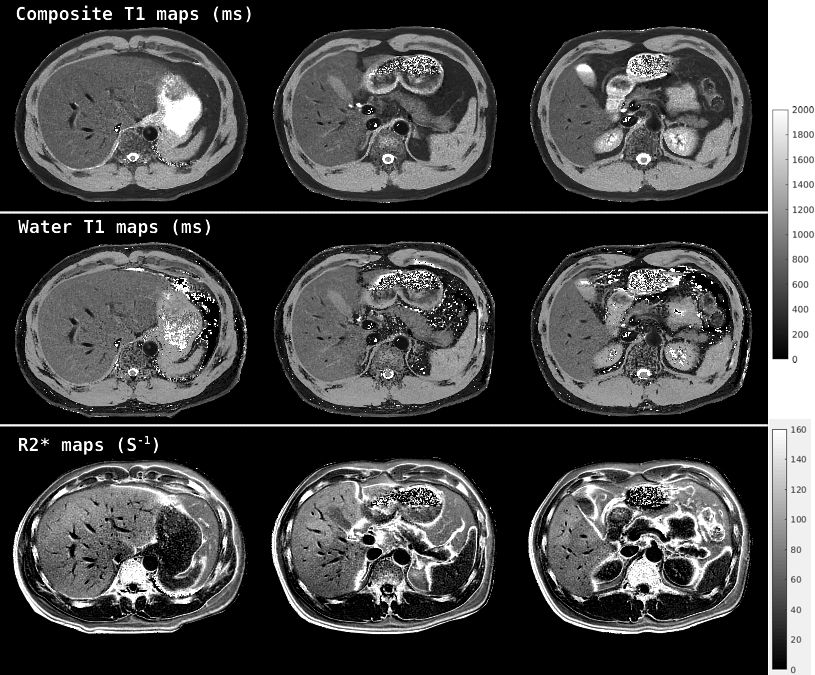

Figure 4. a) Table 1 shows the comparison between T1 estimates from a NIST phantom measured using the IR-Spin-echo and the proposed technique. Data are also presented in the Bland-Altman plot to show the consistency in the T1 estimates. b) Fat and water separated T1 values are compared with the composite T1 values. As can be seen, water component T1 maps show a higher estimation than the composite T1 maps for liver and pancreas, while remaining similar for spleen, muscle and kidney.
