0311
The thirsty liver: dynamic T1 mapping after fluid intake in healthy volunteers1OCMR, RDM Cardiovascular Medicine, University of Oxford, Oxford, United Kingdom, 2Translational Gastroenterology Unit, University of Oxford, Oxford, United Kingdom, 3Perspectum Diagnostics Ltd., Oxford, United Kingdom
Synopsis
Non-alcoholic fatty liver disease is on the rise and liver biopsies used to diagnose it need to be replaced by non-invasive methods such as T1 mapping. Guidance for MRI scans allow for free water consumption before scans, increasing measurement variability. We therefore aimed to assess the effect of hydration on liver T1 by acquiring serial shMOLLI T1 maps after participants drank 1 litre of isotonic water. As water passed through the stomach and small intestines it first reached the portal circulation and later the systemic circulation, causing an increase in liver T1 followed by an increase in spinal muscle T1.
Introduction
Non-alcoholic fatty liver disease (NAFLD) has a wide prevalence both in Western countries and worldwide (1). While it can be asymptomatic for a long time and never progress to more severe stages, its natural progression may lead to cirrhosis, liver failure, and hepatocellular carcinoma. The reference standard for diagnosing NAFLD is liver biopsy (2) which is invasive and carries a risk of complications (3). Non-invasive imaging biomarkers, such as T1 mapping are emerging as potential alternatives to liver biopsy in staging liver fibrosis and disease activity in NAFLD (4). However, T1 mapping is confounded by a number of factors related to disease (iron concentration (5), fat fraction (6)), technical limitations (B0 inhomogeneities (7)) and diurnal physiological changes in the liver (glycogen concentration (8)). Current guidance for liver T1 mapping scans can allow free consumption of water before the examination; brain T1 has been shown to depend on hydration status (9). We therefore aimed to explore the dynamic response of liver T1 to fluid consumption.Methods
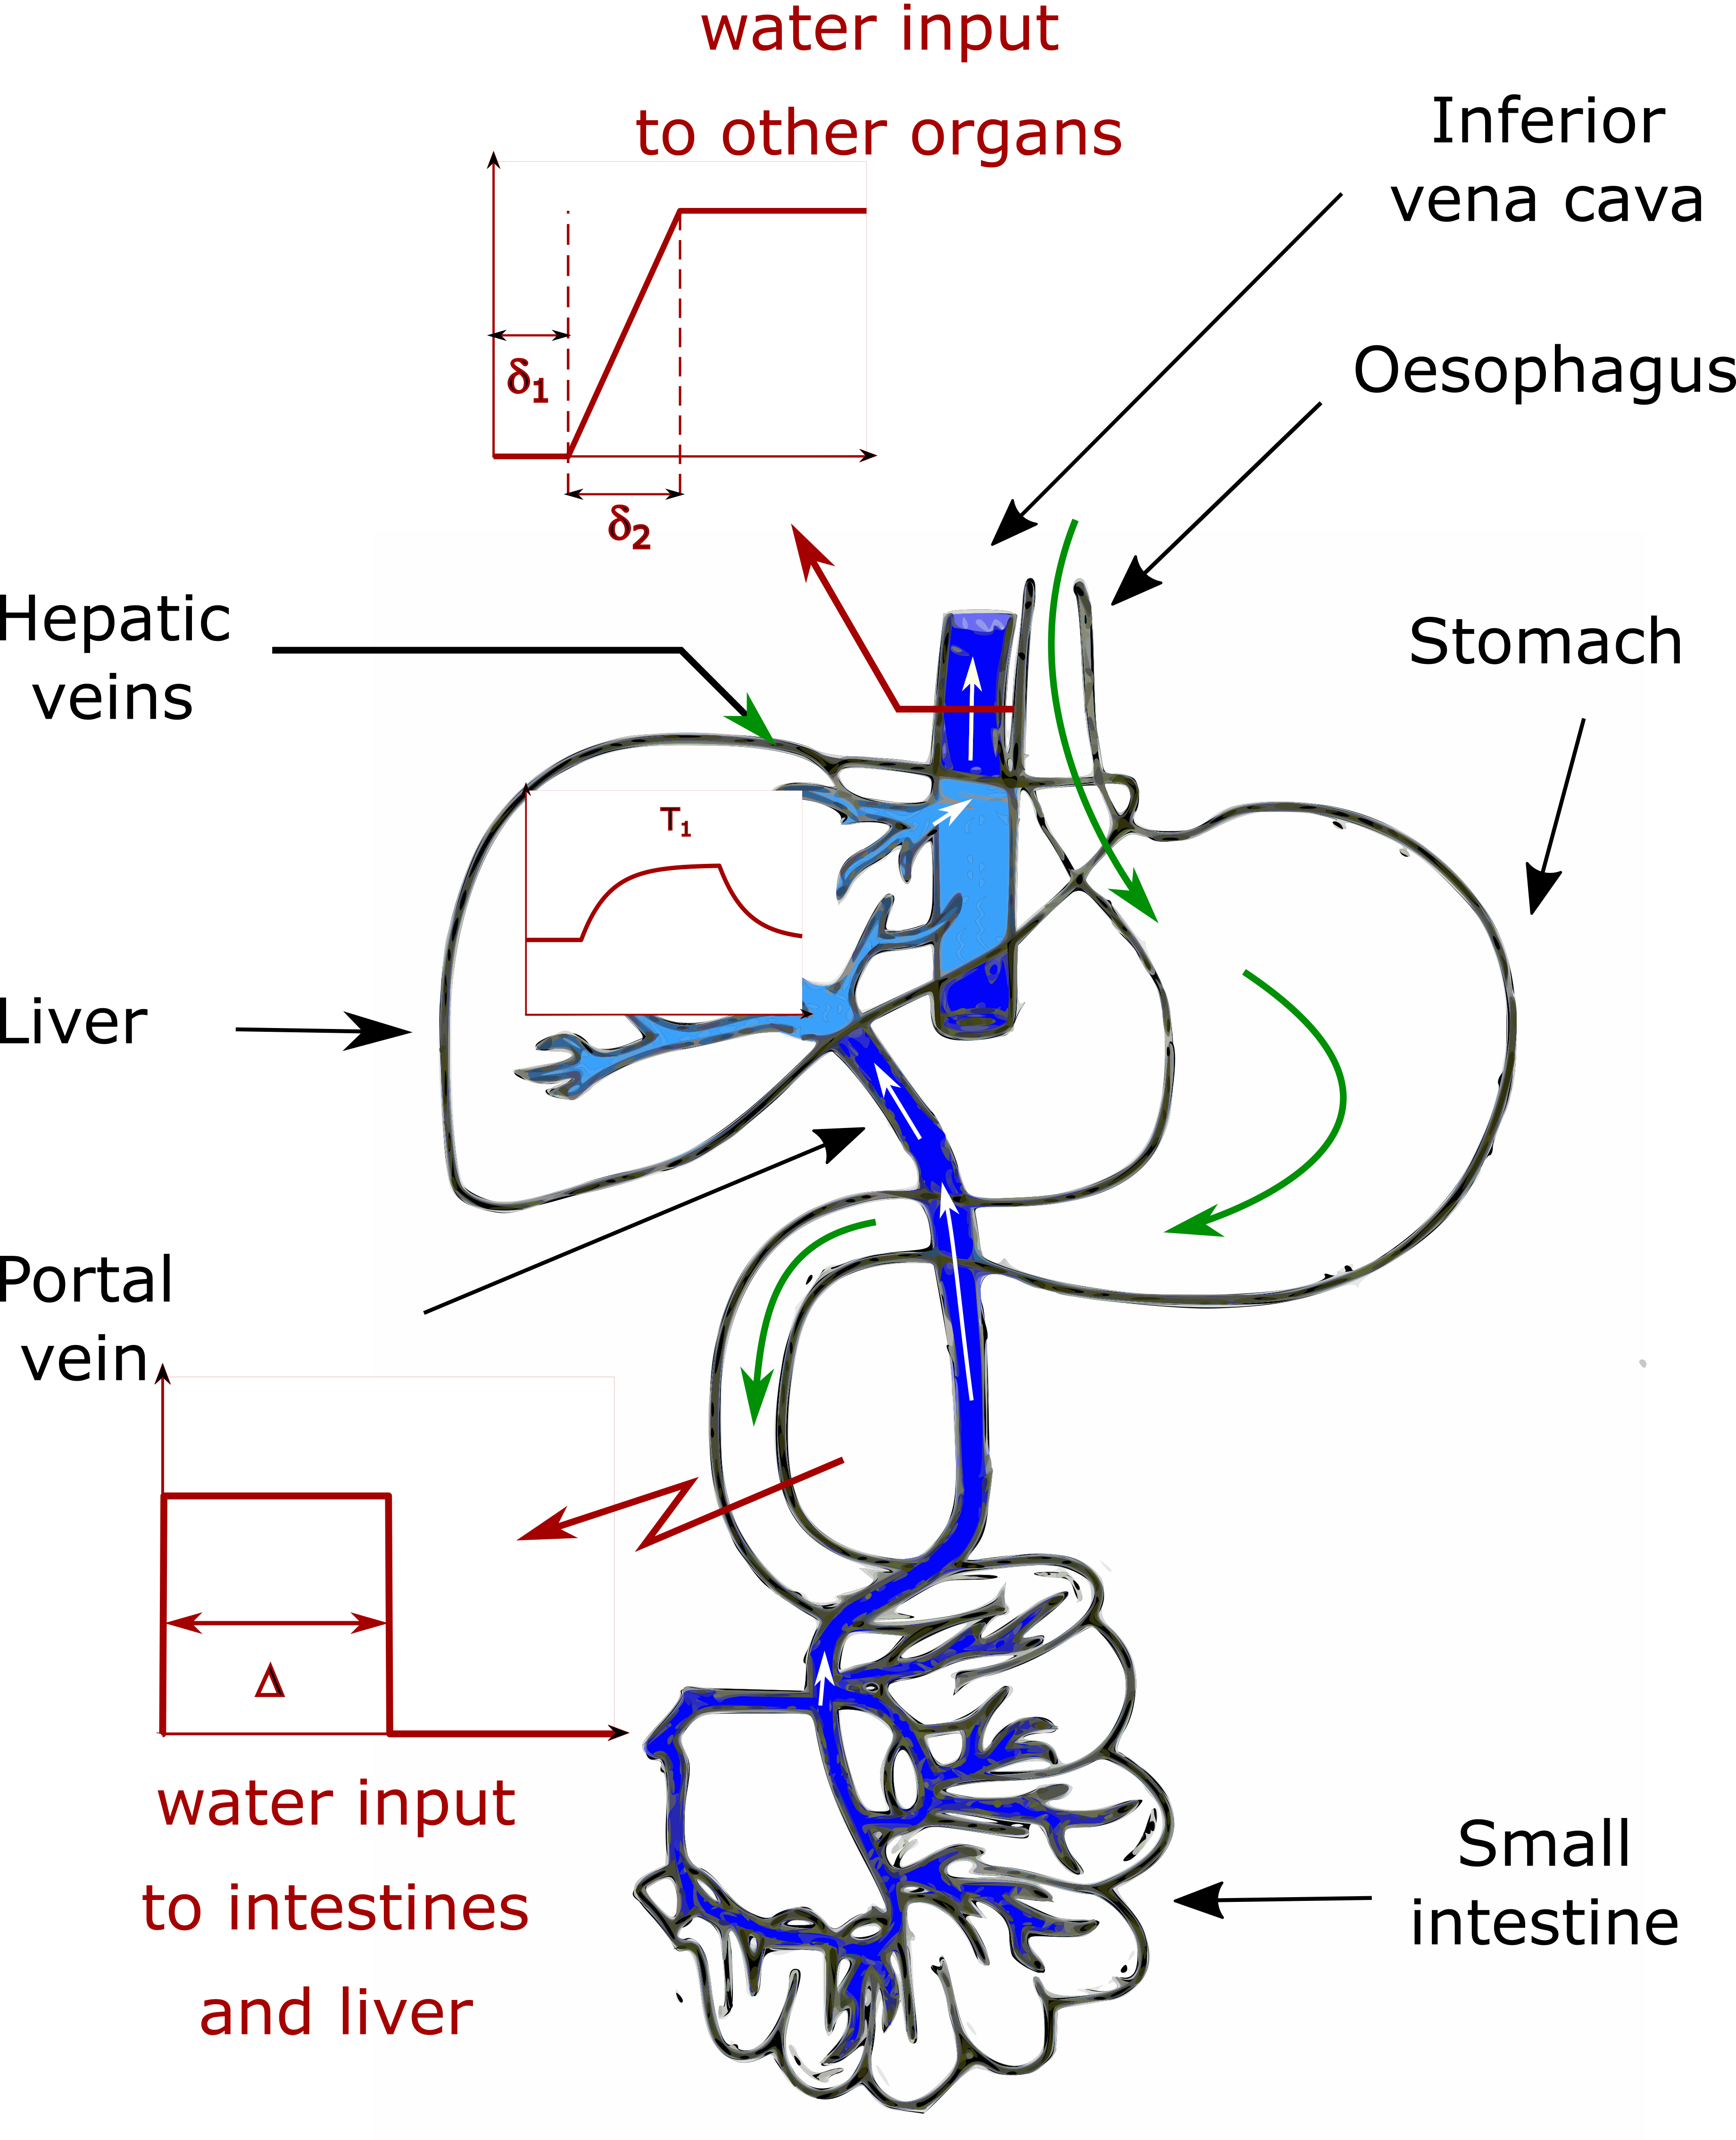
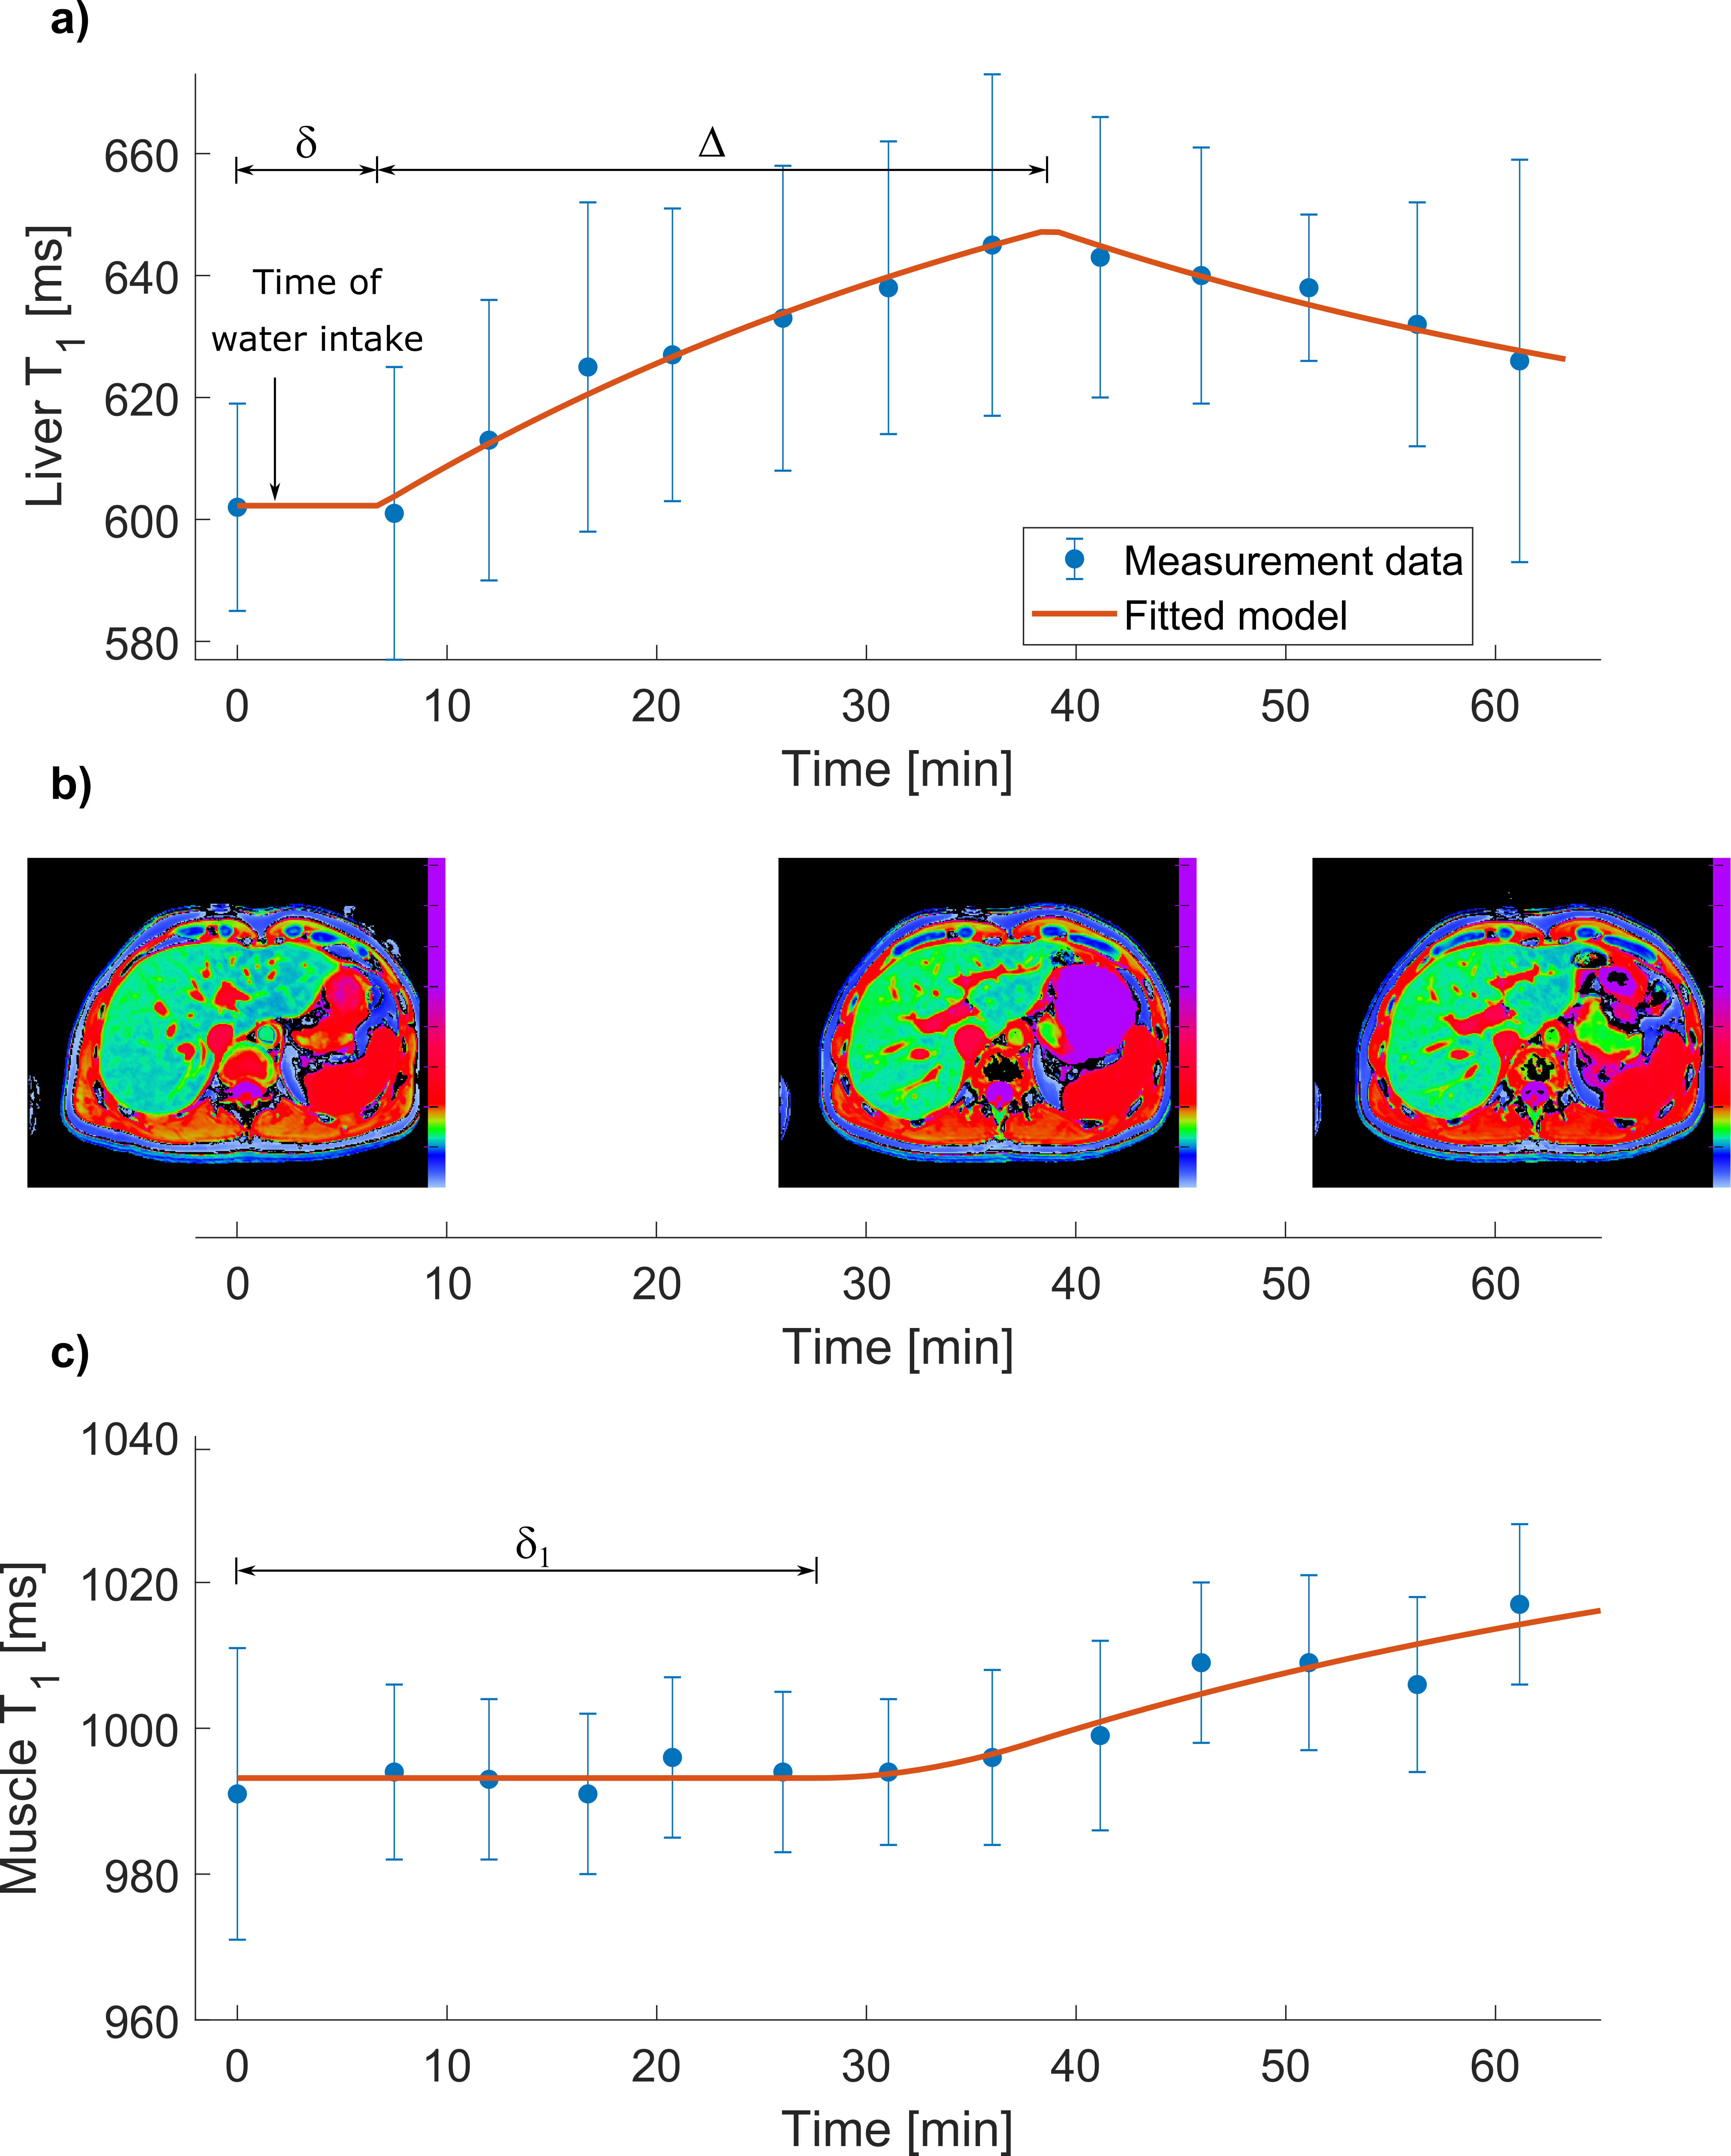
Six healthy volunteers (1 female, mean age: 30±3 years) had shMOLLI T1 (10) maps collected on a 3 T Siemens Prisma scanner (Erlangen, Germany). Participants underwent 4 hours of food fasting and 1 hour of water fasting prior to the study. After baseline measurements had been acquired, participants were taken out of the scanner and asked to drink 1 litre of isotonic water, then they returned to the scanner where serial T1 measurements were carried out every 5 minutes for at least 1 hour. T1 values of the liver and spinal erector muscles were recorded to assess the effect of hydration through the portal circulation and the systemic circulation. Paired t-tests were used to compare shMOLLI T1 values before and after water ingestion (at the peak of the T1 response). Liver and muscle were modelled as a first-order system. The ingested water passing through the stomach, absorbed in the small intestines and parts of it released in the portal circulation was considered as a pulse input function (Figure 1). In this case the time response of the liver in T1 is described by: $$T_1(t)=K_l(1-e^{-\frac{t-\delta}{\tau_l}})u(t-\delta)-K_l(1-e^{-\frac{t-\delta-\Delta}{\tau_l}})u(t-\delta-\Delta)+T_{1,0}$$ where u(t) is the Heaviside step function. The acquired T1 time series were fitted to this equation to determine Kl (a gain factor related to the magnitude of the T1 change), $$$\tau_l$$$ (the time constant of the liver, determining the rate of water uptake), $$$\delta$$$ (the delay between ingesting the water and the initial upslope in T1), $$$\Delta$$$ (the length of the pulse input) and T1,0 (the T1 of the liver in the absence of the water input). The time response of muscle T1 to a half-trapezoidal input function through the systemic circulation was: $$T_1(t)=K_m(\tau_m-t-\tau_me^{-\frac{t-\delta_1}{\tau_m}}+\delta_1)u(t-\delta_1)-K_m(\tau_m-t-\tau_me^{-\frac{t-\delta_2}{\tau_m}}+\delta_2)u(t-\delta_2)+T_{1,0}$$ Muscle T1 values were fitted to this equation to determine Km, $$$\tau_m$$$, $$$\delta_1$$$ (delay between ingesting the water and the initial upslope in muscle T1) and $$$\delta_2$$$ (duration of the upslope).Results
All subjects consumed the litre of fluid within 4 minutes. Figure 2 shows the time evolution of liver and muscle T1 in one participant. An increase in liver T1 from baseline was observed in all participants after water ingestion (p=0.003). Mean baseline liver T1 was 651±65 ms (range: 575-724 ms), mean time constant was 25±15 minutes (range 4-39 minutes), mean pulse length was 26±7 minutes (range: 17-34 minutes) and mean initial delay time was 10±6 minutes (range: 3.3-19 minutes). Figure 3 summarises the models derived for all participants. Liver T1 peaked at 36±5 minutes on average (range: 27 to 39 minutes) reflecting an observed average increase of 67±30 ms. Mean baseline muscle T1 was 1012±36 ms (range: 968-1062 ms), mean time constant was 5±8 minutes (range: 0.06 - 21 minutes), mean delay until upslope in T1 was 19±8 minutes (range: 7-29 minutes) and mean upslope duration was 36±20 minutes (range: 9-68 minutes).Discussion and conclusion
We have shown that liver T1 increased after the administration of 1 litre of isotonic water in fasting participants. Water absorbed by the small intestines entered the portal circulation first, increasing the extracellular water volume of the liver before it reached the systemic circulation – as suggested by the longer upslope delay and duration of muscle T1. The variability observed in the delay times of the model may be explained by the gut’s contribution to reaching water homeostasis. This model of the liver’s dynamic response to fluid intake could be useful in the determination of the timing of future metabolic experiments. Our measurements captured the transient changes in the liver as they would naturally occur in participants of clinical liver MRI studies who are allowed to freely consume water prior to their scans. In addition, it is possible that NAFLD patients who have undergone bariatric surgery will have different rates of gastric emptying affecting the time of water release from the gut, and ultimately resulting a different liver T1 evolution than it was found in healthy volunteers. Based on this assumption and the fact that the magnitude of observed T1 changes is comparable to an increase in T1 due to an increase of an Ishak fibrosis stage (5), clear fasting instructions for liver MRI study participants will ensure reproducible measurements.Acknowledgements
No acknowledgement found.References
1. Younossi ZM, Koenig AB, Abdelatif D, Fazel Y, Henry L, Wymer M: Global epidemiology of nonalcoholic fatty liver disease—Meta-analytic assessment of prevalence, incidence, and outcomes. J Hepatol 2016; 64:73–84.
2. European Association for the Study of the Liver (EASL) EA for the S of D (EASD), EA for the S of O (EASO), European Association for the Study of Diabetes (EASD), European Association for the Study of Obesity (EASO): EASL-EASD-EASO Clinical Practice Guidelines for the Management of Non-Alcoholic Fatty Liver Disease. Obes Facts 2016; 9:65–90.
3. Thampanitchawong P, Piratvisuth T: Liver biopsy: complications and risk factors. World J Gastroenterol 1999; 5:301–304.
4. Banerjee R, Pavlides M, Tunnicliffe EM, et al.: Multiparametric magnetic resonance for the non-invasive diagnosis of liver disease. J Hepatol 2014; 60:69–77.
5. Tunnicliffe EM, Banerjee R, Pavlides M, Neubauer S, Robson MD: A model for hepatic fibrosis: the competing effects of cell loss and iron on shortened modified Look-Locker inversion recovery T1 (shMOLLI-T1) in the liver. J Magn Reson Imaging 2017; 45:450–462.
6. Mozes FE, Tunnicliffe EM, Pavlides M, Robson MD: Influence of fat on liver T1 measurements using modified Look-Locker inversion recovery (MOLLI) methods at 3T. J Magn Reson Imaging 2016; 44:105–111.
7. Kellman P, Herzka D a, Arai AE, Hansen MS: Influence of Off-resonance in myocardial T1-mapping using SSFP based MOLLI method. J Cardiovasc Magn Reson 2013; 15:63.
8. Mozes FE, Tunnicliffe EM, Pavlides M, Robson MD: The influence of glycogen on shortened modified Look-Locker inversion recovery (shMOLLI) T1 maps of the liver. In Proc Intl Soc Mag Reson Med 262; 2018:2613.
9. Meyers SM, Tam R, Lee JS, et al.: Does hydration status affect MRI measures of brain volume or water content? J Magn Reson Imaging 2016; 44:296–304.
10. Piechnik SK, Ferreira VM, Dall’Armellina E, et al.: Shortened Modified Look-Locker Inversion recovery (ShMOLLI) for clinical myocardial T1-mapping at 1.5 and 3 T within a 9 heartbeat breathhold. J Cardiovasc Magn Reson 2010; 12:69.
Figures