0309
Prospective Comparison of MR Elastography with MRI Cine-Tagging of Cardiac-Induced Motion for Noninvasive Staging of Liver Fibrosis1Department of Radiology, Radio-Oncology and Nuclear Medicine, Université de Montréal, Montreal, QC, Canada, 2Centre de recherche du Centre hospitalier de l'Université de Montréal (CRCHUM), Montréal, QC, Canada, 3Medical Physics Unit, McGill University, Montréal, QC, Canada, 4C.J. Gorter Center for High Field MRI, Department of Radiology, Leiden University Medical Center (LUMC), Leiden, Netherlands, 5Department of Medicine, Division of Gastroenterology and Hepatology, McGill University Health Centre (MUHC), Montréal, QC, Canada, 6Department of Medicine, Division of Hepatology and Liver Transplantation, Université de Montréal, Montréal, QC, Canada, 7Department of Social and Preventive Medicine, École de santé publique de l’Université de Montréal (ESPUM), Montréal, QC, Canada, 8Service of Pathology, Centre hospitalier de l'Université de Montréal (CHUM), Montréal, QC, Canada, 9MR Clinical Science, Philips Healthcare Canada, Markham, ON, Canada, 10Institute of Biomedical Engineering, Université de Montréal, Montréal, QC, Canada, 11Laboratory of Biorheology and Medical Ultrasonics (LBUM), Centre de recherche du Centre hospitalier de l'Université de Montréal (CRCHUM), Montréal, QC, Canada
Synopsis
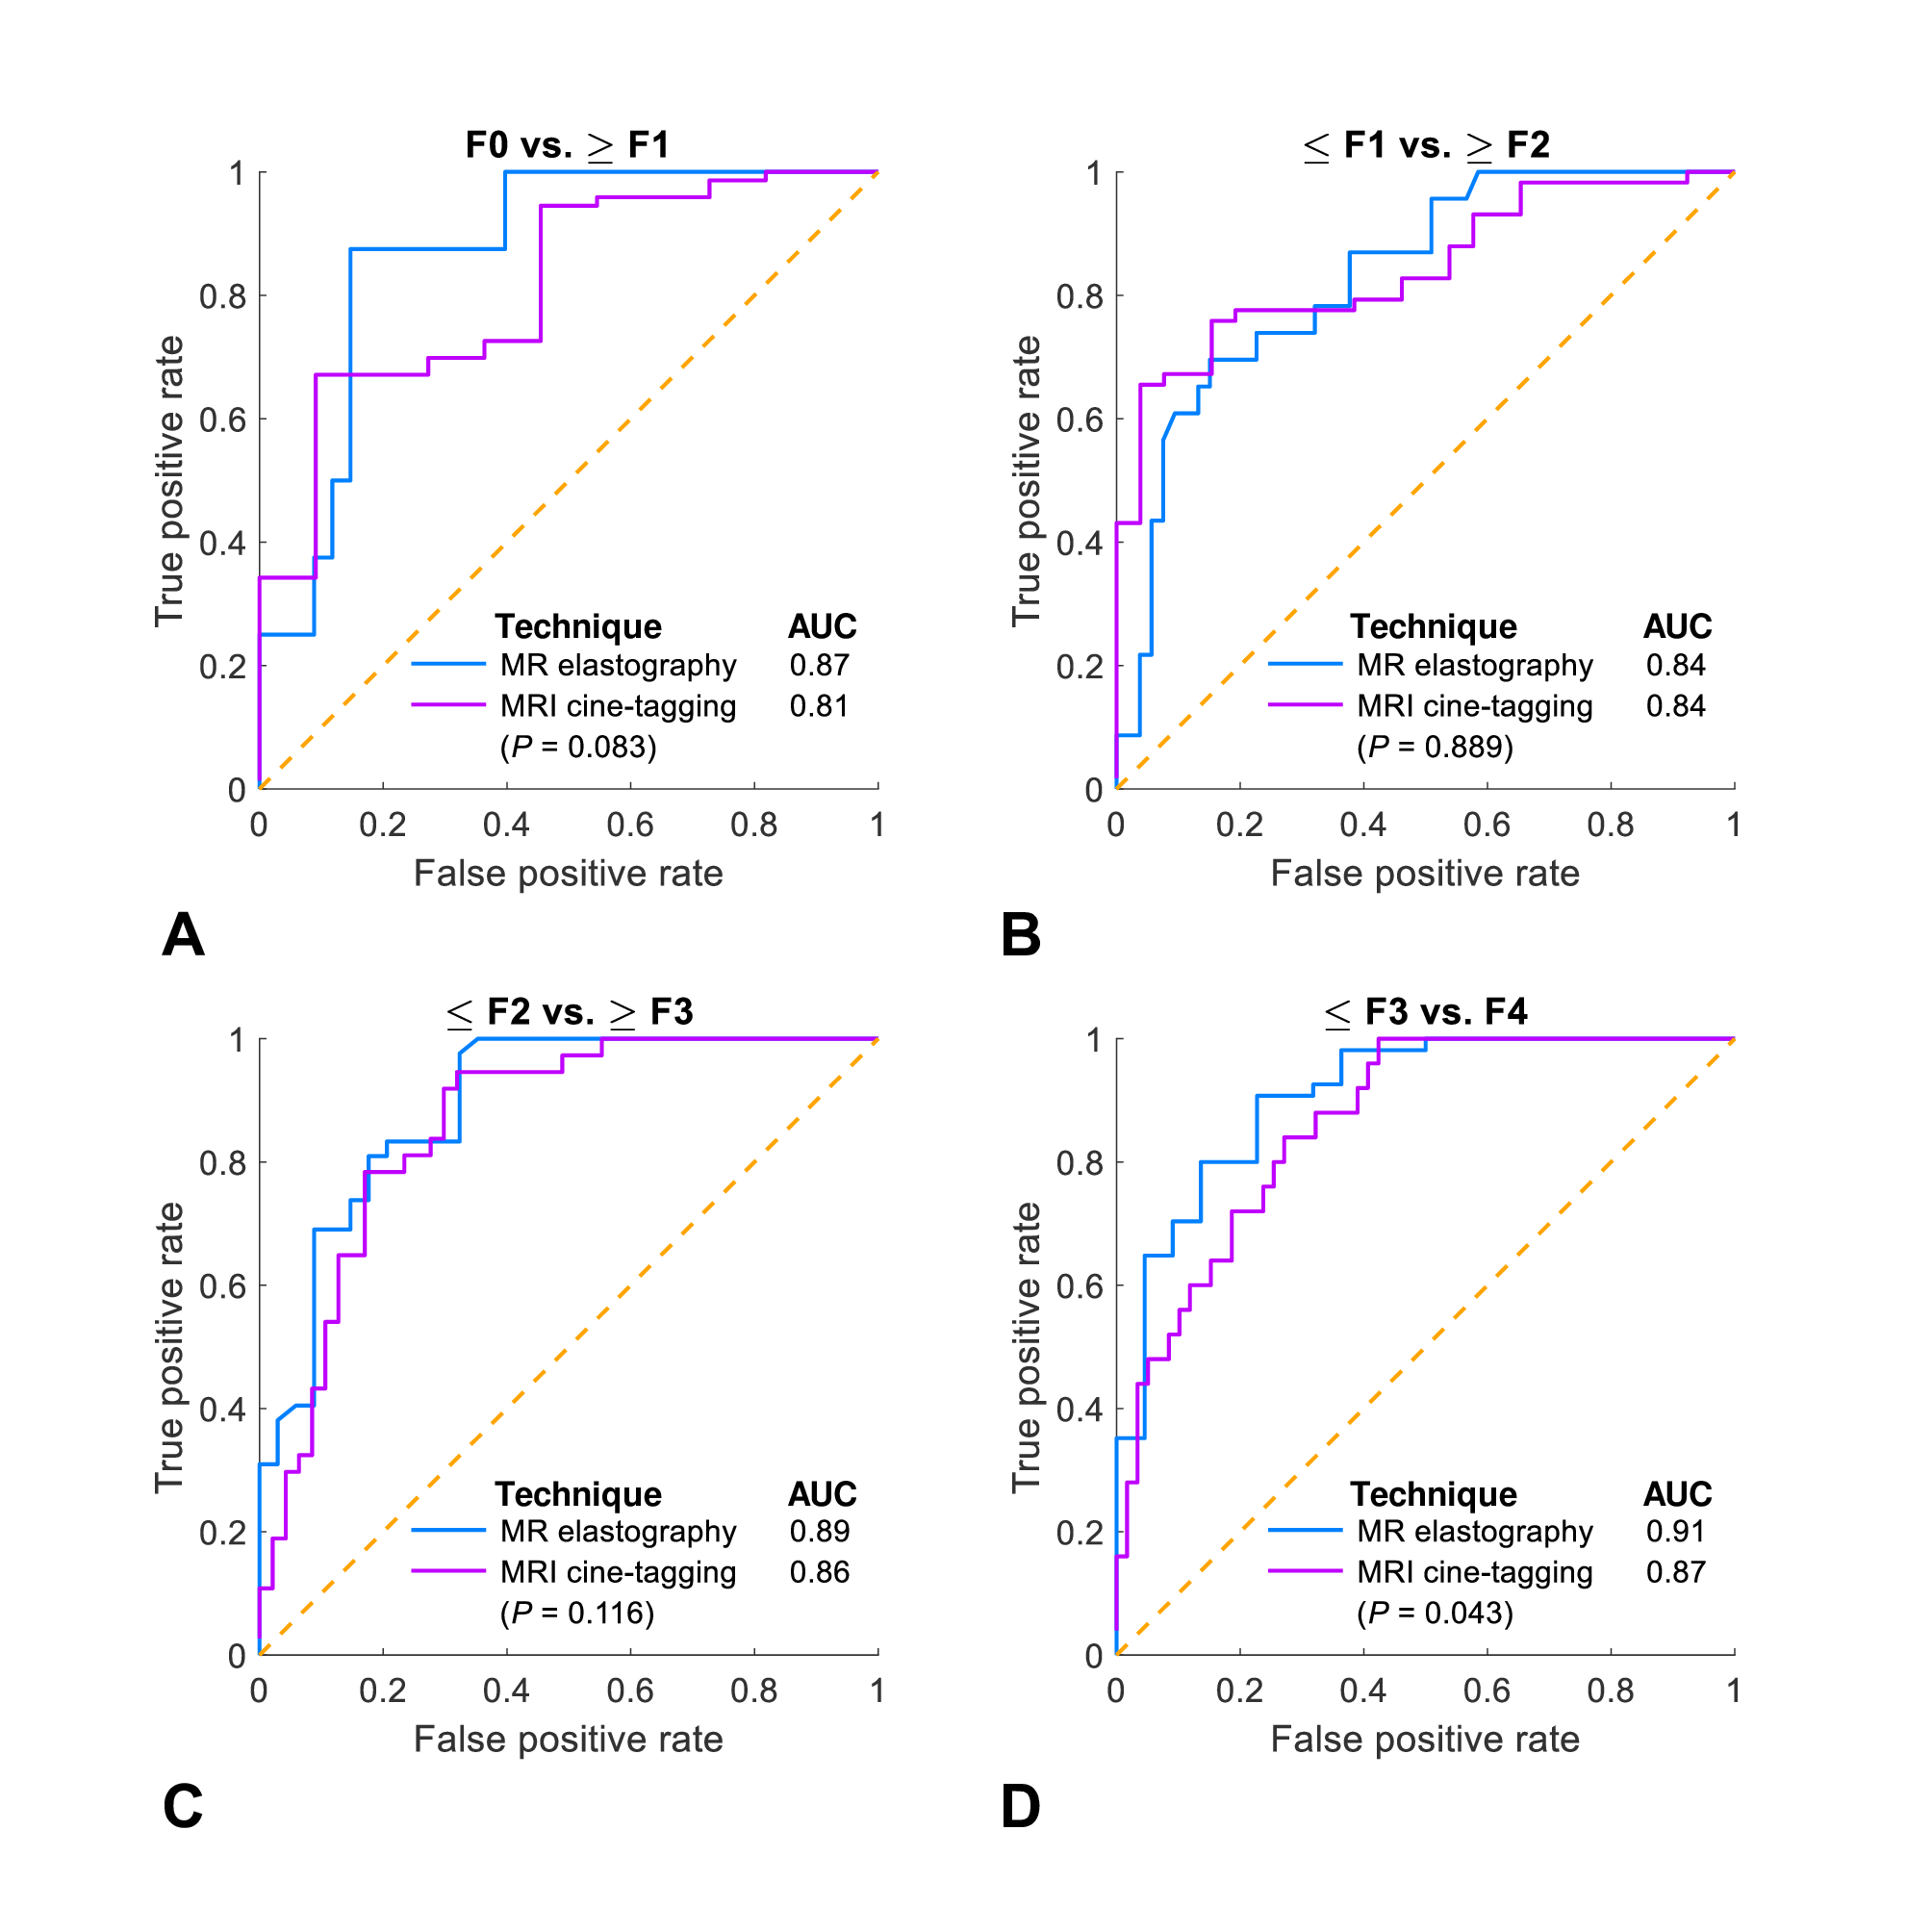
MR elastography for staging liver fibrosis assesses the right liver lobe and requires external hardware. MRI cine-tagging evaluates cardiac-induced strain and shows promise for assessing fibrosis in the left lobe without additional hardware. Shear modulus measured by MRE provided higher AUCs than that of strain measured on tagged images for distinguishing stages F0 vs. ≥F1 (0.87 vs. 0.81, P=0.083) and ≤F3 vs. F4 (0.91 vs. 0.87, P=0.043). Hence, MRE provided a diagnostic accuracy similar or higher than that of MRI cine-tagging for staging of liver fibrosis. Strain could be evaluated on screening abdominal MRI to assess the left liver.
INTRODUCTION
Over the past two decades, several imaging-based techniques have been developed for noninvasive detection and staging of liver fibrosis to address the shortcomings of liver biopsy, the current reference standard. Magnetic resonance elastography (MRE), which measures viscoelastic properties of the liver using an external transducer to generate shear waves, arguably provides the highest accuracy for liver fibrosis staging.1 Recently, studies have used MRI cine-tagging for assessment of liver strain by measuring the deformation of the left liver lobe in response to intrinsic cardiac motion.2-5 To our knowledge, no previous study has compared the diagnostic performance of MRE and MRI cine-tagging of cardiac-induced motion for staging of liver fibrosis.PURPOSE
To prospectively compare the diagnostic performance of MRE and MRI cine-tagging for staging histology-determined fibrosis stages in patients with chronic liver disease (CLD).METHODS
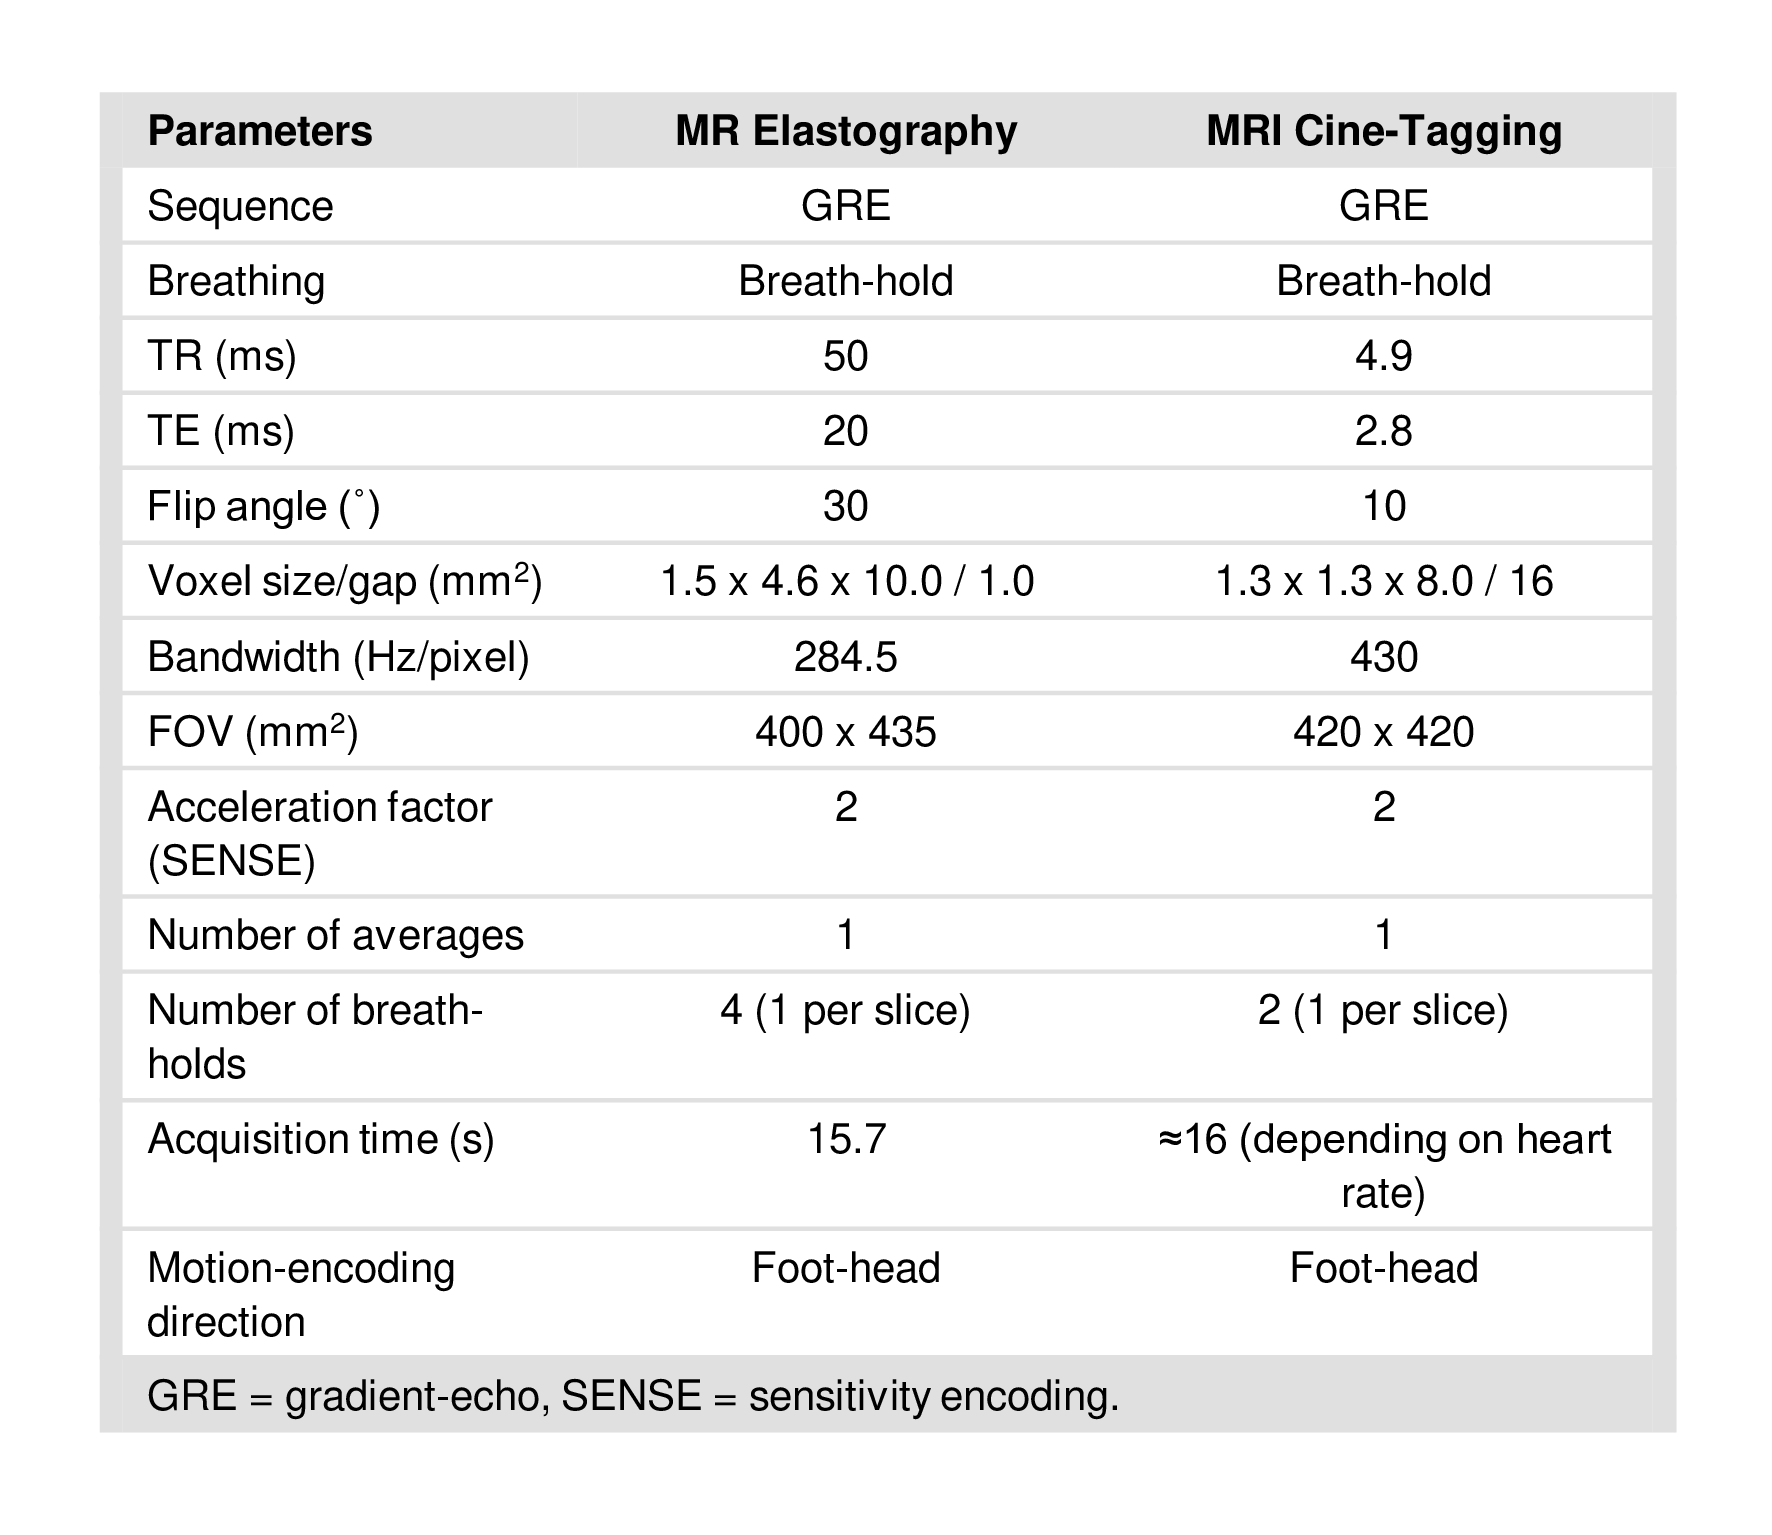
This cross-sectional dual-center study was approved by the institutional review board of both participating institutions. Adult patients were recruited between September 2014 and September 2018 at the hepatology clinics of participating institutions. Subjects were eligible if 1) they had CLD – non-alcoholic steatohepatitis, hepatitis B virus, hepatitis C virus, or autoimmune hepatitis –, 2) underwent liver biopsy as part of their clinical standard of care, and 3) if they did not have any contraindication to MRI. All MRI examinations were conducted in fasted state on a 3.0T clinical scanner (Achieva TX, Philips Healthcare, Best, Netherlands). For MRE examinations, the acquisition of a motion-sensitized gradient-echo (GRE) sequence was synchronized with a mechanical vibration (60Hz) generated with a transducer (Resoundant) positioned on the right side of the patient in supine position.6 Four transverse slices through the liver were acquired with parameters described in Figure 1. Inversion and elastography image processing were performed as previously described.6 On the four axial slices, image analysts contoured the liver and excluded major vessels. Shear modulus was evaluated in the segmented volume within regions of interest (ROI) with reliable stiffness estimates (i.e., providing R2 ≥ 0.95) on a confidence map. For MRI cine-tagging examinations, acquisitions of 2D multi-slice GRE sequence with spatial modulation of magnetization (SPAMM) preparation were performed with peripheral pulse-wave triggering. The SPAMM preparation created a magnetization grid, or “tags”, on images from the induced sinusoidal magnetization modulation. Two coronal slices were acquired within two successive breath-holds at end expiration with parameters described in Figure 1. Twelve to fifteen phases were acquired per cardiac cycle and tags were spaced by 8mm with orientation of 0° and 90° (perpendicular). The strain tensor at every position in the image through time was evaluated using the harmonic phase (HARP) software, taking advantages of magnetization grid properties (HARP 2.1 for MATLAB, John Hopkins University, Baltimore).7 In an ROI of 22cm2, maximal values of strain were evaluated on each slice in the left lobe of the liver close to the heart apex over the cardiac cycle. Maximal strain was obtained on the averaged ROI from the two coronal slices. An experienced liver pathologist centrally scored fibrosis stages. The pathologist was blinded to imaging results and image analysts were blinded to biopsy results. Measurements of shear modulus by MRE and of strain by MRI cine-tagging were investigated as surrogate biomarkers of liver fibrosis. Spearman's correlation, Kruskal-Wallis test, and receiver operating characteristics (ROC) analyses were performed and areas under ROC curves (AUC) were compared using the Delong method. Bootstrapping was used to estimate the 95% confidence intervals of AUCs. Thresholds providing a sensitivity approaching 90% were identified and the corresponding specificity, accuracy, positive predictive value, negative predictive value, and confusion matrices were reported.RESULTS
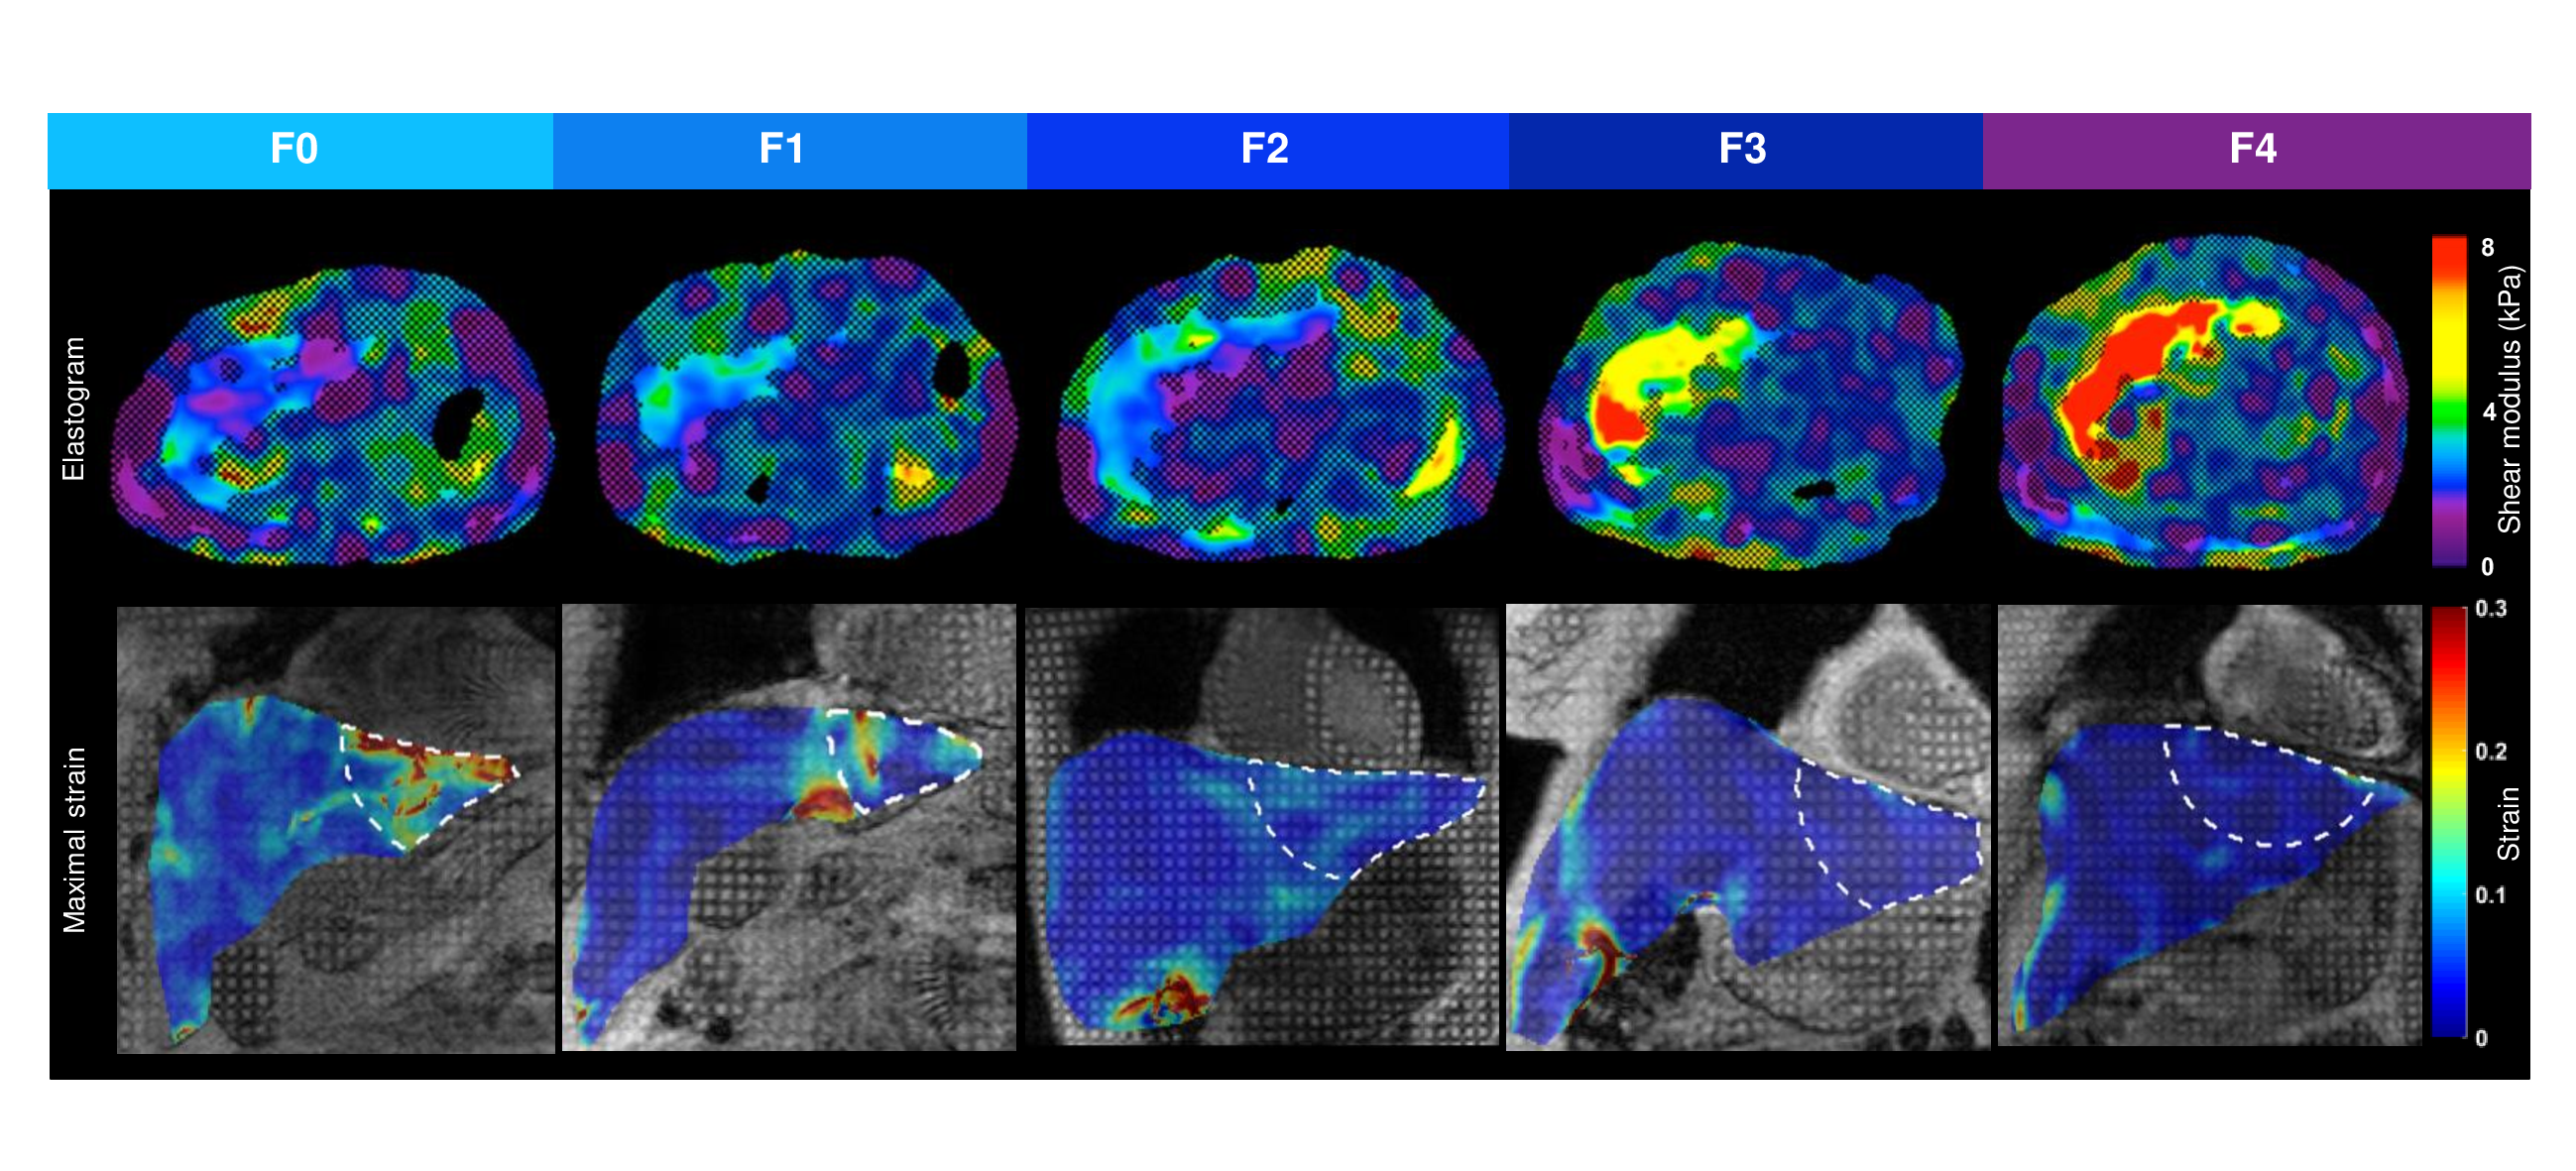
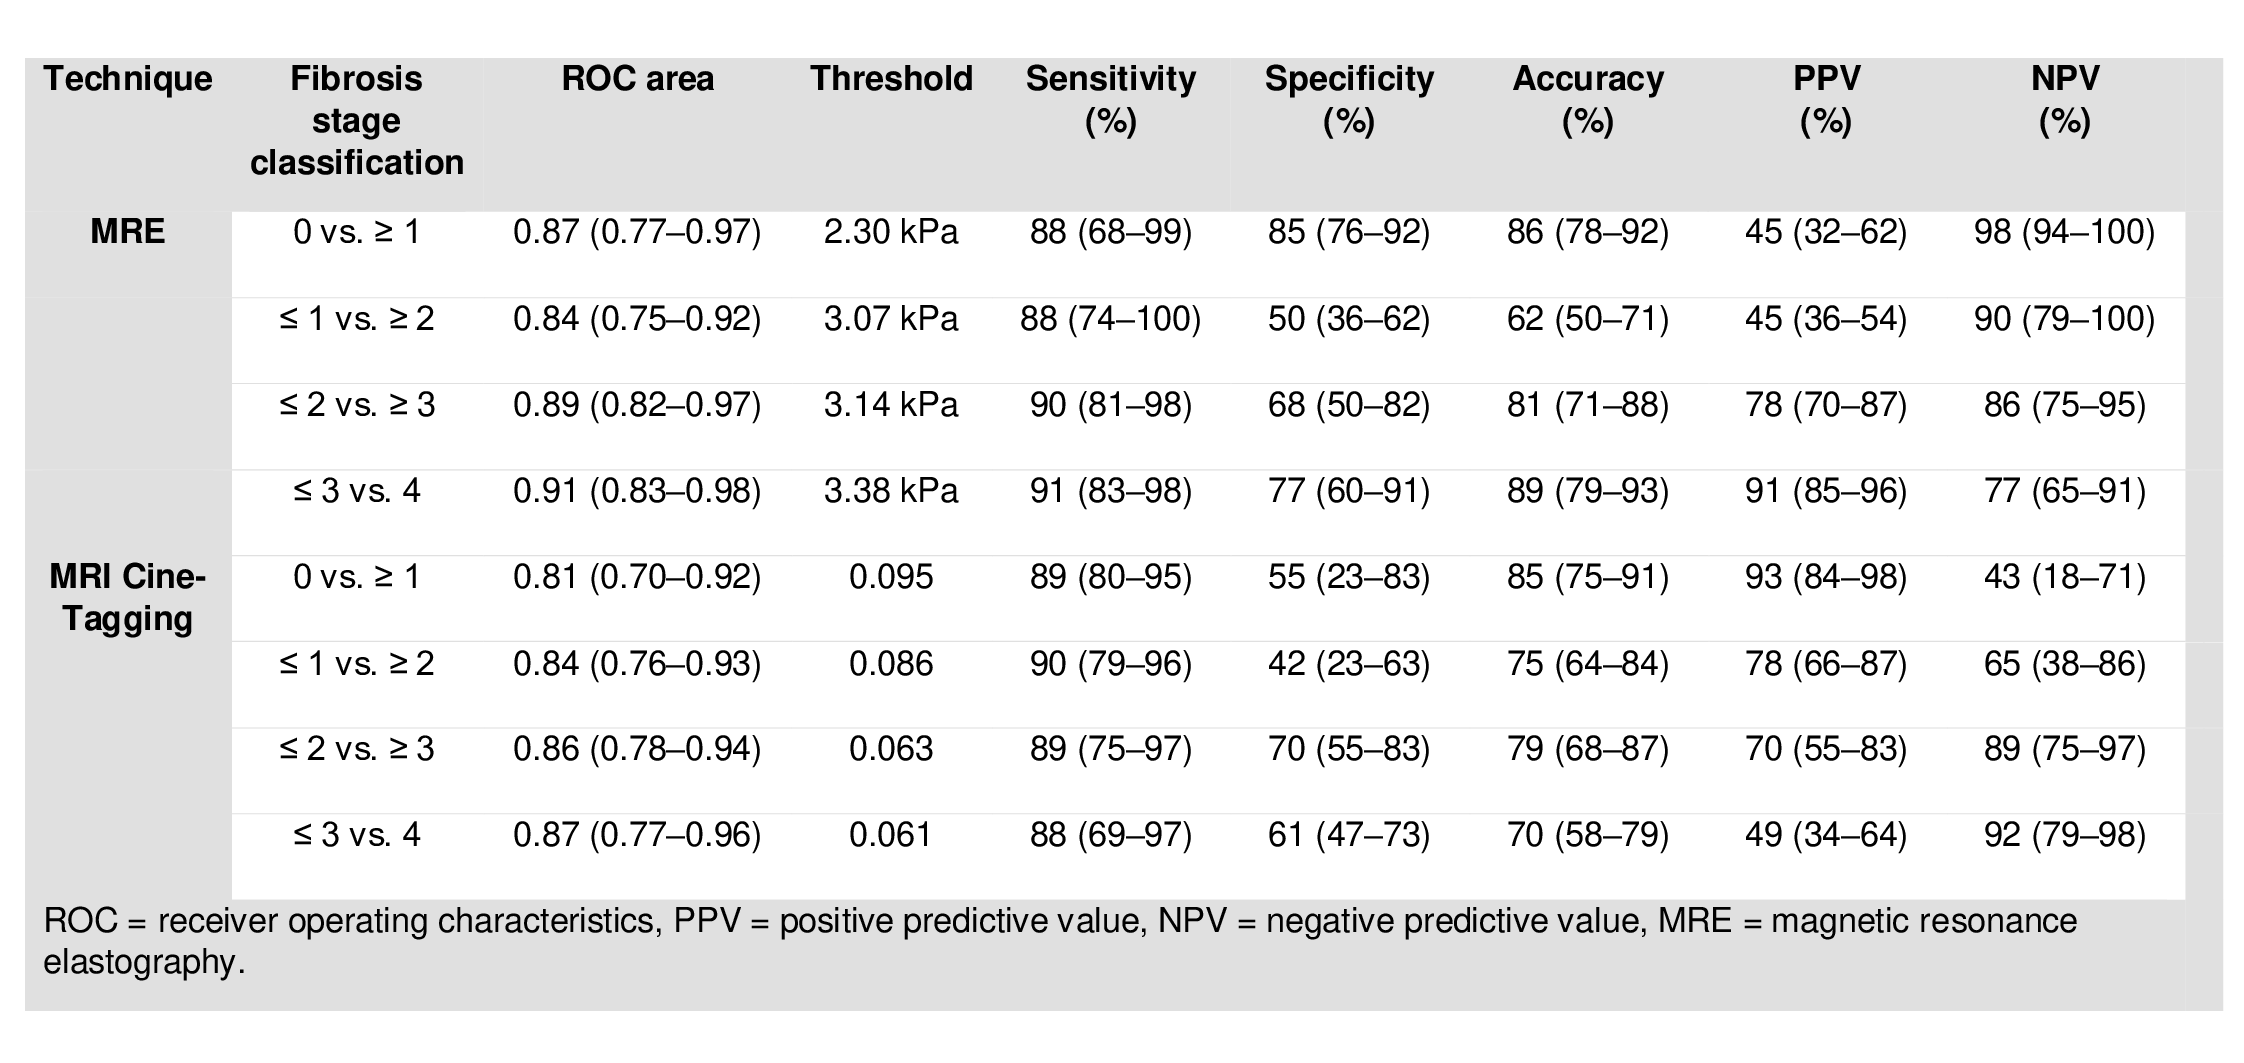
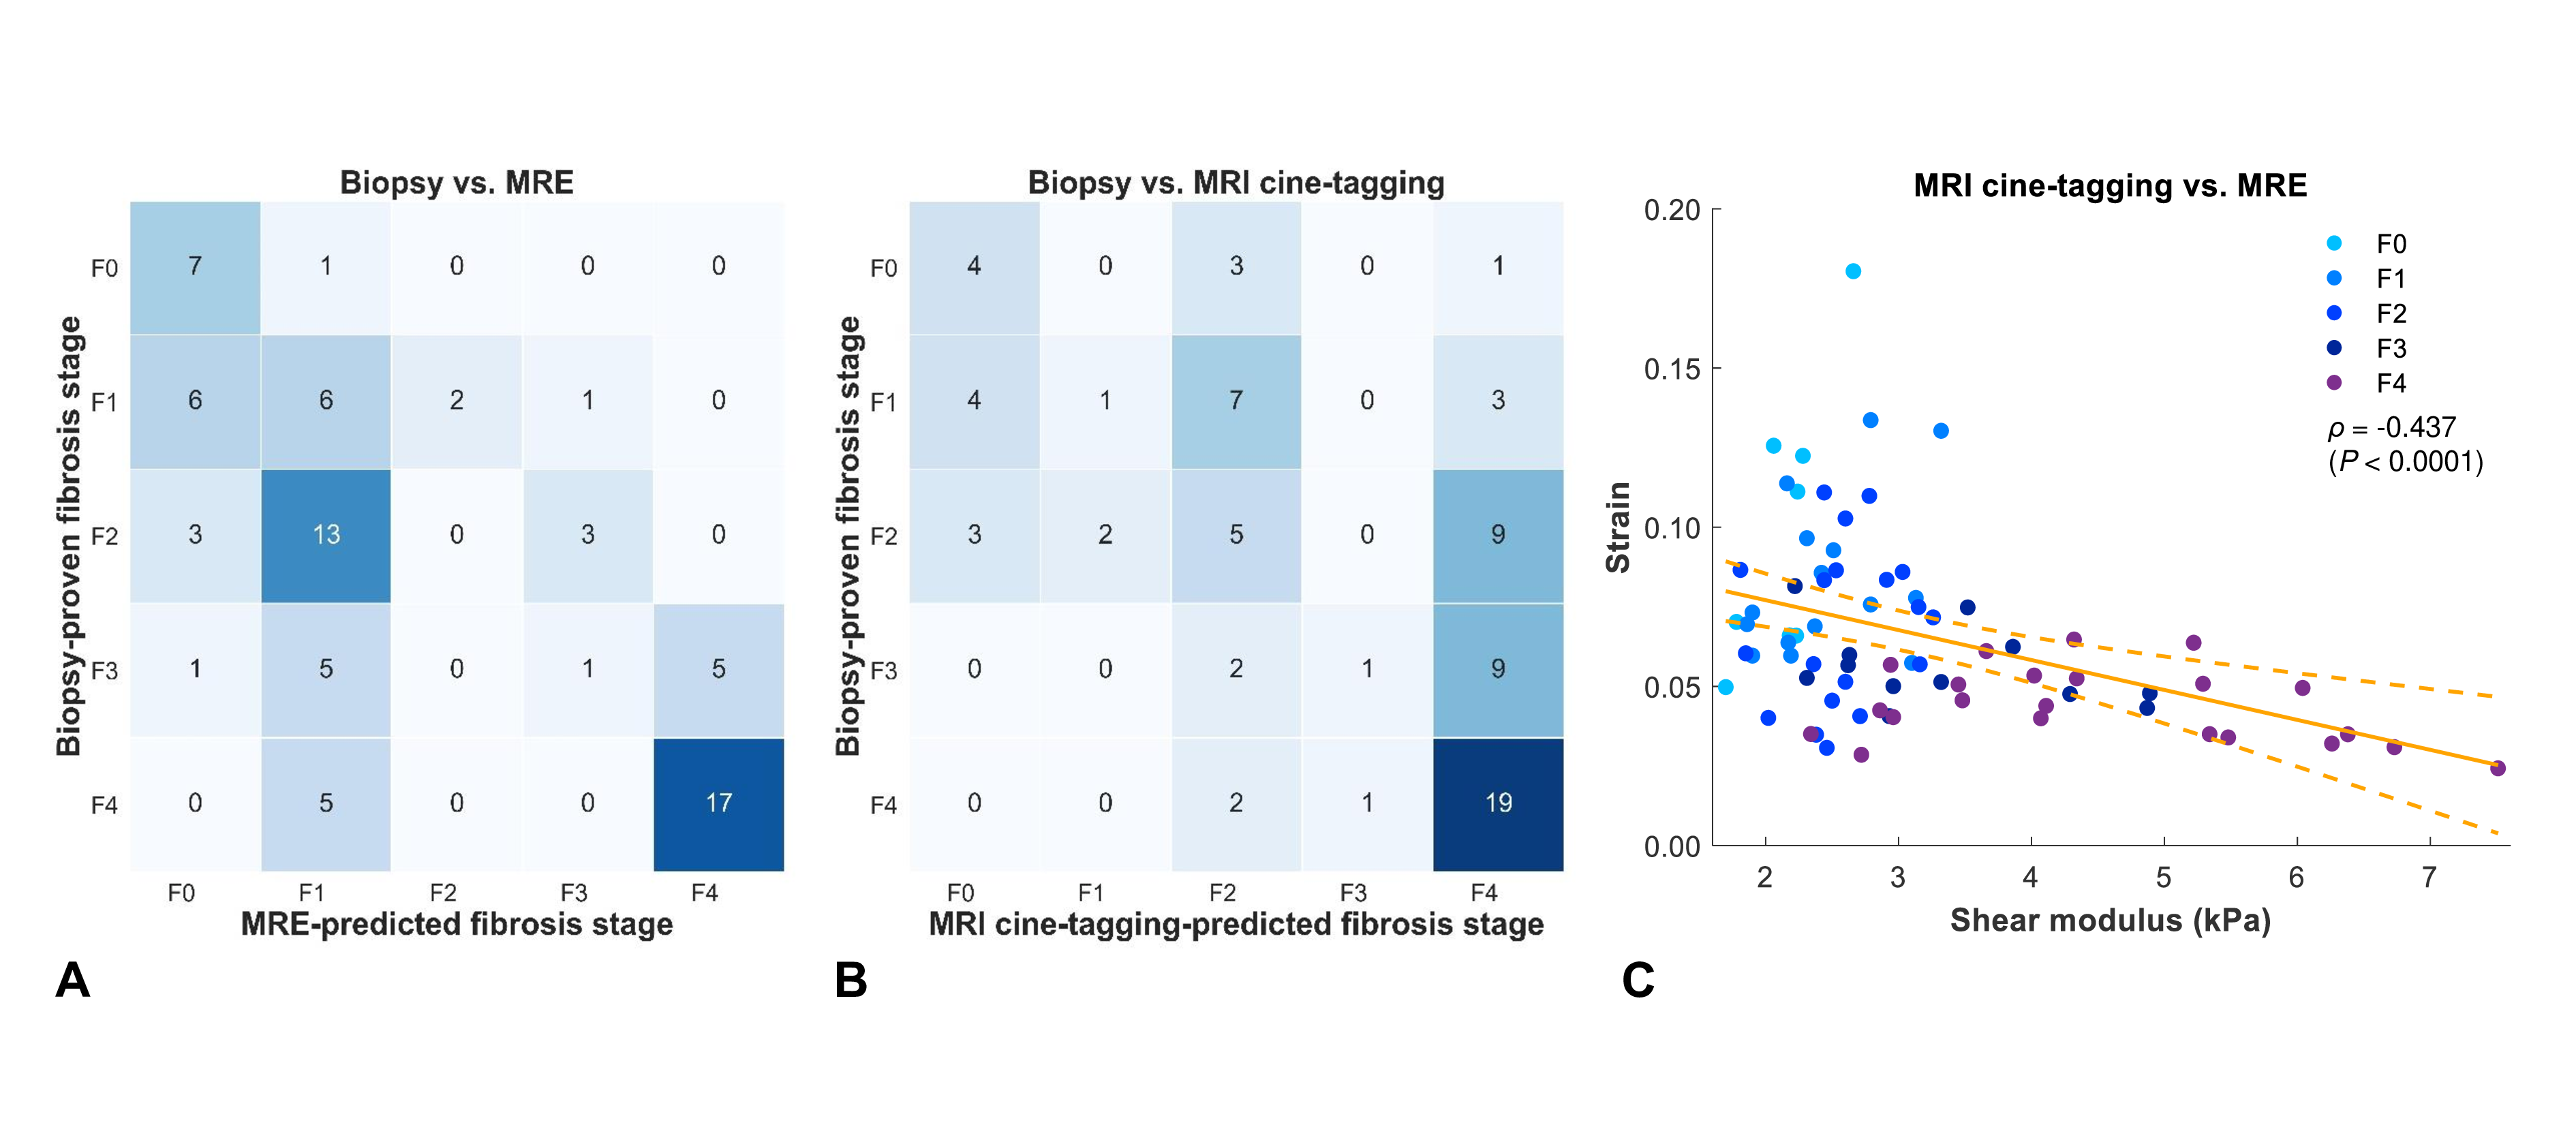
Seventy-six subjects were included. Shear modulus increased and strain decreased with higher histological fibrosis stage (ρ = 0.726 and ρ = -0.672, respectively; P < 0.0001) (Figure 2). Shear modulus and strain values were both significantly different across all fibrosis stages (P < 0.0001). Figure 3 summarizes the diagnostic performance of index tests for staging liver fibrosis. Figure 4 shows confusion matrices of index tests measurements vs. fibrosis stages and a scatter plot of index tests against one another. Figure 5 shows ROC curves of each index test measurement vs. dichotomized groups of fibrosis stages. With MRE-based shear modulus and MRI cine-tagging-based strain, AUCs were respectively 0.87 (95% confidence interval: 0.77-0.97) and 0.81 (0.70-0.92) for distinguishing fibrosis stages F0 vs. ≥F1; 0.84 (0.75-0.92) and 0.84 (0.76-0.93) for stages ≤F1 vs. ≥F2; 0.89 (0.82-0.97) and 0.86 (0.78-0.94) for stages ≤F2 vs. ≥F3; and 0.91 (0.83-0.98) and 0.87 (0.77-0.96) for stages ≤F3 vs. F4. MRE provided higher AUCs than MRI cine-tagging for distinguishing stages F0 vs. ≥F1 (0.87 vs. 0.81, P = 0.083) and ≤F3 vs. F4 (0.91 vs. 0.87, P = 0.043). AUCs were not significantly different for differentiating stages ≤F1 vs. ≥F2 (0.84 vs. 0.84, P = 0.889) and ≤F2 vs. ≥F3 (0.89 vs. 0.86, P = 0.116).CONCLUSION
We performed a head-to-head comparison of MRE and MRI cine-tagging of cardiac-induced motion for the assessment of histology-determined liver fibrosis stages. Overall, MRE provided a diagnostic performance similar or higher than that of MRI cine-tagging for staging liver fibrosis. Liver strain could be evaluated on screening abdominal MRI to provide additional information on the left lobe without any additional hardware.Acknowledgements
We thank Mr. Walid El Abyad, Mrs. Catherine Huet, and Mrs. Assia Belblidia for their support with image post-processing and patient enrollment. This work has been supported by grants from Canadian Institutes of Health Research (CIHR)-Institute of Nutrition, Metabolism, and Diabetes (INMD) (CIHR-INMD #273738 and #301520). Dr. An Tang is receiving support from Fonds de recherche du Québec en Santé (FRQS) and Fondation de l’Association des Radiologistes du Québec (FRQS-FARQ #26993 and #34939) and from Centre de Recherche du Centre hospitalier de l'Université de Montréal (CRCHUM).References
1. Kennedy P, Wagner M, Castéra L, Hong CW, Johnson CL, Sirlin CB, Taouli B. Quantitative Elastography Methods in Liver Disease: Current Evidence and Future Directions. Radiology. 2018 Mar;286(3):738-763.2.
2. Chung S, Kim KE, Park MS, Bhagavatula S, Babb J, Axel L. Liver stiffness assessment with tagged MRI of cardiac-induced liver motion in cirrhosis patients. Journal of magnetic resonance imaging : JMRI. 2014;39(5):1301-7.
3. Harouni AA, Gharib AM, Osman NF, Morse C, Heller T, Abd-Elmoniem KZ. Assessment of liver fibrosis using fast strain-encoded MRI driven by inherent cardiac motion. Magnetic resonance in medicine. 2014.
4. Mannelli L, Wilson GJ, Dubinsky TJ, et al. Assessment of the liver strain among cirrhotic and normal livers using tagged MRI. Journal of magnetic resonance imaging : JMRI. 2012;36(6):1490-5.
5. Chung S, Breton E, Mannelli L, Axel L. Liver stiffness assessment by tagged MRI of cardiac-induced liver motion. Magnetic resonance in medicine. 2011;65(4):949-55.
6. Venkatesh SK, Ehman RL. Magnetic resonance elastography of liver. Magn Reson Imaging Clin N Am. 2014;22(3):433-46.
7. Osman NF, Kerwin WS, McVeigh ER, Prince JL. Cardiac motion tracking using CINE harmonic phase (HARP) magnetic resonance imaging. Magnetic resonance in medicine. 1999;42(6):1048-60.
Figures