0307
Fully Automated Prediction of Liver Fibrosis using Deep Learning Analysis of Gadoxetic acid-enhanced MRI1BioMedical Engineering and Imaging Institute, Icahn School of Medicine at Mount Sinai, New York, NY, United States, 2Department of Diagnostic, Molecular and Interventional Radiology, Icahn School of Medicine at Mount Sinai, New York, NY, United States, 3Department of Radiology, Weill Cornell Medicine, New York, NY, United States, 4Prealize Health, Palo Alto, CA, United States, 5Medical Imaging Processing Lab, Tel Aviv University, Tel Aviv, Israel, 6Division of Liver Diseases, Icahn School of Medicine at Mount Sinai, New York, NY, United States
Synopsis
In this study we developed a fully automated deep learning algorithm based on gadoxetic acid-enhanced MRI for noninvasive prediction of liver fibrosis. We found good-to-excellent performance of the algorithm in an independent test set (AUC 0.77 – 0.91), which was equivalent to the diagnostic performance of MR elastography (AUC 0.86 – 0.92, p-values between methods >0.134). The developed algorithm may potentially allow for noninvasive liver fibrosis assessment, without the need for invasive biopsies.
Purpose
It is of critical importance to monitor liver fibrosis development in chronic liver disease (CLD) patients to aid in therapeutic strategies to prevent progression to advanced fibrosis or cirrhosis, or to even reverse fibrosis (1). Liver biopsy is considered the gold standard for the diagnosis and staging of liver fibrosis. However, biopsies can lead to potential complications and carry significant limitations including potential sampling errors and interobserver variability (2). Therefore, there is a need for noninvasive means for the assessment of liver fibrosis. The current best imaging technique for liver fibrosis detection and staging is MR elastography (MRE). However, MRE requires dedicated external hardware and is mostly restricted to specialized centers (3). The goals of our study were to (1) develop a fully-automated deep learning (DL) algorithm based on routine standard-of-care gadoxetic enhanced hepatobiliary phase (HBP) MRI and (2) compare the diagnostic performance of DL vs. MRE.Materials and Methods
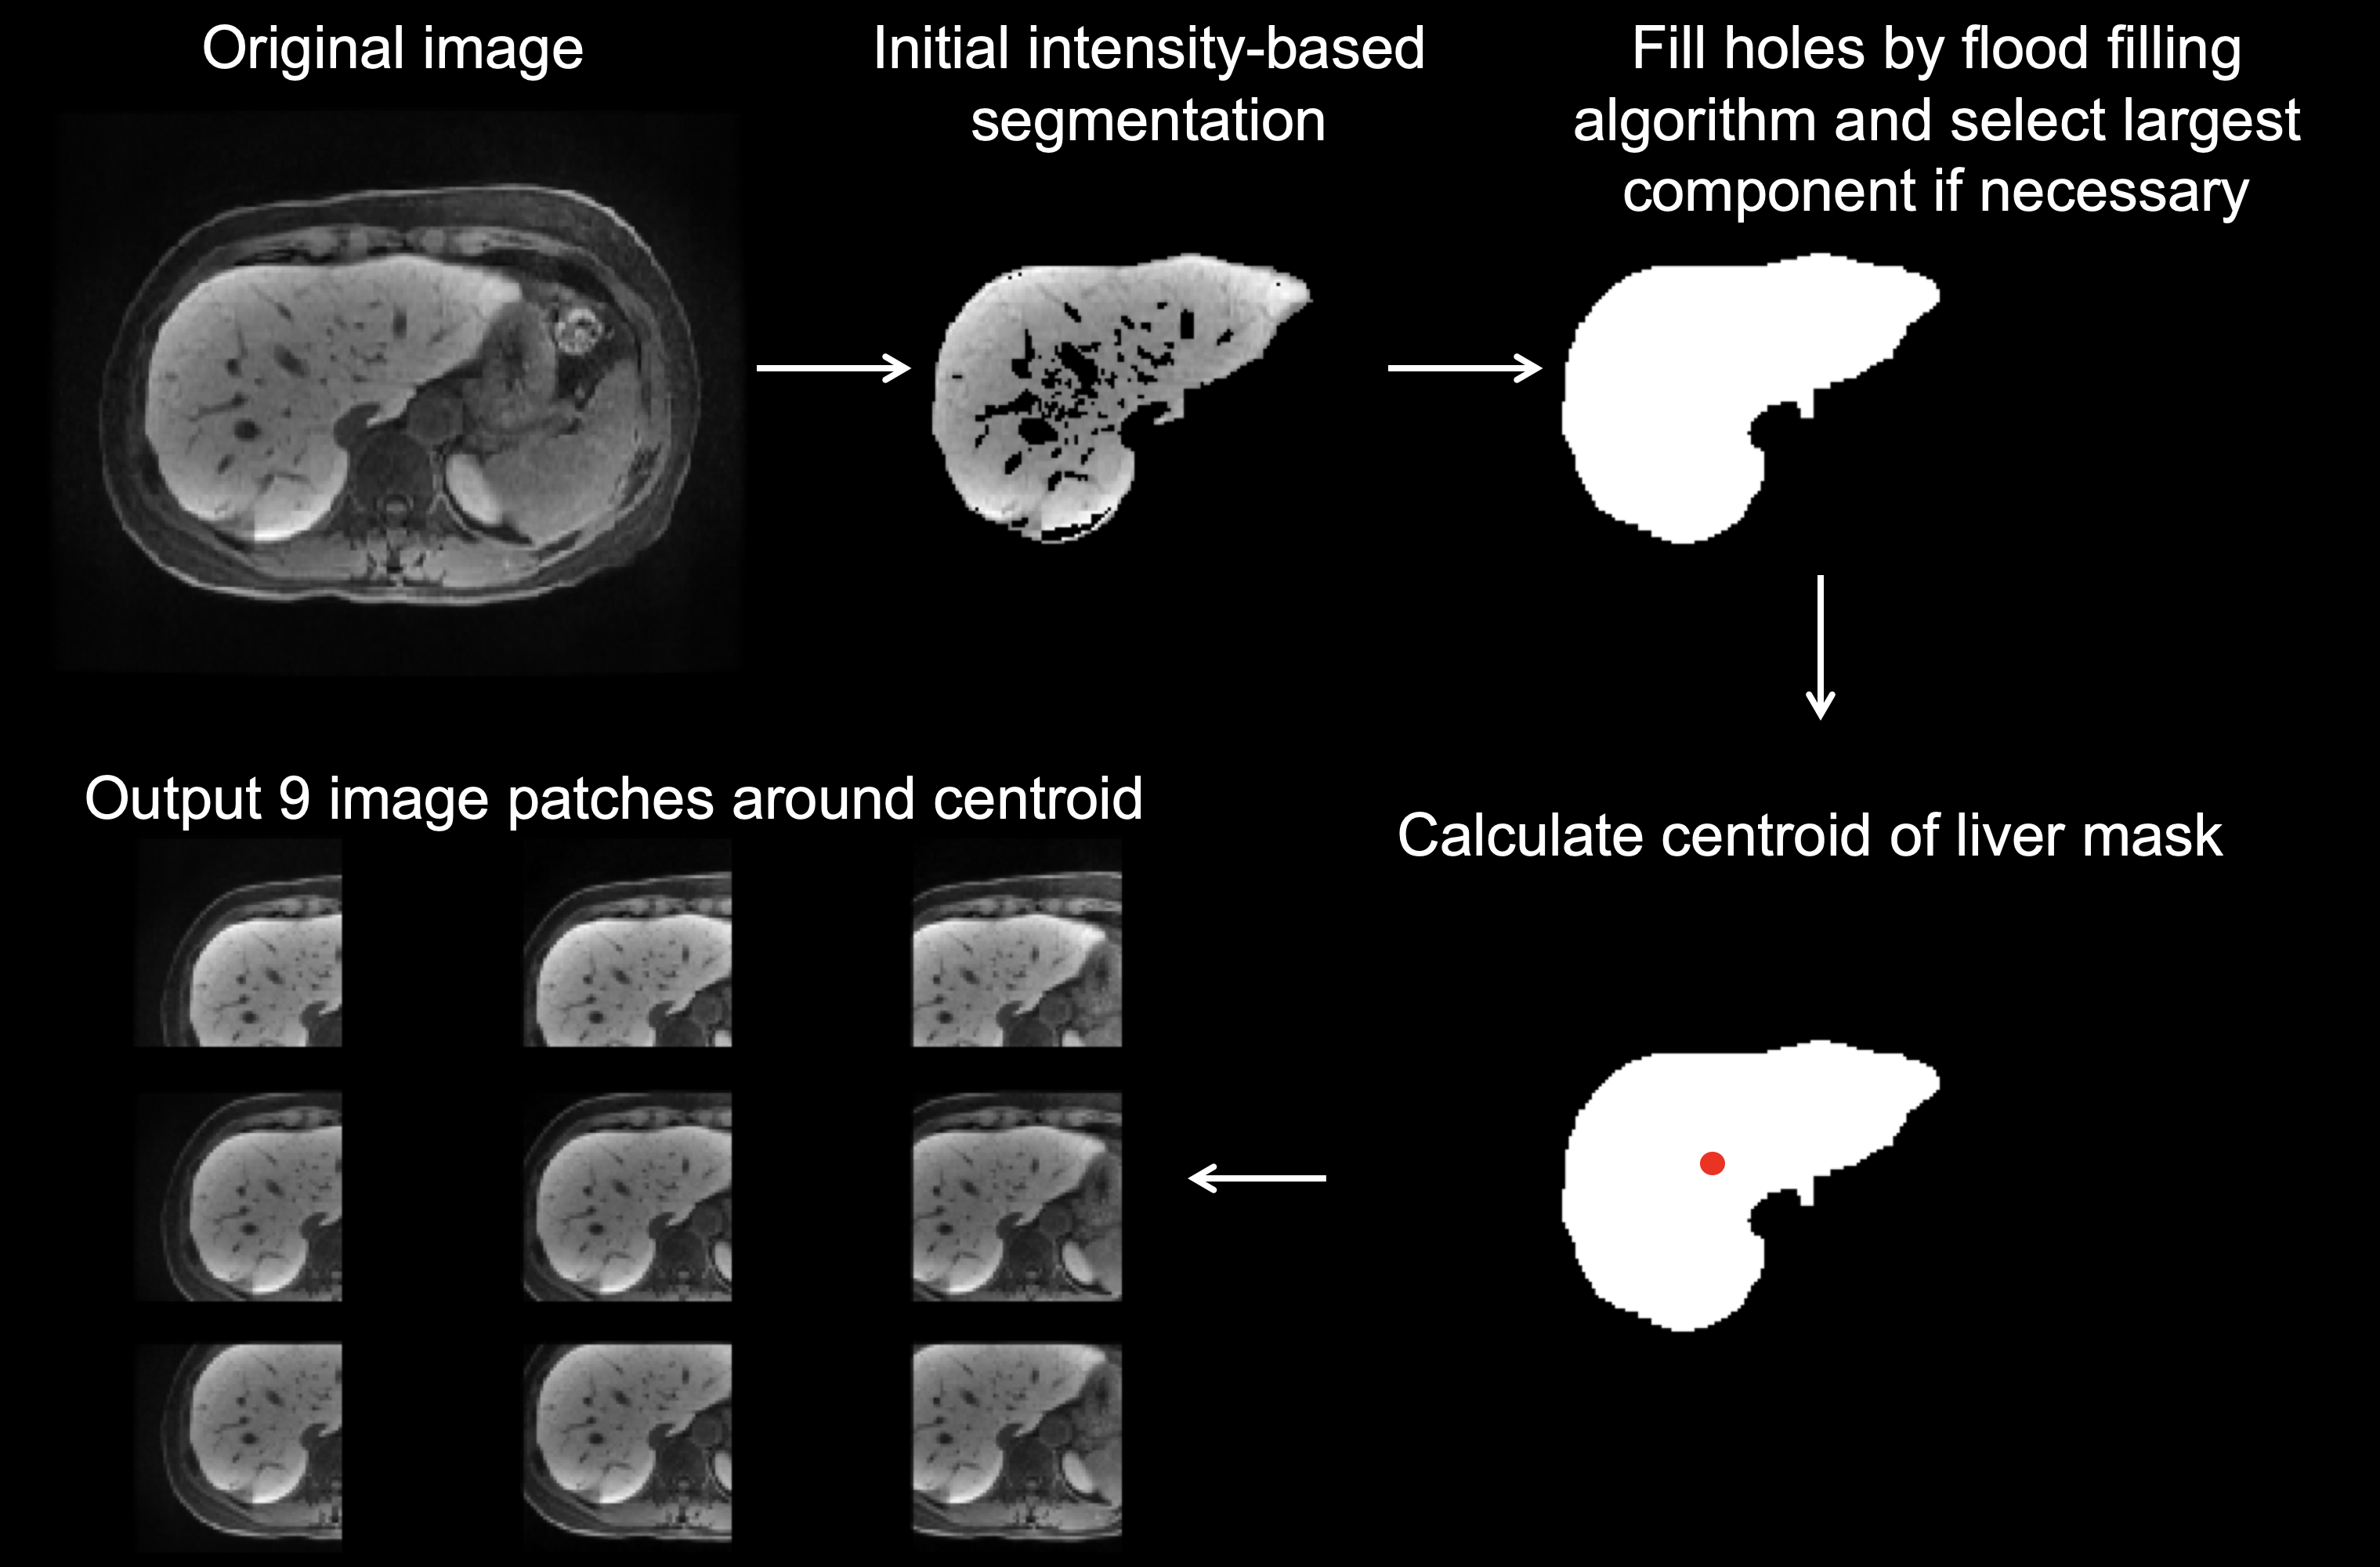
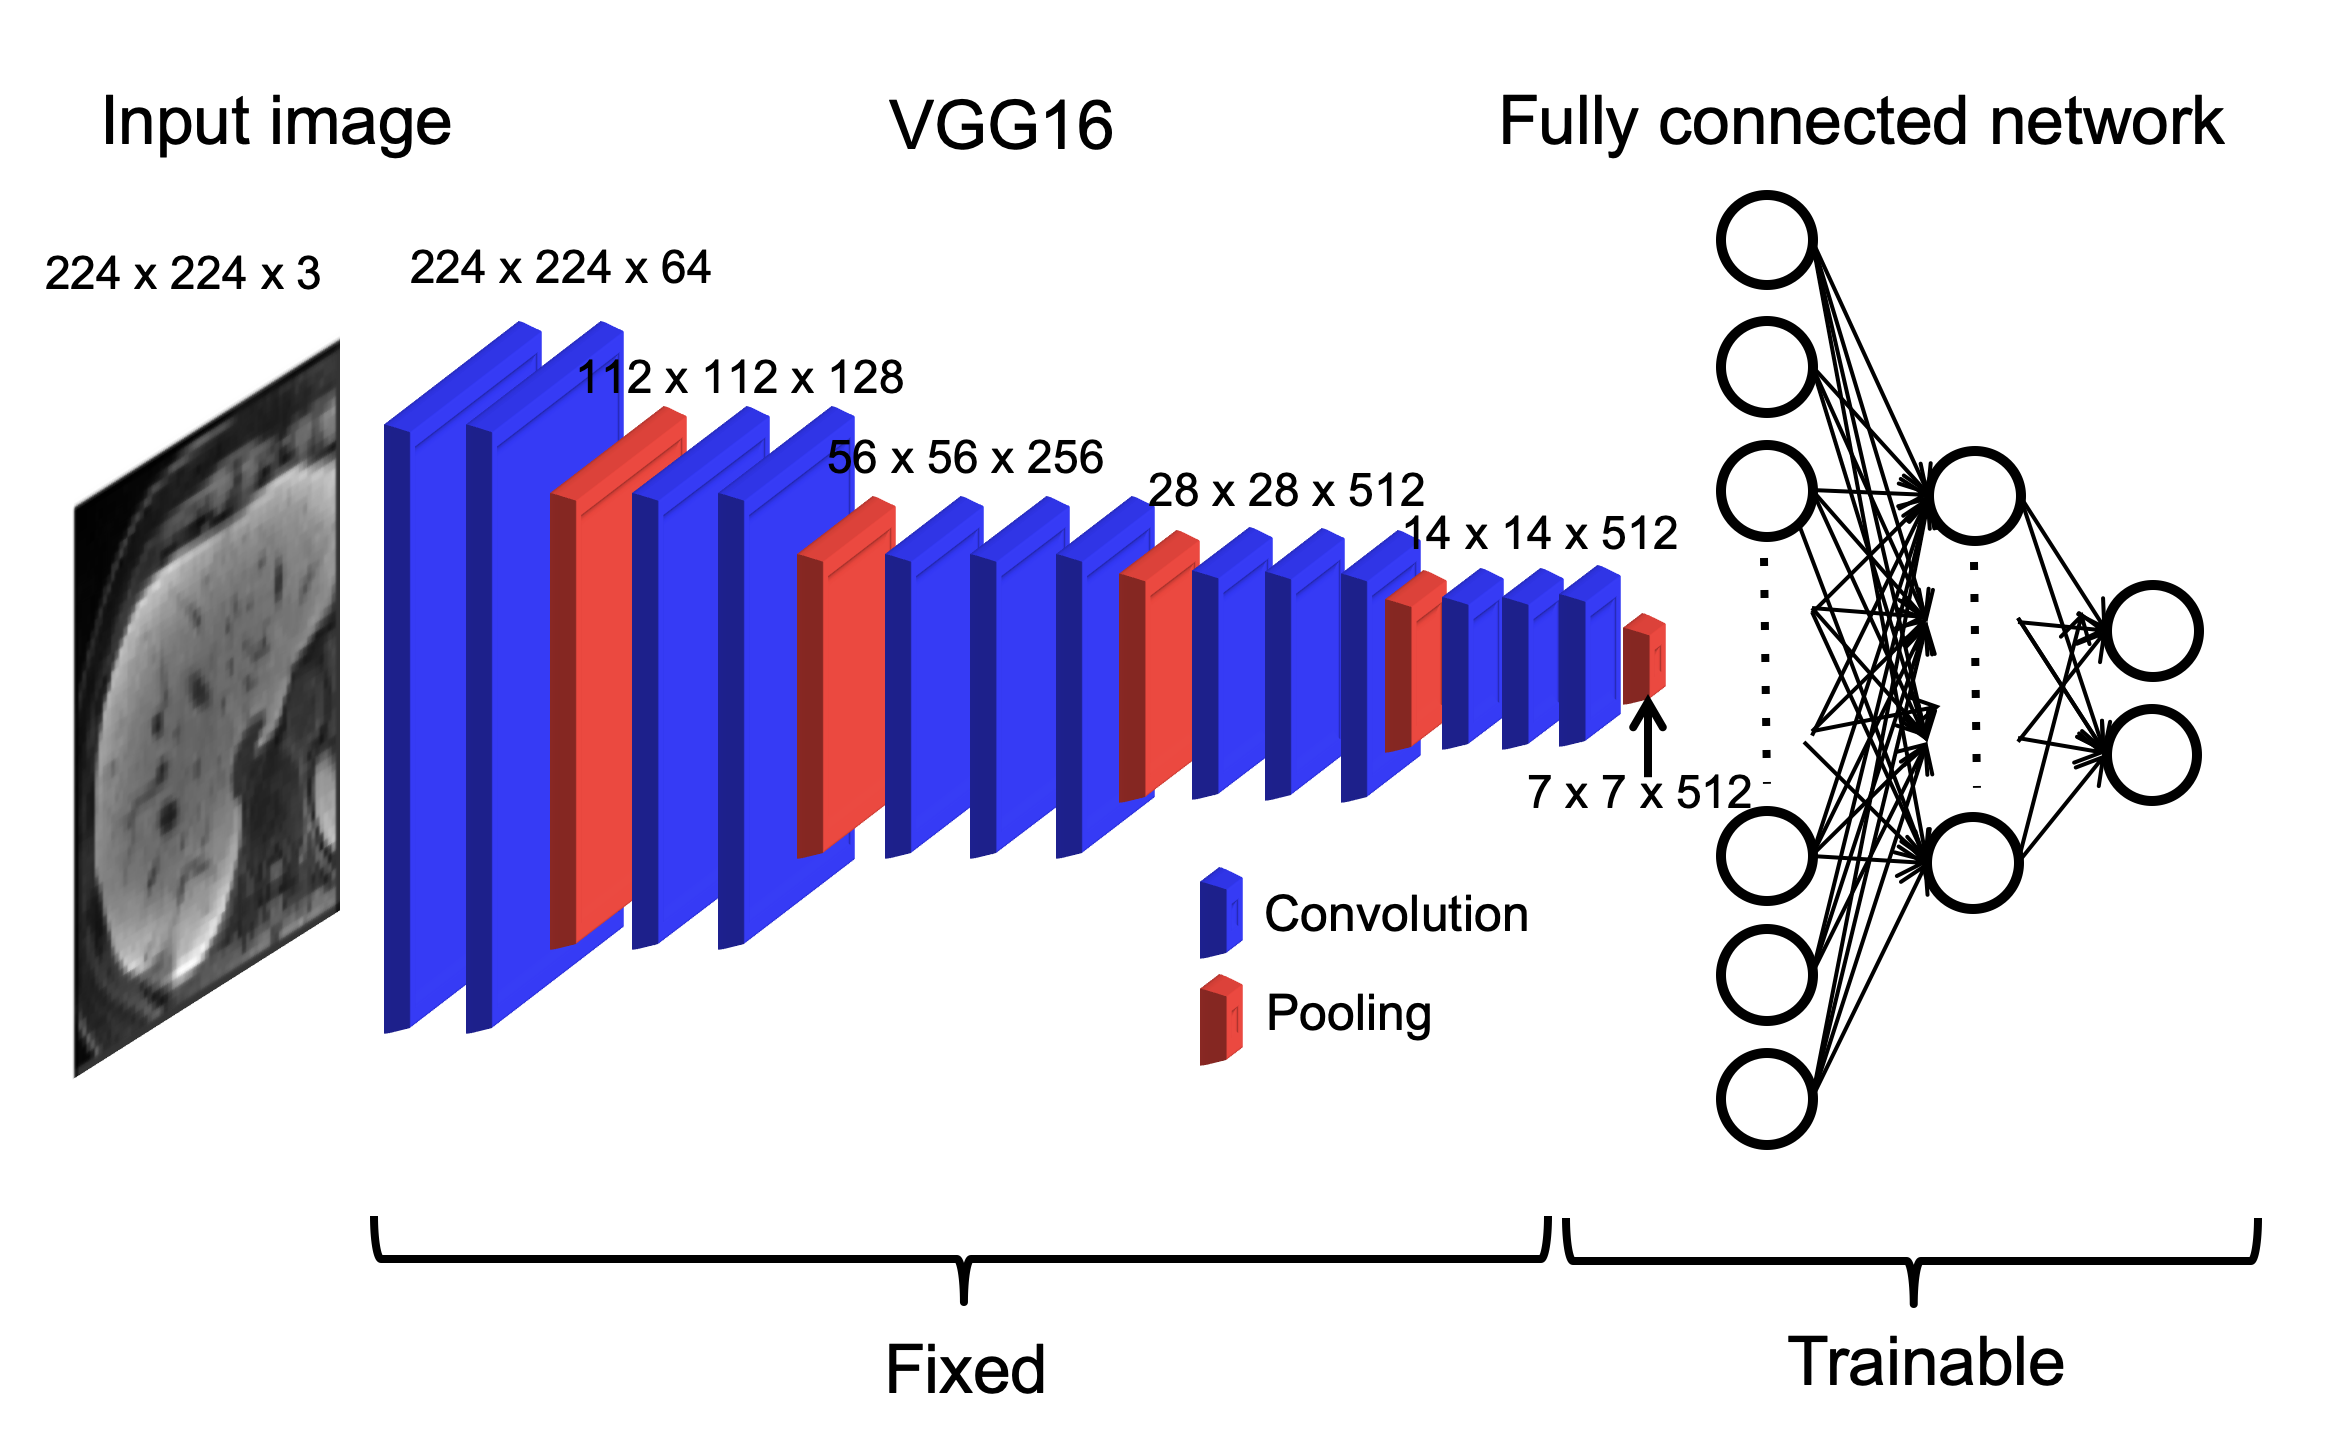
This single-center retrospective study included 355 patients (M/F 238/117, mean age 60 years; training set, n=178; validation set, n=123; test set, n=54) who underwent abdominal MRI, including HBP MRI and MRE, and pathological evaluation of the liver within 1 year of MRI between July 2013 and June 2019. The fully automated preprocessing consisted of selection of mid-liver slices and liver segmentation. For slice selection, the average signal intensity of each slice was calculated and the slice with the highest signal intensity was selected as being mid-liver. This exploits the preferential uptake of gadoxetic acid by hepatocytes (4), leading to high signal intensity in the liver compared to surrounding tissue. For data augmentation, multiple slices (range 1-18 slices/patient) around and including the selected slice were selected for further processing. The number of slices selected per patient varied based on the fibrosis stage of the patient to account for imbalance in fibrosis stages in our cohort. Signal intensity was normalized to range between 0 and 1 and images were resized to a fixed input size of 256x256. Cropped liver HBP images from a custom-written fully-automated liver segmentation, which was performed on the selected images, were used as input for DL. An example of liver segmentation is shown in Figure 1. For DL, a transfer learning approach was used based on the ImageNet VGG16 model. An overview of the model is shown in Figure 2. Different DL models were built for prediction of fibrosis stages F1-4, F2-4, F3-4 and F4. MRE liver stiffness was measured in the test cohort. ROC analysis was performed to evaluate performance of DL in training, validation and test sets and of MRE liver stiffness and combined DL + MRE (from logistic regression) in the test set.Results
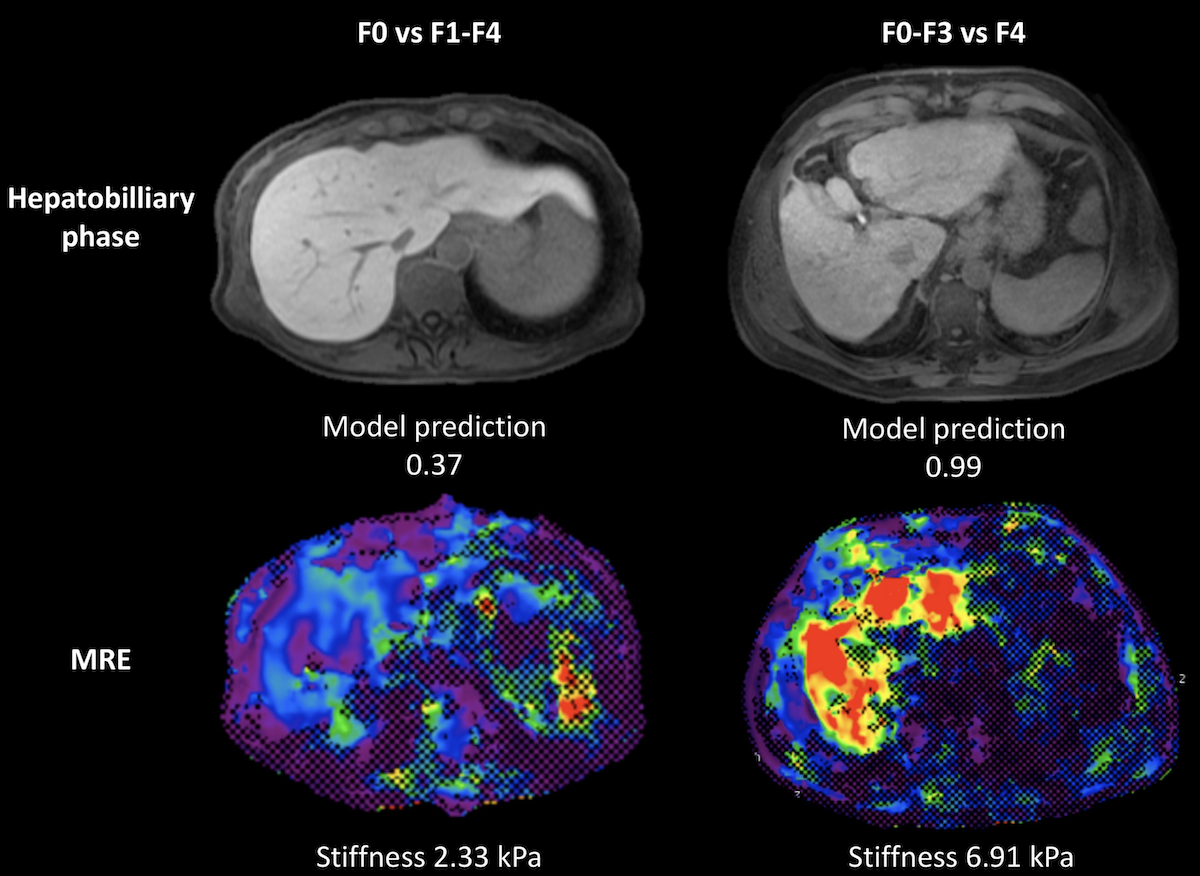
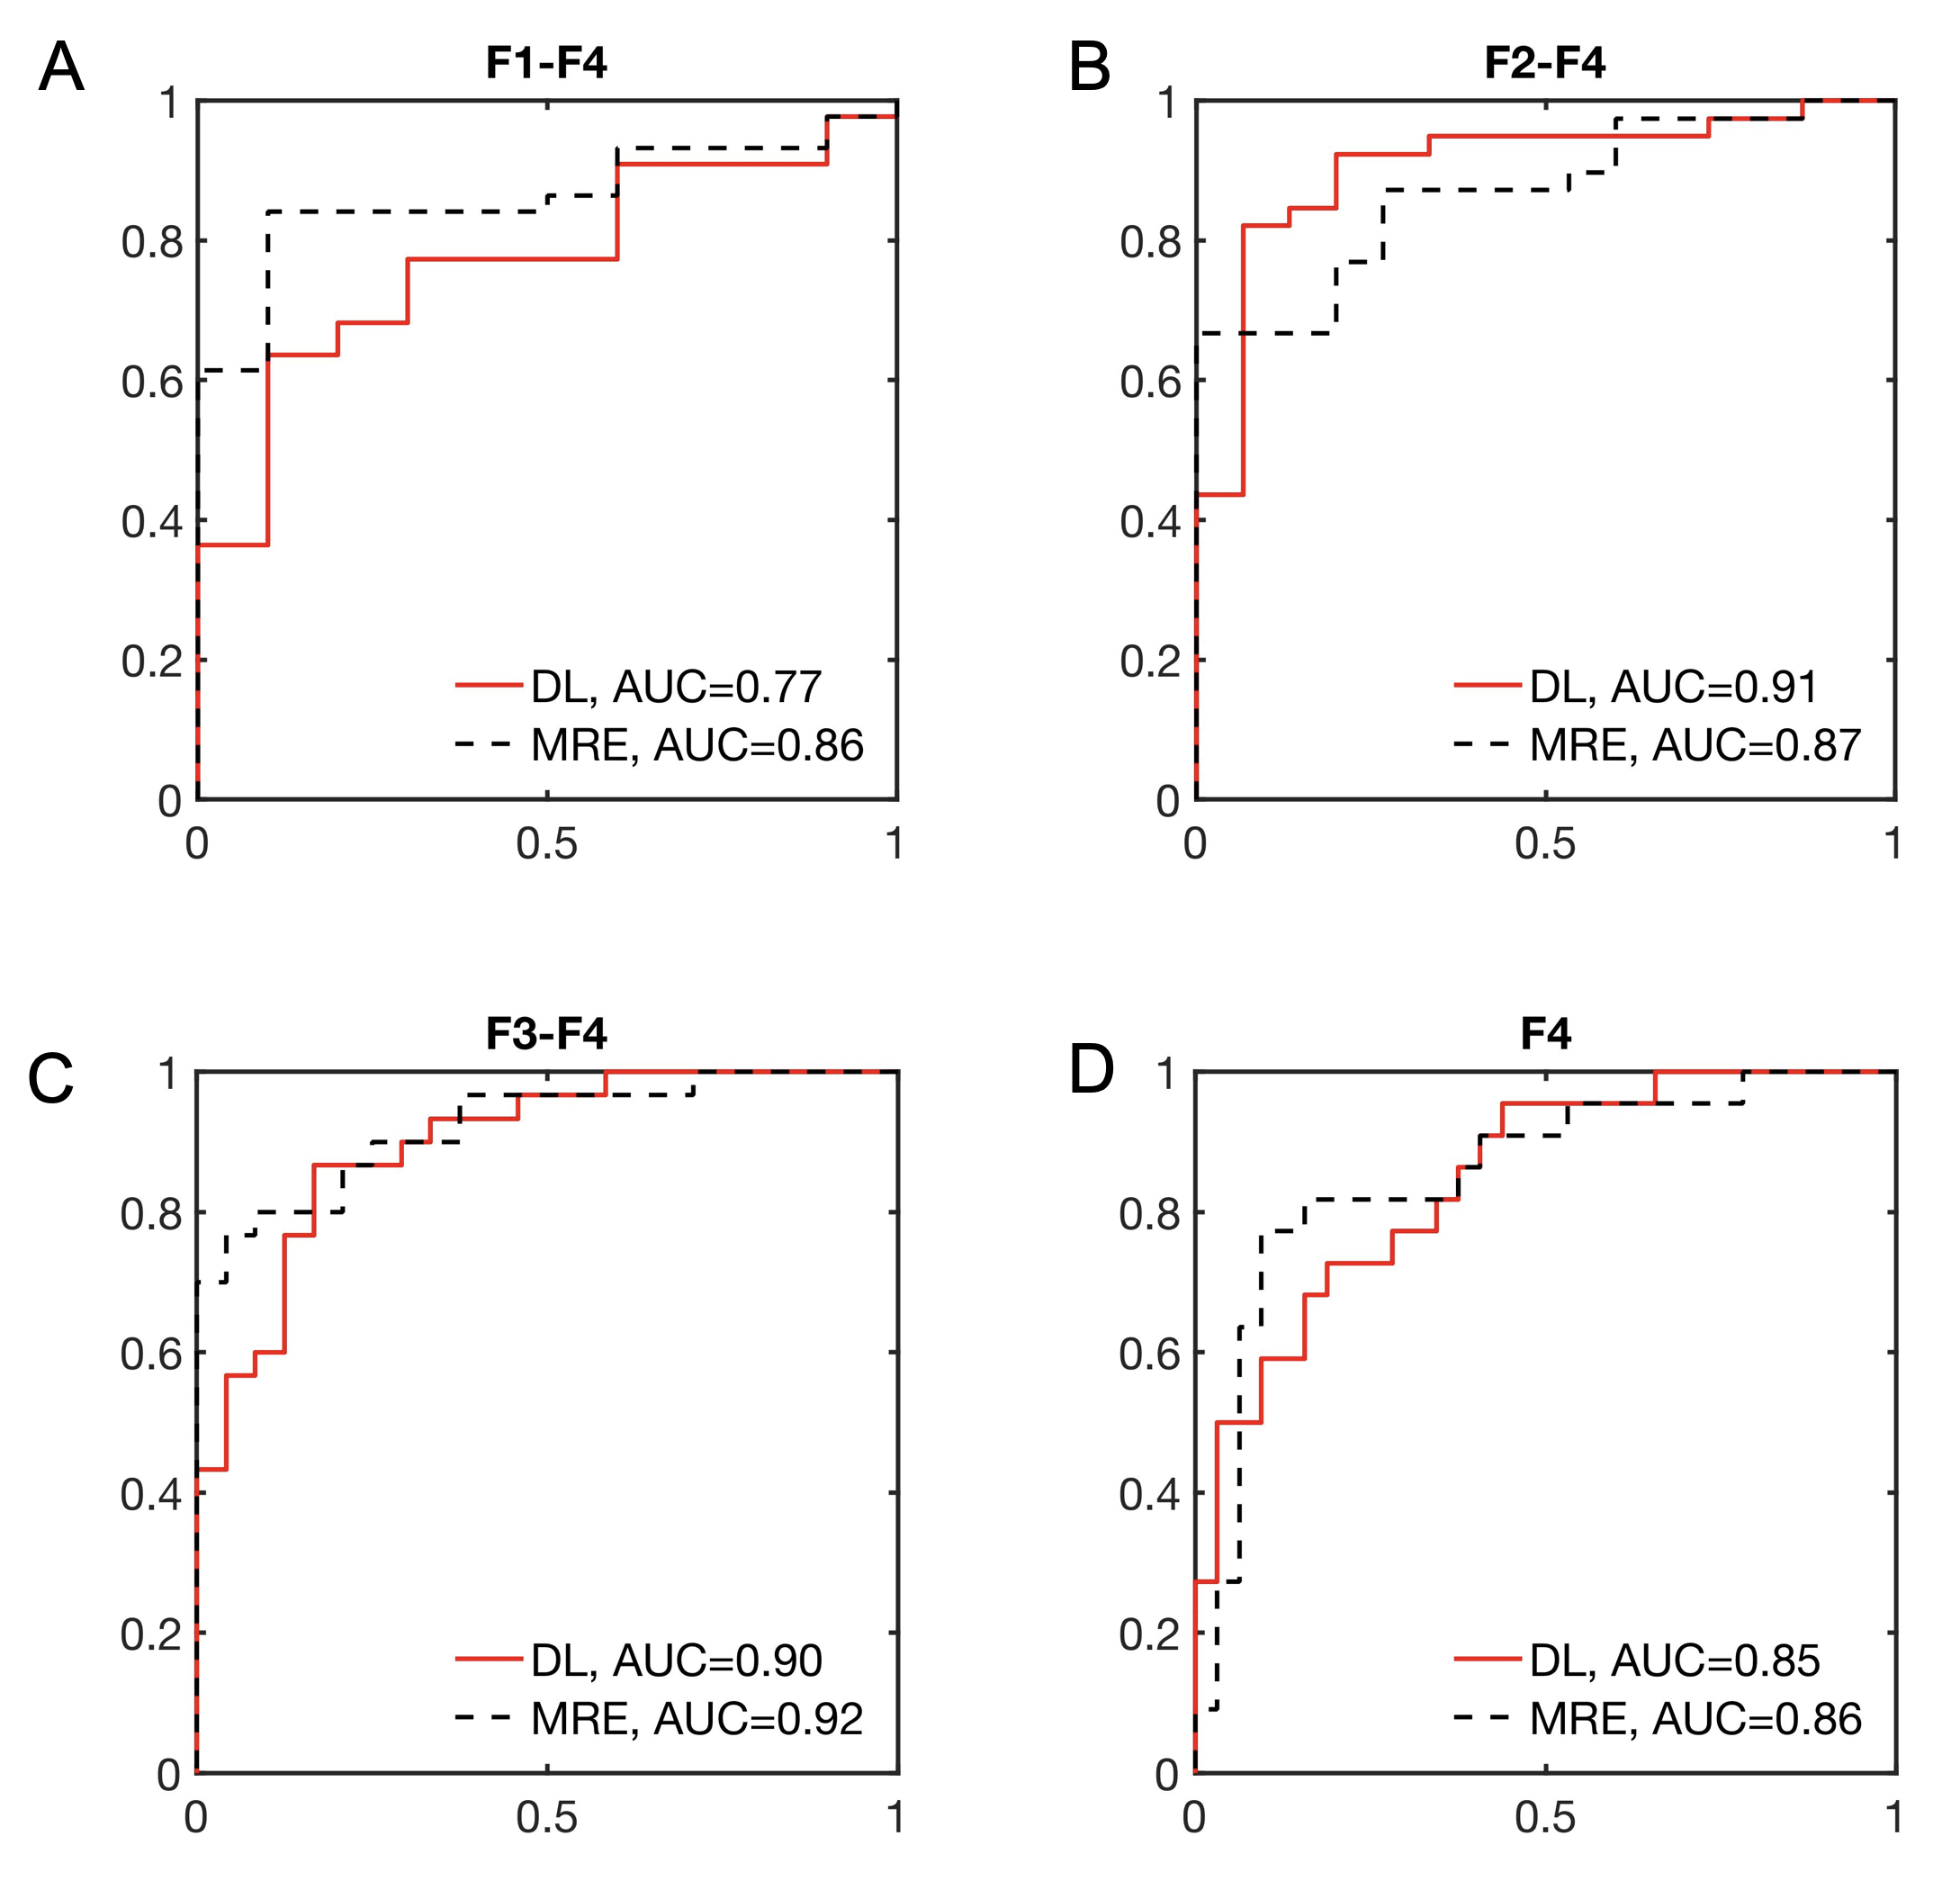
Fibrosis stages were as follows: F0, n=48; F1, n=25; F2, n=44; F3, n=49; F4, n=189. Representative MRE stiffness maps and HBP images are shown in Figure 3. AUC values of DL were 0.99/0.70/0.77 (F1-4), 0.92/0.71/0.91 (F2-4), 0.91/0.78/0.90 (F3-4), 0.98/0.83/0.85 (F4) for training/validation/test sets, respectively. The AUC of MRE liver stiffness in the test set were 0.86 (F1-4), 0.87 (F2-4), 0.92 (F3-4) and 0.86 (F4). AUCs of MRE and DL were not significantly different for prediction of any of the fibrosis stages in the test set (P>0.134). ROC curves of DL and MRE for prediction of fibrosis stages in the test set are shown in Figure 4. Combined DL + MRE showed significant improvement of diagnostic performance in the test set for prediction of F3-4 (AUC 0.95, P=0.046) compared to DL alone, but not for the other fibrosis stages. The combination also did not perform better compared to MRE alone (P>0.094).Discussion
We found excellent performance of the DL algorithm for prediction of fibrosis severity and found that it had equivalent performance to MRE in a separate test set. We did not see substantial improvement of combined DL and MRE compared to both modalities alone, indicating that DL may potentially have utility as alternative to MRE for assessment of liver fibrosis, but does not seem to be complementary to MRE. The DL pipeline may have several advantages compared to MRE for liver fibrosis evaluation. The algorithm uses standard-of-care contrast-enhanced MRI images, without the need for additional MRI acquisition or hardware. In addition, the evaluation is fully automated, while MRE needs ROI placement by a reader for stiffness evaluation, although there are efforts to automate liver stiffness assessment (5). Our study confirms the potential utility of DL of gadoxetic acid-enhanced MRI data from a previous study (6). Our study differed from the previous study in that we developed a fully automated algorithm without the need of manual liver segmentation, we utilized a powerful transfer learning approach to mitigate the typical relatively low sample size in medical imaging AI studies and we performed a quantitative comparison of diagnostic performance with MRE.Conclusion
The fully automated DL models based on HBP MRI showed good-to-excellent diagnostic performance for staging of liver fibrosis, which was equivalent to the diagnostic performance of MRE. After validation in independent sets, this algorithm may potentially allow for noninvasive liver fibrosis assessment, without the need for invasive biopsies.Acknowledgements
No acknowledgement found.References
1. Schuppan D, Ashfaq-Khan M, Yang AT, Kim YO. Liver fibrosis: Direct antifibrotic agents and targeted therapies. Matrix Biol 2018;68-69:435-451.
2. Regev A, Berho M, Jeffers LJ, Milikowski C, Molina EG, Pyrsopoulos NT, Feng ZZ, Reddy KR, Schiff ER. Sampling error and intraobserver variation in liver biopsy in patients with chronic HCV infection. Am J Gastroenterol 2002;97(10):2614-2618.
3. Kennedy P, Wagner M, Castera L, Hong CW, Johnson CL, Sirlin CB, Taouli B. Quantitative Elastography Methods in Liver Disease: Current Evidence and Future Directions. Radiology 2018;286(3):738-763.
4. Nassif A, Jia J, Keiser M, Oswald S, Modess C, Nagel S, Weitschies W, Hosten N, Siegmund W, Kuhn JP. Visualization of hepatic uptake transporter function in healthy subjects by using gadoxetic acid-enhanced MR imaging. Radiology 2012;264(3):741-750.
5. Dzyubak B, Venkatesh SK, Manduca A, Glaser KJ, Ehman RL. Automated liver elasticity calculation for MR elastography. J Magn Reson Imaging 2016;43(5):1055-1063.
6. Yasaka K, Akai H, Kunimatsu A, Abe O, Kiryu S. Liver Fibrosis: Deep Convolutional Neural Network for Staging by Using Gadoxetic Acid-enhanced Hepatobiliary Phase MR Images. Radiology 2018;287(1):146-155.
Figures