0296
Free lunch may not exist, but free contrast does: Calculation of Susceptibility weighted Images from data acquired for Phase Contrast Angiography1Philips Healthcare, Bengaluru, India, 2Indian Institute of Technology, Madras, Chennai, India, 3National Institute for Mental Health and Neuroscience, Bengaluru, India
Synopsis
In Phase contrast Angiography (PCA), the flow is encoded as additional phase onto the background phase typically using a Fast field echo (FFE) based pulse sequence. This flow dependent phase is then extracted and is used in further downstream processing. The background phase is typically discarded. In this work, this background phase is processed to obtain Susceptibility weighted Imaging (SWI) contrast. Our preliminary results indicate that the additional SWI contrast (PCA-SWI) images can potentially provide clinically significant information like hemorrhage, calcification and thrombus etc. and are similar to the results obtained from conventional SWI images.
INTRODUCTION
Susceptibility weighted imaging (SWI1) and phase contrast angiography (PCA2) are MR imaging techniques where the image contrasts are primarily based on the magnetic susceptibility of the tissue and the blood flow respectively. Both of these imaging techniques are phase based techniques, are used commonly in the field, are available from all the major vendors and provide independent yet complementary contrasts useful for the assessment of different clinical disease processes. With PCA, the flow is encoded as additional phase onto the background phase typically using a Fast field echo (FFE) based pulse sequence. This flow dependent phase is then extracted from the background phase and is used in further downstream processing for the calculation of parameters related to blood flow. The background phase which is typically discarded is rich in information related to tissue magnetic susceptibility. In this work, we explored the feasibility of calculating SWI contrast from this background phase and compared them to images obtained from independently obtained conventional SWI scans.METHODS
Theory:Velocity/flow encoding can be done for blood either in one, two or three orthogonal directions and at least n+1 datasets are needed for encoding velocity in n directions. In a typical PCA scan, velocity encoding is done in the three orthogonal directions with four different signals typically acquired with the following encodings:
$$S_1 = S_0.e^{i{\frac{γGτ^2(-V_x-V_y-V_z)}{2}+\phi_b}}$$
$$S_2 = S_0.e^{i{\frac{γGτ^2(-V_x+V_y+V_z)}{2}+\phi_b}}$$
$$S_3 = S_0.e^{i{\frac{γGτ^2(+V_x-V_y+V_z)}{2}+\phi_b}}$$
$$S_4 = S_0.e^{i{\frac{γGτ^2(+V_x+V_y-V_z)}{2}+\phi_b}}$$
Where Sn is the obtain signal, S0 is the magnitude signal , Vx,Vy,Vz are the velocities of blood along x, y and z directions respectively, G is the amplitude of the bipolar gradient used for velocity encoding, τ is the duration of one lobe of the bipolar velocity encoding gradient, γ is the gyromagnetic ratio in units of Hertz/Tesla and φb is the background field. With our approach, the signal of interest is the background signal (S0,φb ), which can be calculated as
$$|S_{swi}|=\frac{|S_1|+|S_2|+|S_3|+|S_4|}{4};$$
$$\angle S_{pca,swi}=\angle (\frac{S_1.S_2.S_3.S_4}{4}) = \phi_b$$
Using $$$|S_{swi}|$$$ and $$$\angle S_{pca,swi}$$$ , susceptibility weighted contrast images can be calculated as indicated in 3 and the images thus obtained are referred to as PCA-SWI images.
MR Imaging parameters:
All the subjects had provided informed written consent. For the clinical data, there was no change in the clinical workflow and data acquisition; The subjects underwent PCA and SWI scans as part of their clinically indicated exams and the raw data collected was processed with the proposed approach. The imaging parameters are all listed in the Table 1.
RESULTS
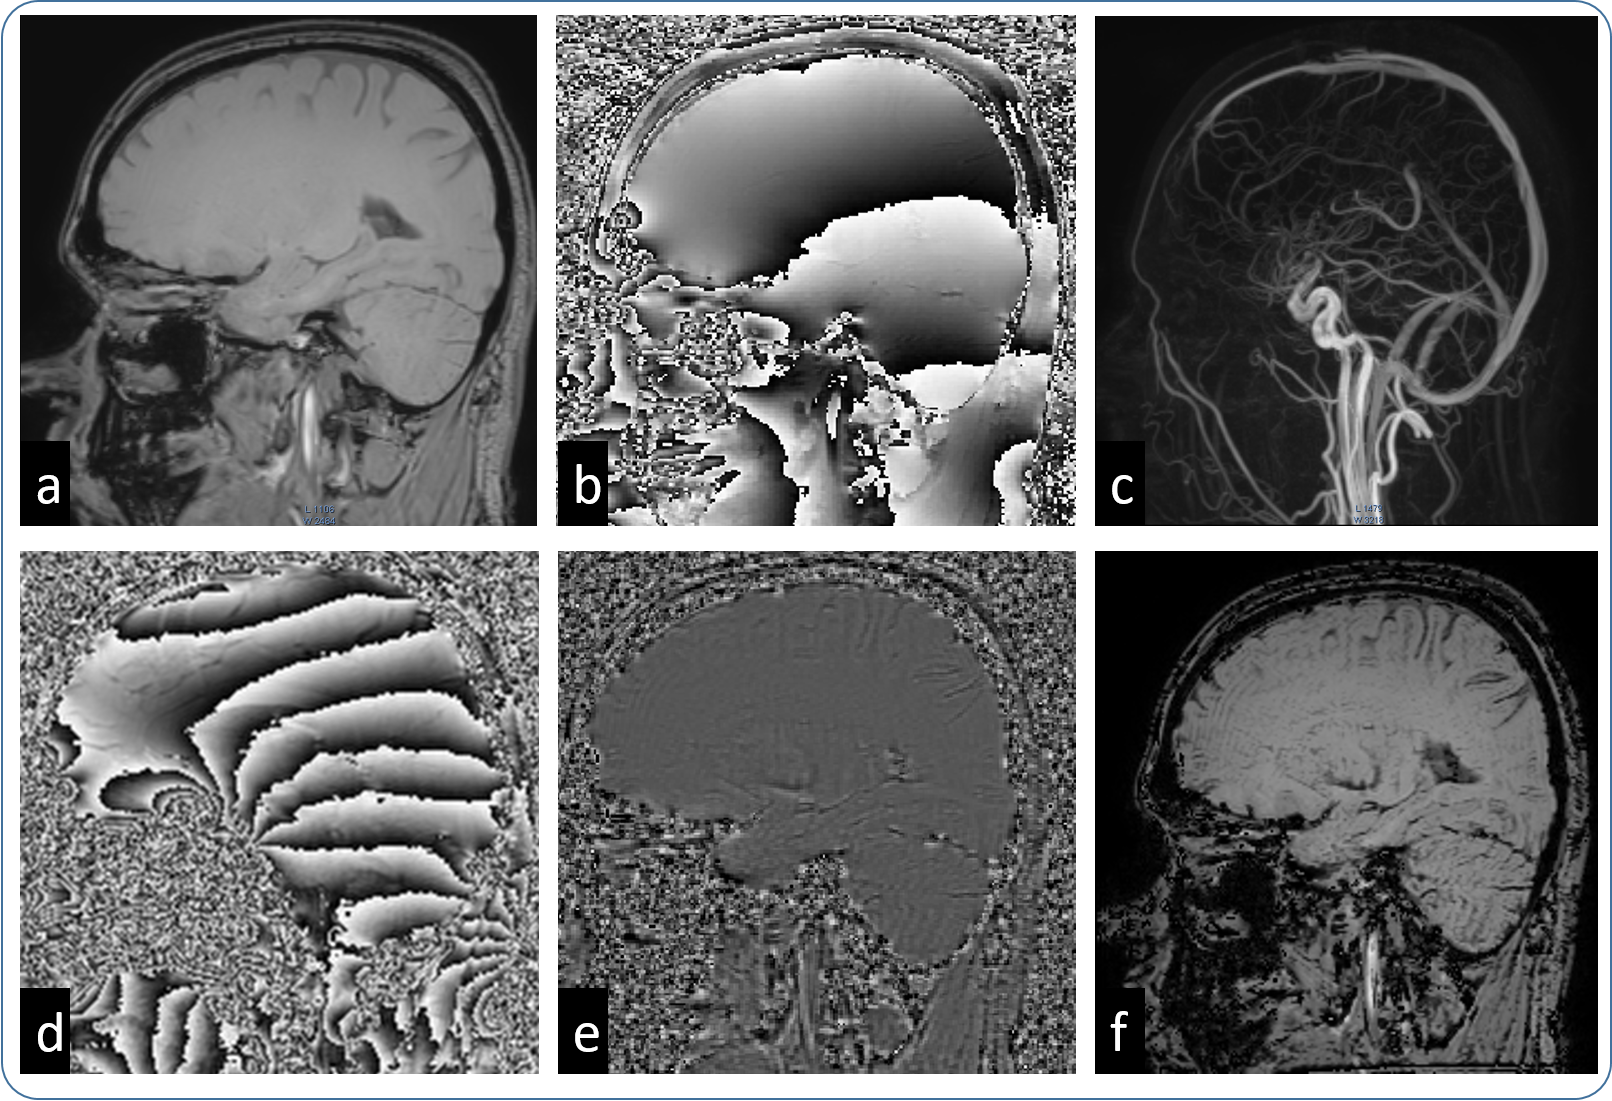
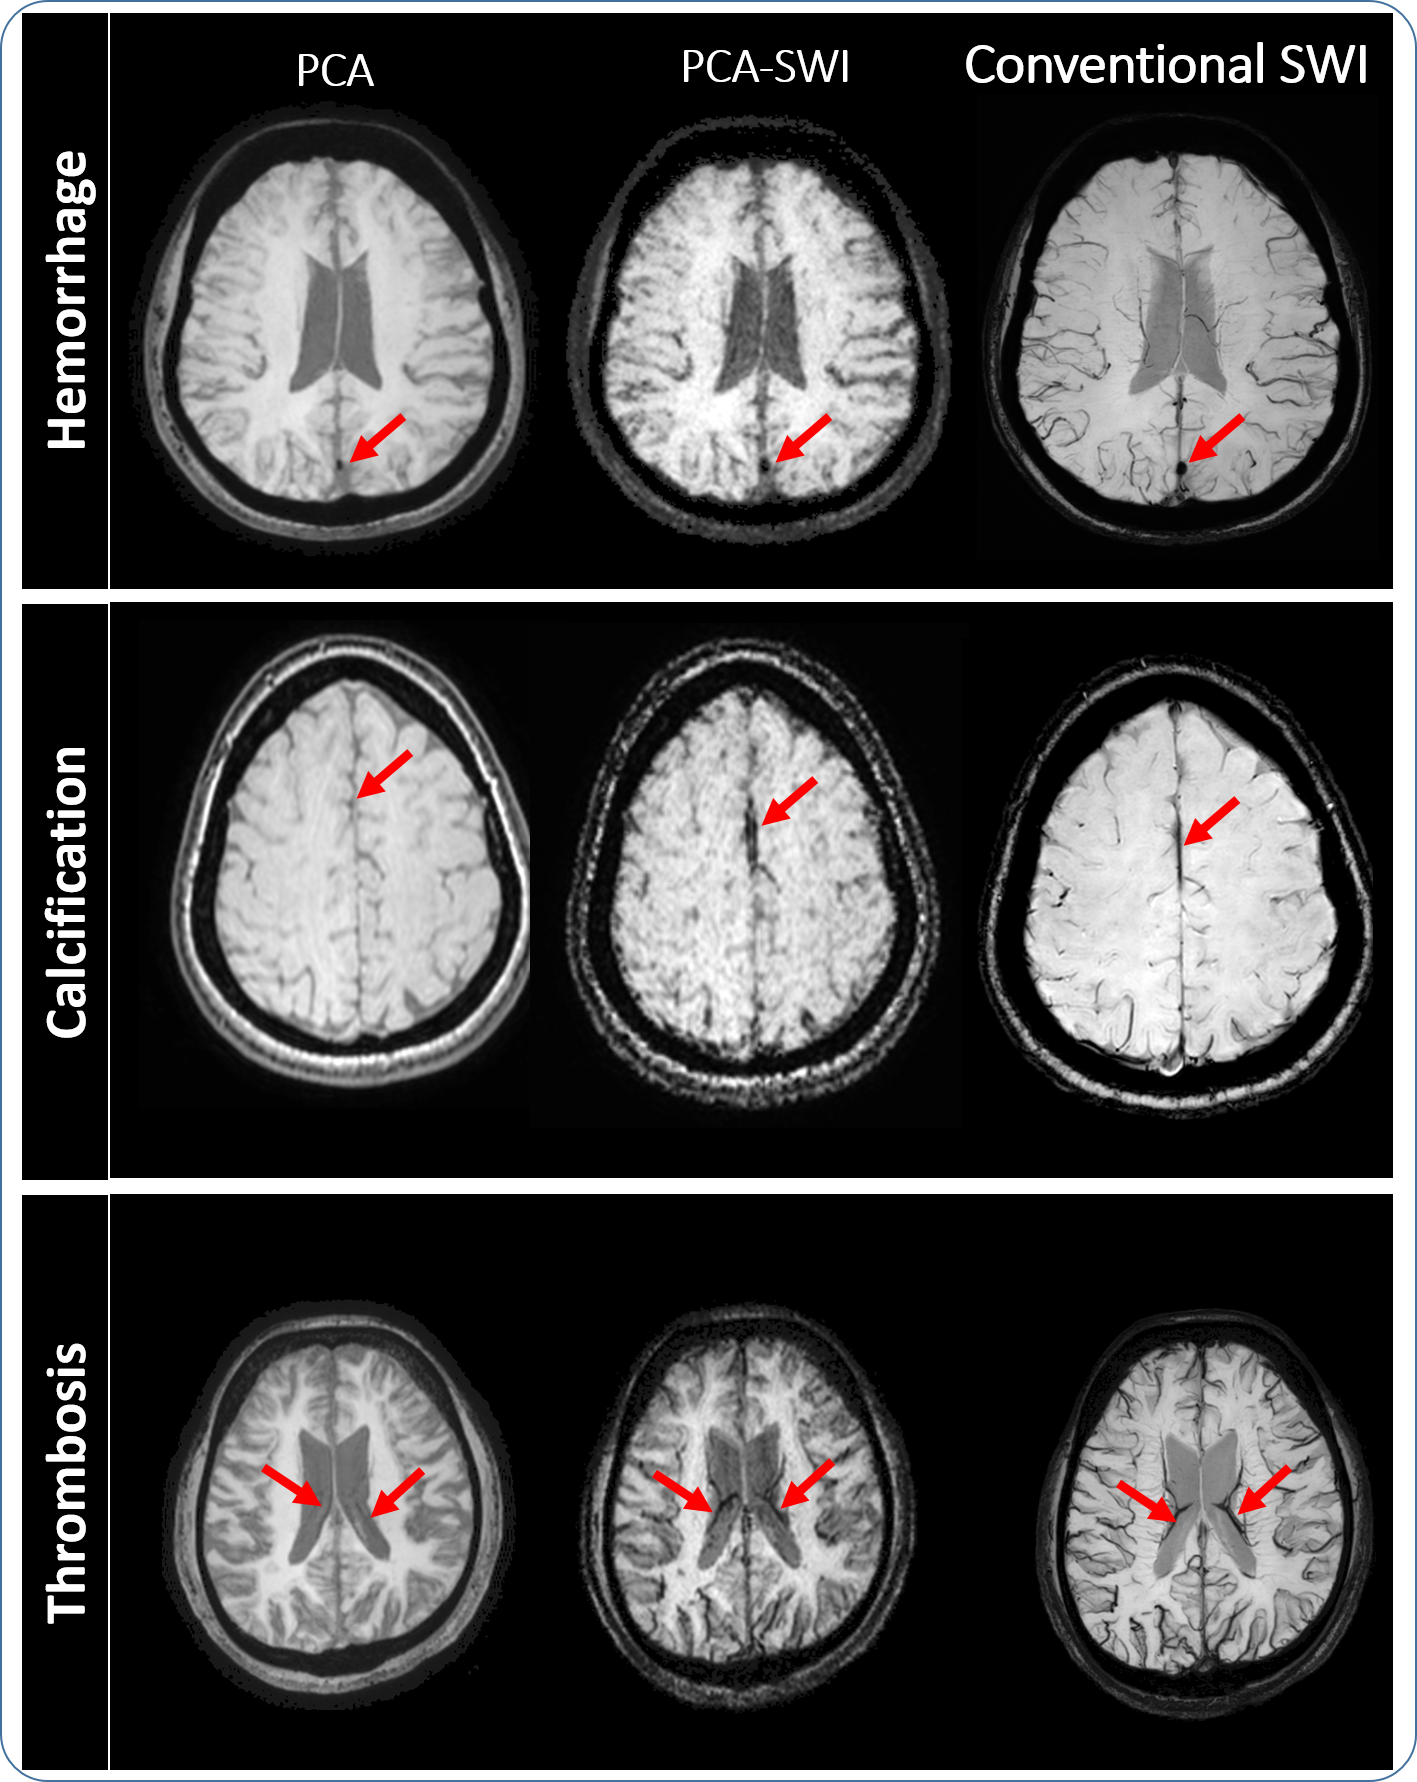
Figure 1 shows an example from a healthy volunteer where it can be seen that there is an improvement in tissue contrast compared to the data without SWI masking. Figure 2 shows example data from the clinical case studies with hemorrhage, calcification and thrombosis, indicating higher contrast from the PCA-SWI images compared to the original PCA magnitude images. From the conventional SWI images shown in the figure, it can be seen that PCA-SWI provides information similar to the conventional SWI imagesDISCUSSION
From the results presented in this abstract, it can be seen that SWI contrast can be obtained from Phase contrast Angiography(similar to 4 where SWI contrast was calculated from MR Elastography), which provides higher contrast in the brain and could visualize artefacts like hemorrhage, calcification etc. The preliminary results indicate that the SWI images obtained from PCA data provide contrast similar to the conventional SWI images, albeit with amplified noise. The noise amplification is due to the parameter combinations non-optimal for SWI contrast, like the single, short TE and the combination of 4 signals. However, it should be noted here that there is no change in data acquisition; we are obtaining the SWI contrast completely “free” adding significant value.The primary benefit of this approach would be in applications where both PCA and SWI contrasts are currently obtained, where the additional SWI scan can be avoided. In cases where the noise amplification hinders diagnosis, this approach can be used as a quick check to decide whether an independent, high resolution SWI is necessary or not. As SWI images are obtained from PCA data, these images are naturally co-registered, enabling multi-parametric analysis without any additional post-processing. A potential benefit would be to obtain clinically significant SWI contrast from all the applications where PCA is used, potentially extending the applicability of SWI, for example in cardiac Thalassemia, peripheral vascular calcification etc.
CONCLUSION
The results presented in this work provides initial evidence that clinically significant SWI contrast can be obtained from data obtained for PCA. The promising results provide motivation for further research to improve the image quality of PCA-SWI images, to test this approach in a large patient cohort and in other applications like cardiac Thalassemia.Acknowledgements
No acknowledgement found.References
1. Haacke, E. M., Xu, Y., Cheng, Y.-C. N. & Reichenbach, J. R. Susceptibility weighted imaging (SWI). Magn. Reson. Med. 52, 612–618 (2004).
2. Dumoulin, C. L., Souza, S. P., Walker, M. F. & Wagle, W. Three-dimensional phase contrast angiography. Magn. Reson. Med. 9, 139–149 (1989).
3. Yoneda, T. & Hiai, Y. Phase difference enhanced imaging method (PADRE), functional image creating method, phase difference enhanced imaging program, phase difference enhanced imaging apparatus, functional image creating apparatus, and magnetic resonance imaging (MRI) apparatus. (Google Patents, 2014).
4. Mariappan, Yogesh kannan, Neelavalli, J. & Makani, N. Free lunch may not exist, but free contrast does: Calculation of Susceptibility weighted Imaging contrast from data obtained for MR Elastography in ISMRM 27th Annual Meeting and Exhibition, 323 (2019).
Figures