0291
A Multiscale, Multimodality Pipeline for “Image-based” Cancer Systems Biology
Akanksha Bhargava1, Manisha Aggarwal1, and Arvind Pathak1
1Russell H. Morgan Department of Radiology and Radiological Science, Johns Hopkins University, Baltimore, MD, United States
1Russell H. Morgan Department of Radiology and Radiological Science, Johns Hopkins University, Baltimore, MD, United States
Synopsis
Preclinical imaging methods such as magnetic resonance microscopy (µMRI), micro-computed tomography (µCT) and optical techniques such as multiphoton microscopy (MPM) have been instrumental in advancing our understanding of the role of vasculature in cancer1. However, integrating vascular microenvironmental data across modalities and spatial scales for novel “image-based” cancer systems biology applications2 remains a challenge. Therefore, we developed a multimodality imaging pipeline that achieves multiscale data integration, image co-registration and results in the generation of “cancer atlases” for systems and computational biology applications.
Introduction
A critical determinant of the tumor microenvironment is its abnormal vasculature, which can be viewed as a complex biological system that ranges from the cellular to whole-tissue spatial scale2. Therefore, to elucidate its role in tumor progression, metastasis and response to therapy, one needs to develop “image-based” systems biology approaches that facilitate the integration of multiple microenvironmental factors such as blood vessels, cancer cells, extracellular matrix, white matter fiber distribution (for brain tumors) etc. across multiple spatial scales and imaging modalities (e.g. MRI, CT and optical imaging). However, differences in image contrast mechanisms, spatial resolution, sample preparation requirements and issues with image co-registration remain major hurdles to such vascular systems biology investigations3. To resolve these challenges, we developed a multiscale, multimodality pipeline for image-based cancer systems biology applications wherein data integration was achieved via a novel vascular contrast agent combination that is visible in MRI, CT and optical imaging. Moreover, we demonstrated the feasibility of integrating microvascular data with complementary image contrast mechanisms acquired using µMRI (40 µm), µCT (9 µm) and MPM (< 1 µm) in a preclinical breast cancer model. Finally, we demonstrate a prototype “cancer atlas” by combining these multiscale data with data visualization and computational approaches.Methods
First, a polymer mixture was prepared by mixing radio-opaque BriteVu® solution (BVu, Scarlet Imaging, UT) with Galbumin™-Rhodamine (GalRh, BioPAL Inc., MA) contrast agent (Fig. 1a), which is visible in µMRI and optical imaging. Two MDA-MB-231 human orthotopic breast xenograft-bearing NCr nu/nu mice were perfused transcardially (Fig. 1b) as described in4. Then, tumors were imaged on a 9.4 T MRI scanner (Bruker BioSpin) (Fig. 1c) using a 10 mm volume RF coil. T1-weighted (T1w) images were acquired using a 3D-FLASH sequence with flip angle = 30°, TE/TR = 4.2/40 ms, 4 averages, and 40 µm isotropic resolution. Diffusion tensor imaging (DTI) data were also acquired using a 3D diffusion-weighted (DW) GRASE sequence5 with TE/TR=32/800 ms, 12 echoes per excitation, 2 averages, diffusion gradient duration/separation = 2.8/10 ms, and 16 directions with b-value = 1700 s/mm2. Next, μCT was performed at 55 kVp, 145 µA, 335ms exposure time, 0.2 rotation step and 3 averages (Fig. 1d) on a high-resolution (9µm) (SkyScan 1275, Bruker) scanner. Finally, 10-50 µm frozen tissue sections were prepared for histology (Fig. 1e) and 3D optical data acquired using MPM and second harmonic generation (SHG) imaging. Fractional anisotropy (FA) and apparent diffusion coefficient (ADC) maps were computed from DW-MRI data using DTIStudio6. Vessel segmentation, image co-registration and data visualization were performed with Amira® (Thermo Fisher Scientific, MA) and ImageJ using a multiscale tubeness filter7 and a vascular landmark-based registration technique, respectively.Results
Our novel vascular contrast agent combination successfully enabled us to visualize the tumor vasculature in ex vivo µMRI (Fig. 2a-c), μCT (Fig. 2 e-f) and MPM (Fig. 2 d, g-h) images. Moreover, it enabled multicontrast and multiscale characterization of the vascular microenvironment by facilitating the integration of MRI data with complementary contrast from μCT and optical imaging (Fig. 2). This includes soft tissue contrast between the tumor and surrounding tissue from T1w-MRI (Fig. 2a), DW-MRI based 3D fractional anisotropy (FA) (Fig. 2b) and apparent diffusion coefficient (ADC) maps (Fig. 2c), collagen fiber mapping from SHG imaging (Fig. 2d, g-f) and green fluorescent protein (GFP) expression in cancer cells (Fig. 2d, g-h) from MPM. We also demonstrated the feasibility of co-registering multiscale, multimodality data for correlative analyses via the creation of an integrated “cancer atlas”. For example, our co-registered SHG vs. FA data (Fig. 3 a, c, e, g) indicated an overlap of high FA regions with those exhibiting high collagen fiber density (white contours). Similarly, co-registered GFP expression vs. ADC data (Fig. 3 b, d, f, h) indicated overlap of necrotic regions with those exhibiting elevated ADC values (pink contours).Discussion
Integrating tumor microenvironmental data across MRI, CT, and optical imaging for systems biology applications has remained challenging due to inherent differences in contrast mechanisms, spatial resolution of image acquisition, and sample preparation requirements. To the best of our knowledge, this is the first study to develop a 3D multiscale, multimodality imaging approach to simultaneously visualize vasculature and complementary contrasts using MRI, CT, and optical microscopy in a preclinical breast cancer model. Our preclinical imaging platform has several implications for “image-based” cancer systems biology applications. First, it achieves multimodality data integration via a trimodality vascular contrast agent combination. Second, it enables imaging, integration and visualization of data from the same tissue sample from the cellular to whole-tissue level using a “cancer atlas” or “Google Maps”8 format. Third, one can also integrate optical clearing methods into this pipeline to include optical imaging contrast acquired using 3D light-sheet microscopy9. Finally, one can envision combining such multiscale/multimodality imaging data with image-based computational models of blood flow and oxygenation8 to develop “functional maps” of the vasculature and its microenvironment in healthy and diseased tissue in a wide range of preclinical models and applications.Discussion
We have successfully developed a novel multiscale, multimodality pipeline and demonstrated its utility for “image-based” cancer systems biology applications. We expect this vasculature-predicated approach to enable novel systems biology applications in other preclinical disease models and healthy tissues.Acknowledgements
This work was supported by NCI 1R01CA196701, 1R21CA175784 and 5R01CA138264.References
1 McDonald, D. M. & Choyke, P. L. Imaging of angiogenesis: from microscope to clinic. Nat Med 9, 713-725, (2003). 2 Kim, E. et al. Multiscale Imaging and Computational Modeling of Blood Flow in the Tumor Vasculature. Ann Biomed Eng 40, 2425-2441, (2012). 3 Megason, S. G. & Fraser, S. E. Imaging in systems biology. Cell 130, 784-795, (2007). 4 Kim, E., Zhang, J., Hong, K., Benoit, N. E. & Pathak, A. P. Vascular phenotyping of brain tumors using magnetic resonance microscopy (muMRI). J Cereb Blood Flow Metab 31, 1623-1636, (2011). 5 Aggarwal, M., Mori, S., Shimogori, T., Blackshaw, S. & Zhang, J. Three-dimensional diffusion tensor microimaging for anatomical characterization of the mouse brain. Magn Reson Med 64, 249-261, (2010). 6 Jiang, H., van Zijl, P. C., Kim, J., Pearlson, G. D. & Mori, S. DtiStudio: resource program for diffusion tensor computation and fiber bundle tracking. Comput Methods Programs Biomed 81, 106-116, (2006). 7 Cebulla, J., Kim, E., Rhie, K., Zhang, J. & Pathak, A. P. Multiscale and multi-modality visualization of angiogenesis in a human breast cancer model. Angiogenesis 17, 695-709, (2014). 8 Stamatelos, S. K., Bhargava, A., Kim, E., Popel, A. S. & Pathak, A. P. Tumor Ensemble-Based Modeling and Visualization of Emergent Angiogenic Heterogeneity in Breast Cancer. Sci Rep-Uk 9, (2019). 9 Lagerweij, T. et al. Optical clearing and fluorescence deep-tissue imaging for 3D quantitative analysis of the brain tumor microenvironment. Angiogenesis 20, 533-546, (2017).Figures
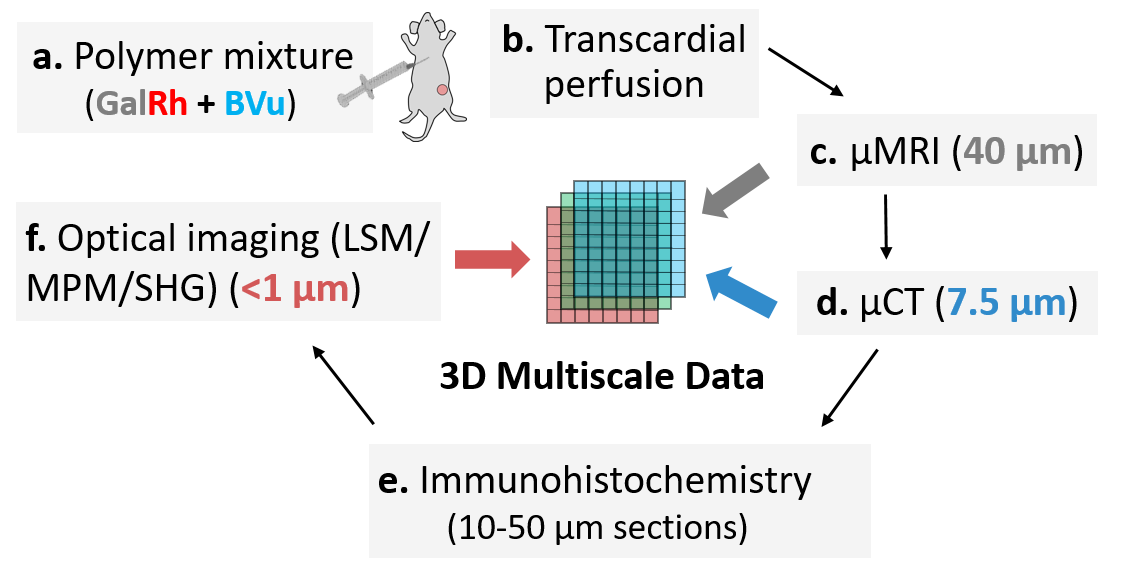
Fig. 1: Multicontrast
and multimodality 3D imaging pipeline. (a) A polymer mixture was prepared by mixing radio-opaque
BVu with MRI-and optically-visible GalRh contrast agent. Next, two MDA-MB-231 human breast
xenograft bearing mice were transcardially perfused (b). Excised tumors
were imaged on a 9.4T MRI scanner using T1- and DW-sequences at 40µm (c) from
which FA maps were computed. Then, samples were imaged using μCT at 7.5μm (d).
Nex, 10-50µm tissue sections were prepared for histology (e), and 3D optical data acquired
using MPM and second harmonic generation (SGH) imaging.
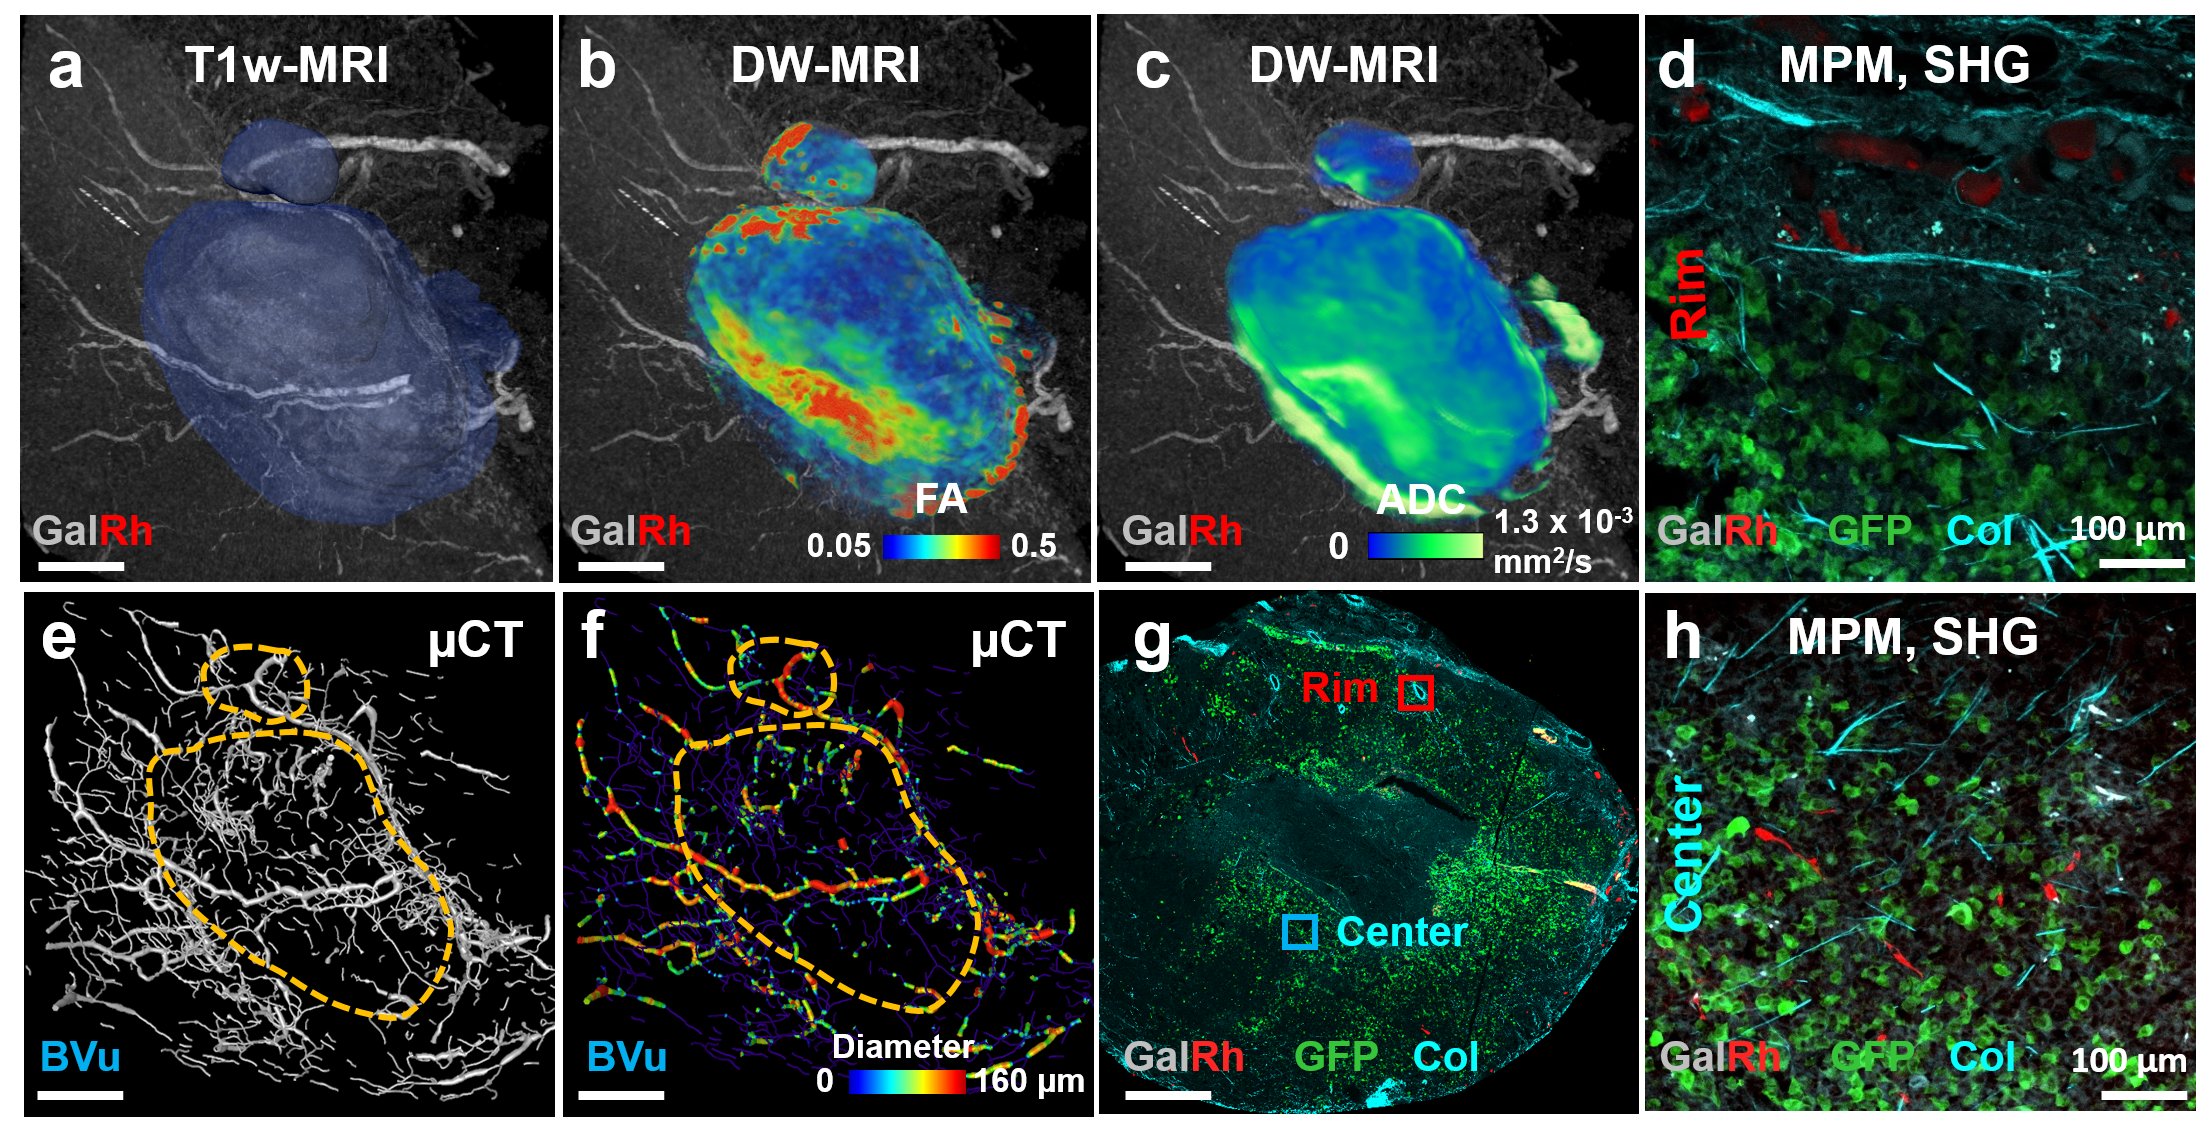
Fig. 2: Multiscale
characterization of the tumor microenvironment. T1w-MRI
enabled visualization of large (i.e. ³ 40 µm radius) vessels and
identification of tumor extent (a). DW-MRI
derived FA (b) and ADC (c) maps highlight tissue structure and
cellularity. µCT enabled tumor vascular imaging (e) and generation of “vessel radius” maps (f). With MPM, GalRh labeled tumor vessels and GFP expressing breast cancer
cells were visible, while collagen fibres
were imaged using SHG (g, h, d) . Differences in collagen density
and cellularity were visible between the tumor rim (d) and center (h).
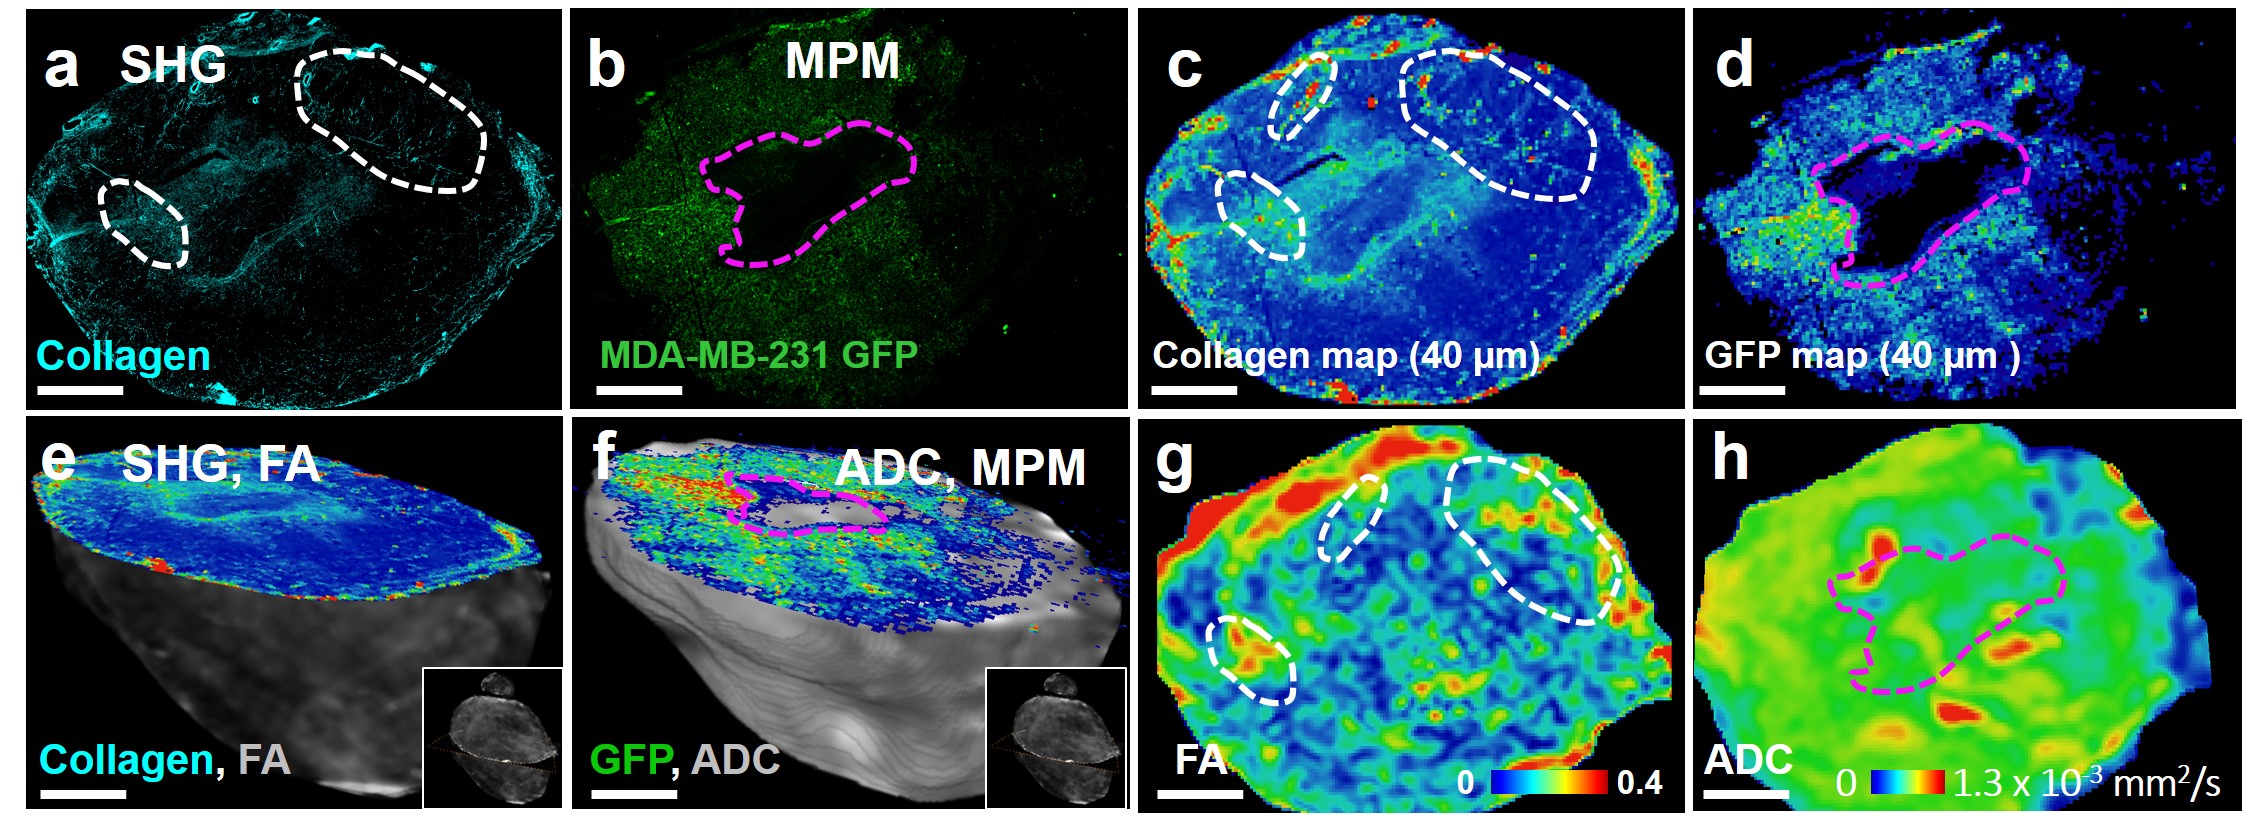
Fig. 3: Creation of a multiscale “cancer atlas”. (a)
High-resolution collagen and (b) GFP maps. Collagen (c) and GFP (d) data mapped on to a 40 µm grid for
co-registration with the 3D FA (e) and ADC (f) data. Insets
in (e, g) illustrate the histological
tissue section orientation relative to the tumor volume. MRI regions of
interest (g, h) for correlation analyses. White contours on (c,
g) delineate tumor areas where high FA values visually correlated with high
collagen fiber density. Pink contours on (d, h) indicate areas where high ADC values
correspond to regions of low cellularity (b, f).