0287
Imaging assessment of pancreatic ductal adenocarcinoma xenograft treated with hypoxia activated prodrug Evofosfamide
Shun Kishimoto1, Nallathamby Devasahayam1, Yu Saida1, Yasunori Otowa1, Kazutoshi Yamamoto1, Jeffrey R Brender1, and Murali C Krishna1
1NCI, Bethesda, MD, United States
1NCI, Bethesda, MD, United States
Synopsis
TH-302 is designed to release cytotoxic bromo-isophosphoramide (Br-IPM) moiety in hypoxic microenvironment. Therefore, this drug preferentially attacks the hypoxic region in cancer where other standard anti-cancer treatment such as chemotherapy and radiation therapy are ineffective. Here, we monitored the change in tumor hypoxia and perfusion in response to TH-302 treatment by EPR oximetry and DCE MRI using two pancreatic ductal adenocarcinoma xenograft models. The result showed improved oxygenation only in treatment sensitive MIA Paca-2 tumors without modulating tumor blood perfusion, suggesting that intratumor pO2 is a useful biomarker to evaluate treatment response to TH-302.
Purpose
Chronically hypoxic regions which are normally distant from the blood vessels are also known to show limited effectiveness of chemotherapies due to its acquired resistance to apoptosis induced by hypoxia.[1] Thus, several combination modes of Evofosfamide with chemotherapeutics such as doxorubicin, gemcitabine, bortezomib, etc have been evaluated pre-clinically and clinically.[2-4] For designing and evaluating such Evofosfamide combination therapies, it is crucial to understand the pO2 change in response to Evofosfamide in the tumor microenvironment because hypoxic fraction which is the target of Evofosfamide can be modified by the treatment itself. EPRI is one of the most reliable means of measuring pO2 available for live animal tissue among other modalities including 19F MRI, blood oxygen level dependent MRI, and photoacoustic imaging. EPRI requires the injection of non-toxic spin probe and absolute pO2 can be calculated from the linewidth of the distributed probe.[6-8] It allows the repeated measurement with minimum toxicity. By examining pO2 of each unique tumor and comparing the difference between before and after the treatment, it is feasible to obtain the detailed information of the effect of Evofosfamide treatment. In this study, to further understand the mechanism of the improved oxygenation by Evofosfamide treatment, tumor blood perfusion was examined using DCE MRI.[9, 10]Methods
MIA Paca-2 cell line and Su.86.86 cell line (human pancreatic adenocarcinoma) were used in this study. Athymic nude mice were inoculated with the cells s.c. into the right leg. For treatment, approximately 600 mm3 tumor bearing mice were injected i.v. with 50 mg/kg of Evofosfamide five days a week. Tumor bearing mice in the control group were injected with same amount of buffer. EPRI: Parallel coil resonators tuned to 300MHz were used for EPRI. OX063 (1.125mmol/kg bolus) was injected i.v. to a mouse. The free induction decay (FID) signals were collected following the radiofrequency excitation pulses (65 ns) with a nested looping of the x, y, and z gradients, and each time point in the FID underwent phase modulation, enabling 3D spatial encoding. The repetition time was 8.0 μs. The number of averages was 4000. After EPRI measurement, anatomic T2-weighted MR images were collected with a 1T scanner. DCE-MRI: DCE-MRI studies were performed on a 1 T scanner. T1-weighted fast low-angle shot (FLASH) images were obtained with TR = 156 ms; TE = 4 ms; flip angle = 45˚; four slices; 0.44 x 0.44 mm resolution; 20-second acquisition time per image; and 98 repetitions. Gd-DTPA solution (4 mL/g of body weight of 50 mmol/L Gd-DTPA) was injected 1 minute after the start of the dynamic FLASH sequence. To determine the local concentrations of Gd-DTPA, T1 maps were calculated from four sets of Rapid Imaging with Refocused Echoes (RARE) images obtained with TR = 300, 600, 1000, and 2000 ms, with the acquisitions being made before running the FLASH sequence.Results
The hypothesis of differential treatment response to Evofosfamide between MIA Paca-2 and Su.86.86 tumors was examined by evaluating the growth inhibition. Compared with the groups treated with vehicle (5% DMSO in PBS), MIA Paca-2 tumors showed a distinct growth inhibition by the treatment while Su.86.86 didn’t (Fig. 1A and Fig. 1B). The difference in tumor growth between Evofosfamide treated group and vehicle treated group was displayed as Kaplan-Meier plots (Fig. 1C and Fig. 1D) and statistically evaluated by log rank test. Tumor growth inhibition was significant only in MIA Paca-2 tumors. Intra-tumor pO2 of pre- and post- treatment with Evofosfamide. Figure 2A shows the representative images of pre-treated MIA Paca-2 tumor (top panels) and post-treated tumor (bottom panels). Although MIA Paca-2 tumor tends to exhibit the improved oxygenation, the change in pO2 between pre-treatment and post-treatment tumor showed a mixed profile (Fig. 2B, 2C). Considering the oxygen dependent activation of Evofosfamide, the treatment response in pO2 can also be dependent on pO2 prior to the treatment. In the scattered plot, only MIA Paca-2 tumors, which are Evofosfamide sensitive, showed statistically significant negative linear correlation between pre-treatment pO2 and ΔpO2 (Fig. 2D, 2F) and between pretreatment HF10 and ΔHF10 (Fig. 2E, 2G). The treatment effect of Evofosfamide on tumor perfusion was also investigated by dynamic contrast enhanced (DCE) MRI using Gd- DTPA as a contrast agent. Similar Ktrans value between pre- and post- treated tumors indicates the same level of accumulation of Gd-DTPA in the extracellular extravascular space, suggesting no significant difference in perfusion that reflects total effect of permeability of capillary and blood delivery. Figure 3A and 3B is the representative Ktrans map of pre- and post- Evofosfamide treated MIA Paca-2 tumor overlaid on anatomical images. No significant change in Ktrans was observed after Evofosfamide treatment in both MIA Paca-2 and Su.86.86 tumors (Fig. 3C, 3D).Conclusion
pO2 improvement as well as decrease in hypoxic fraction were observed exclusively in hypoxic MIA Paca-2 tumors. Such effect was not observed when the intra-tumor pO2 was as high as 15 mmHg even in MIA Paca-2 tumors. The treatment didn’t affect the blood perfusion in the tumor regardless of the treatment effect. This study shows that pO2 changes but not perfusion changes reflect treatment effects with hypoxia activated prodrugs such as evofosfamide.Acknowledgements
The study was funded by intramural research program of NCI/NIH (1ZIABC010476-15)References
1. Zhou J, Schmid T, Schnitzer S, et al. Tumor hypoxia and cancer progression. Cancer Lett 2006;237(1):10-21. 2. Hu J, Van Valckenborgh E, Xu D, et al. Synergistic induction of apoptosis in multiple myeloma cells by bortezomib and hypoxia-activated prodrug TH-302, in vivo and in vitro. Mol Cancer Ther 2013;12(9):1763-73. 3. Chawla SP, Cranmer LD, Van Tine BA, et al. Phase II study of the safety and antitumor activity of the hypoxia-activated prodrug TH-302 in combination with doxorubicin in patients with advanced soft tissue sarcoma. J Clin Oncol 2014;32(29):3299-306. 4. Borad MJ, Reddy SG, Bahary N, et al. Randomized Phase II Trial of Gemcitabine Plus TH-302 Versus Gemcitabine in Patients With Advanced Pancreatic Cancer. J Clin Oncol 2015;33(13):1475-81. 5. Jayaprakash P, Ai M, Liu A, et al. Targeted hypoxia reduction restores T cell infiltration and sensitizes prostate cancer to immunotherapy. J Clin Invest 2018;128(11):5137-5149. 6. Matsumoto K, Subramanian S, Devasahayam N, et al. Electron paramagnetic resonance imaging of tumor hypoxia: enhanced spatial and temporal resolution for in vivo pO2 determination. Magn Reson Med 2006;55(5):1157-63. 7. Kishimoto S, Matsumoto KI, Saito K, et al. Pulsed Electron Paramagnetic Resonance Imaging: Applications in the Studies of Tumor Physiology. Antioxid Redox Signal 2018;28(15):1378-1393. 8. Kishimoto S, Oshima N, Krishna MC, et al. Direct and indirect assessment of cancer metabolism explored by MRI. NMR Biomed 2018; 10.1002/nbm.3966:e3966. 9. O'Connor JP, Tofts PS, Miles KA, et al. Dynamic contrast-enhanced imaging techniques: CT and MRI. Br J Radiol 2011;84 Spec No 2:S112-20. 10. Tofts PS. Modeling tracer kinetics in dynamic Gd-DTPA MR imaging. J Magn Reson Imaging 1997;7(1):91-101.Figures
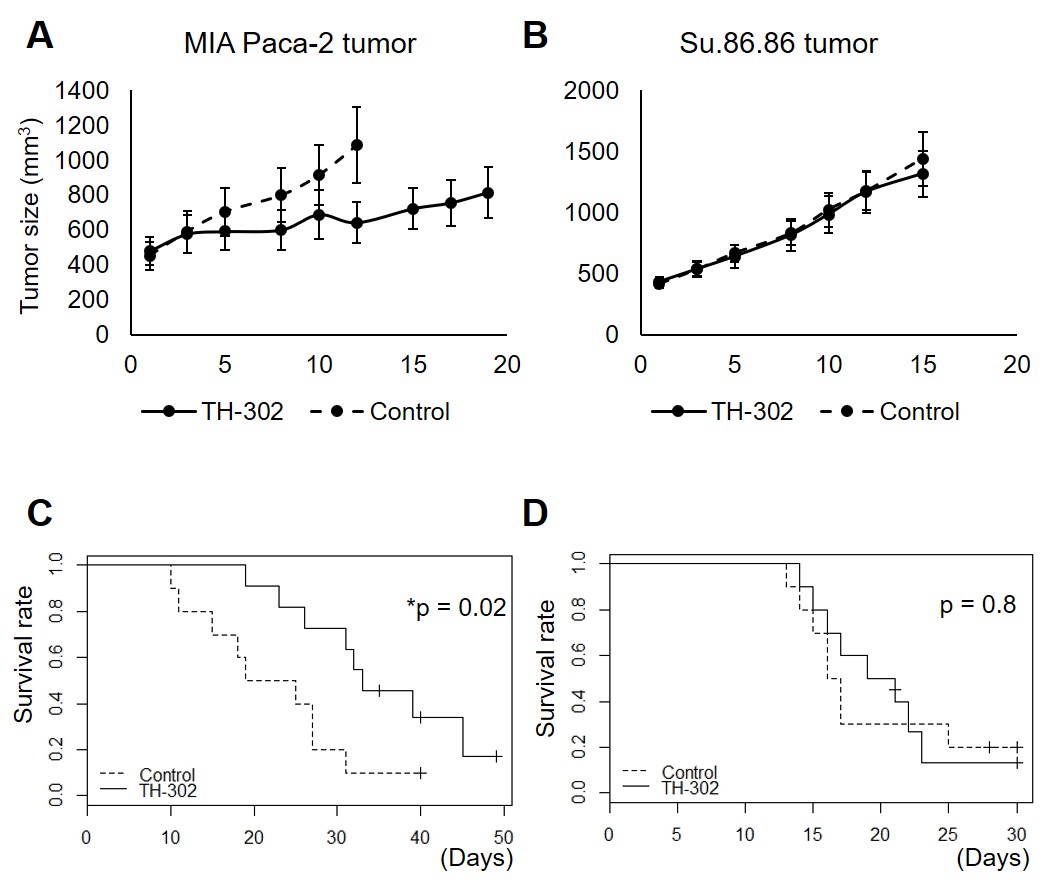
Assessment of TH-302 treatment efficacy in MIA Paca-2 and
Su.86.86 tumors.
A, C tumor growth plot and survival curve of MIA Paca-2
tumors treated with/without TH-302 50 mg/kg five days a week. B, D tumor growth
plot and survival curve of Su.86.86 tumors treated with/without TH-302 50 mg/kg
five days a week.
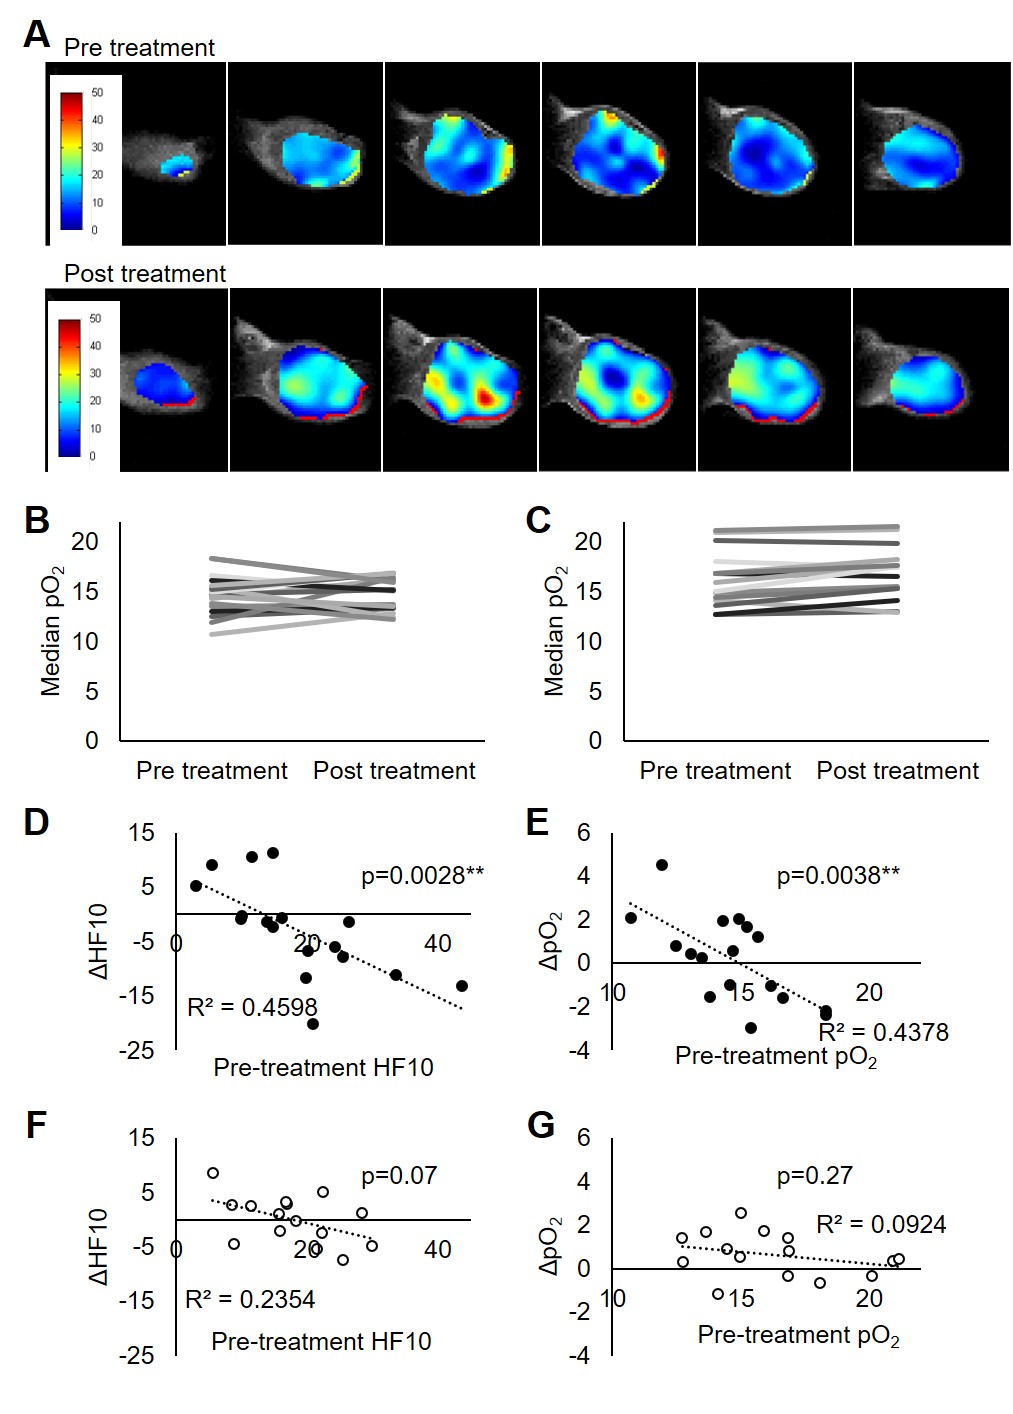
2 EPR oximetry suggested increased pO2 in hypoxic
MIA Paca-2 tumors. A representative pO2 map of pre- and post- TH-302
treated MIA Paca-2 tumor. B, C Median pO2 values of pre- and post-
treated MIA Paca-2 (B) and Su.86.86 tumors (C). D-G dot plots of Pre-treatment
HF10 vs ΔHF10 and Pre-treatment pO2
vs ΔpO2 in MIA Paca-2 (D, E) and Su.86.86 tumors (F, G).
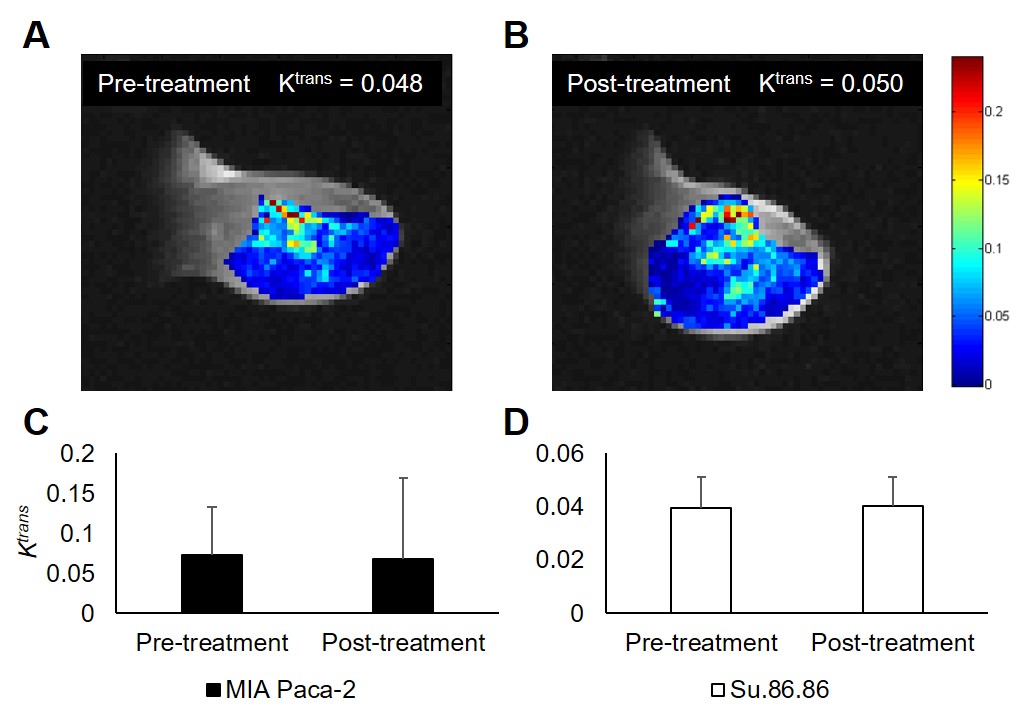
Fig. 3 DCE MRI showed that TH-302 treatment didn’t modulate
tumor perfusion. A, B representative Ktrans map in pre- and post-
treated MIA Paca-2 tumor. C, D bar plot of median Ktrans between
pre- and post- treated MIA Paca-2 (C) and Su.86.86 tumors (D).