0285
Longitudinal 3D intratumoral evaluation of an anti-angiogenic tumor treatment using a Gd-nano liposomal contrast agent and MR micro angiography1Department of Molecular Imaging and Theranostics, National Institutes for Quantum and Radiological Science and Technology, Chiba, Japan, 2Graduate School of System Informatics, Kobe University, Hyogo, Japan, 3Department of Hematology, Fujita Health University School of Medicine, Aichi, Japan, 4Graduate School of Medicine, Tokushima University, Tokushima, Japan
Synopsis
The enhanced permeability and retention (EPR) effect depends on nanoparticle properties and tumor/vessel conditions. We aimed to develop a tumor vasculature evaluation method and high-resolution nanoparticle-delivery imaging technique using magnetic resonance micro-imaging technology and a gadolinium (Gd)-dendron assembled liposomal contrast agent. We achieved 50-μm isotropic MR angiography with clear visualization of tumor micro-vessel structure. The Gd-liposome-enhanced MR micro-imaging revealed differences in the vascular structures between two different types of grafted mice models. The MR micro-imaging methods facilitate the evaluation of intratumoral vascularization patterns, the quantitative assessment of vascular-properties that alter tumor malignancy, particle retentivity, and the effects of treatment.
Introduction
Tumor microvessels often exhibit an architecturally and functionally abnormal structure, which results in a poor supply of oxygen to the cells distant from the vasculature, and induces areas of low oxygen concentration, a state known as hypoxia. These heterogeneous tumor micro-environments with insufficient blood flow lead to poor nanoparticle delivery, and hypoxia of cancer cells can reportedly confer anti-tumor drug resistance. The aims of this study were to develop a 3D tumor vasculature evaluation method and a high-resolution nanoparticle-delivery imaging technique using MR micro-imaging technology with a Gd-dendron assembled liposomal nanoparticle contrast agent. The tumor vasculature information acquired via MRmA was compared to histological sections acquired via vascular endothelial cell-stained microscopic data. The Gd-liposome-enhanced MR micro-imaging methods were then applied to monitor the particle retentivity in tumors and the therapeutic efficacy of an anti-angiogenic agent.Methods
Mouse Colon26 tumor cells were subcutaneously transplanted to the gluteal region of BALB/c nude mice. As a malignant lymphoma model, SU-DHL6 cells were transplanted to the gluteal region of NOG© mice. The two types of mice were randomly divided into three groups, MRI observation with Gd-liposome using cryogenic coil, sunitinib treatment, and vehicle control.MRmA MR experiments were performed using a preclinical 7 Tesla 20-cm bore MRI system with a highly sensitive cryogenic RF coil. During the in vivo MRI experiments, mice were anesthetized with 2.0% isoflurane gas. MRmA for visualizing vascular structures in the tumors was acquired using a “fast low angle shot (FLASH)” sequence. The voxel size was 50 μm3 isotropic. MRmA images were acquired after intravenous Gd-liposome administration via the tail vein. Multi-slice T1-weighted images (T1W) to check for particle leakage from the vessels, and multi-slice T2-weighted images (T2W) to investigate tumor anatomy were acquired.
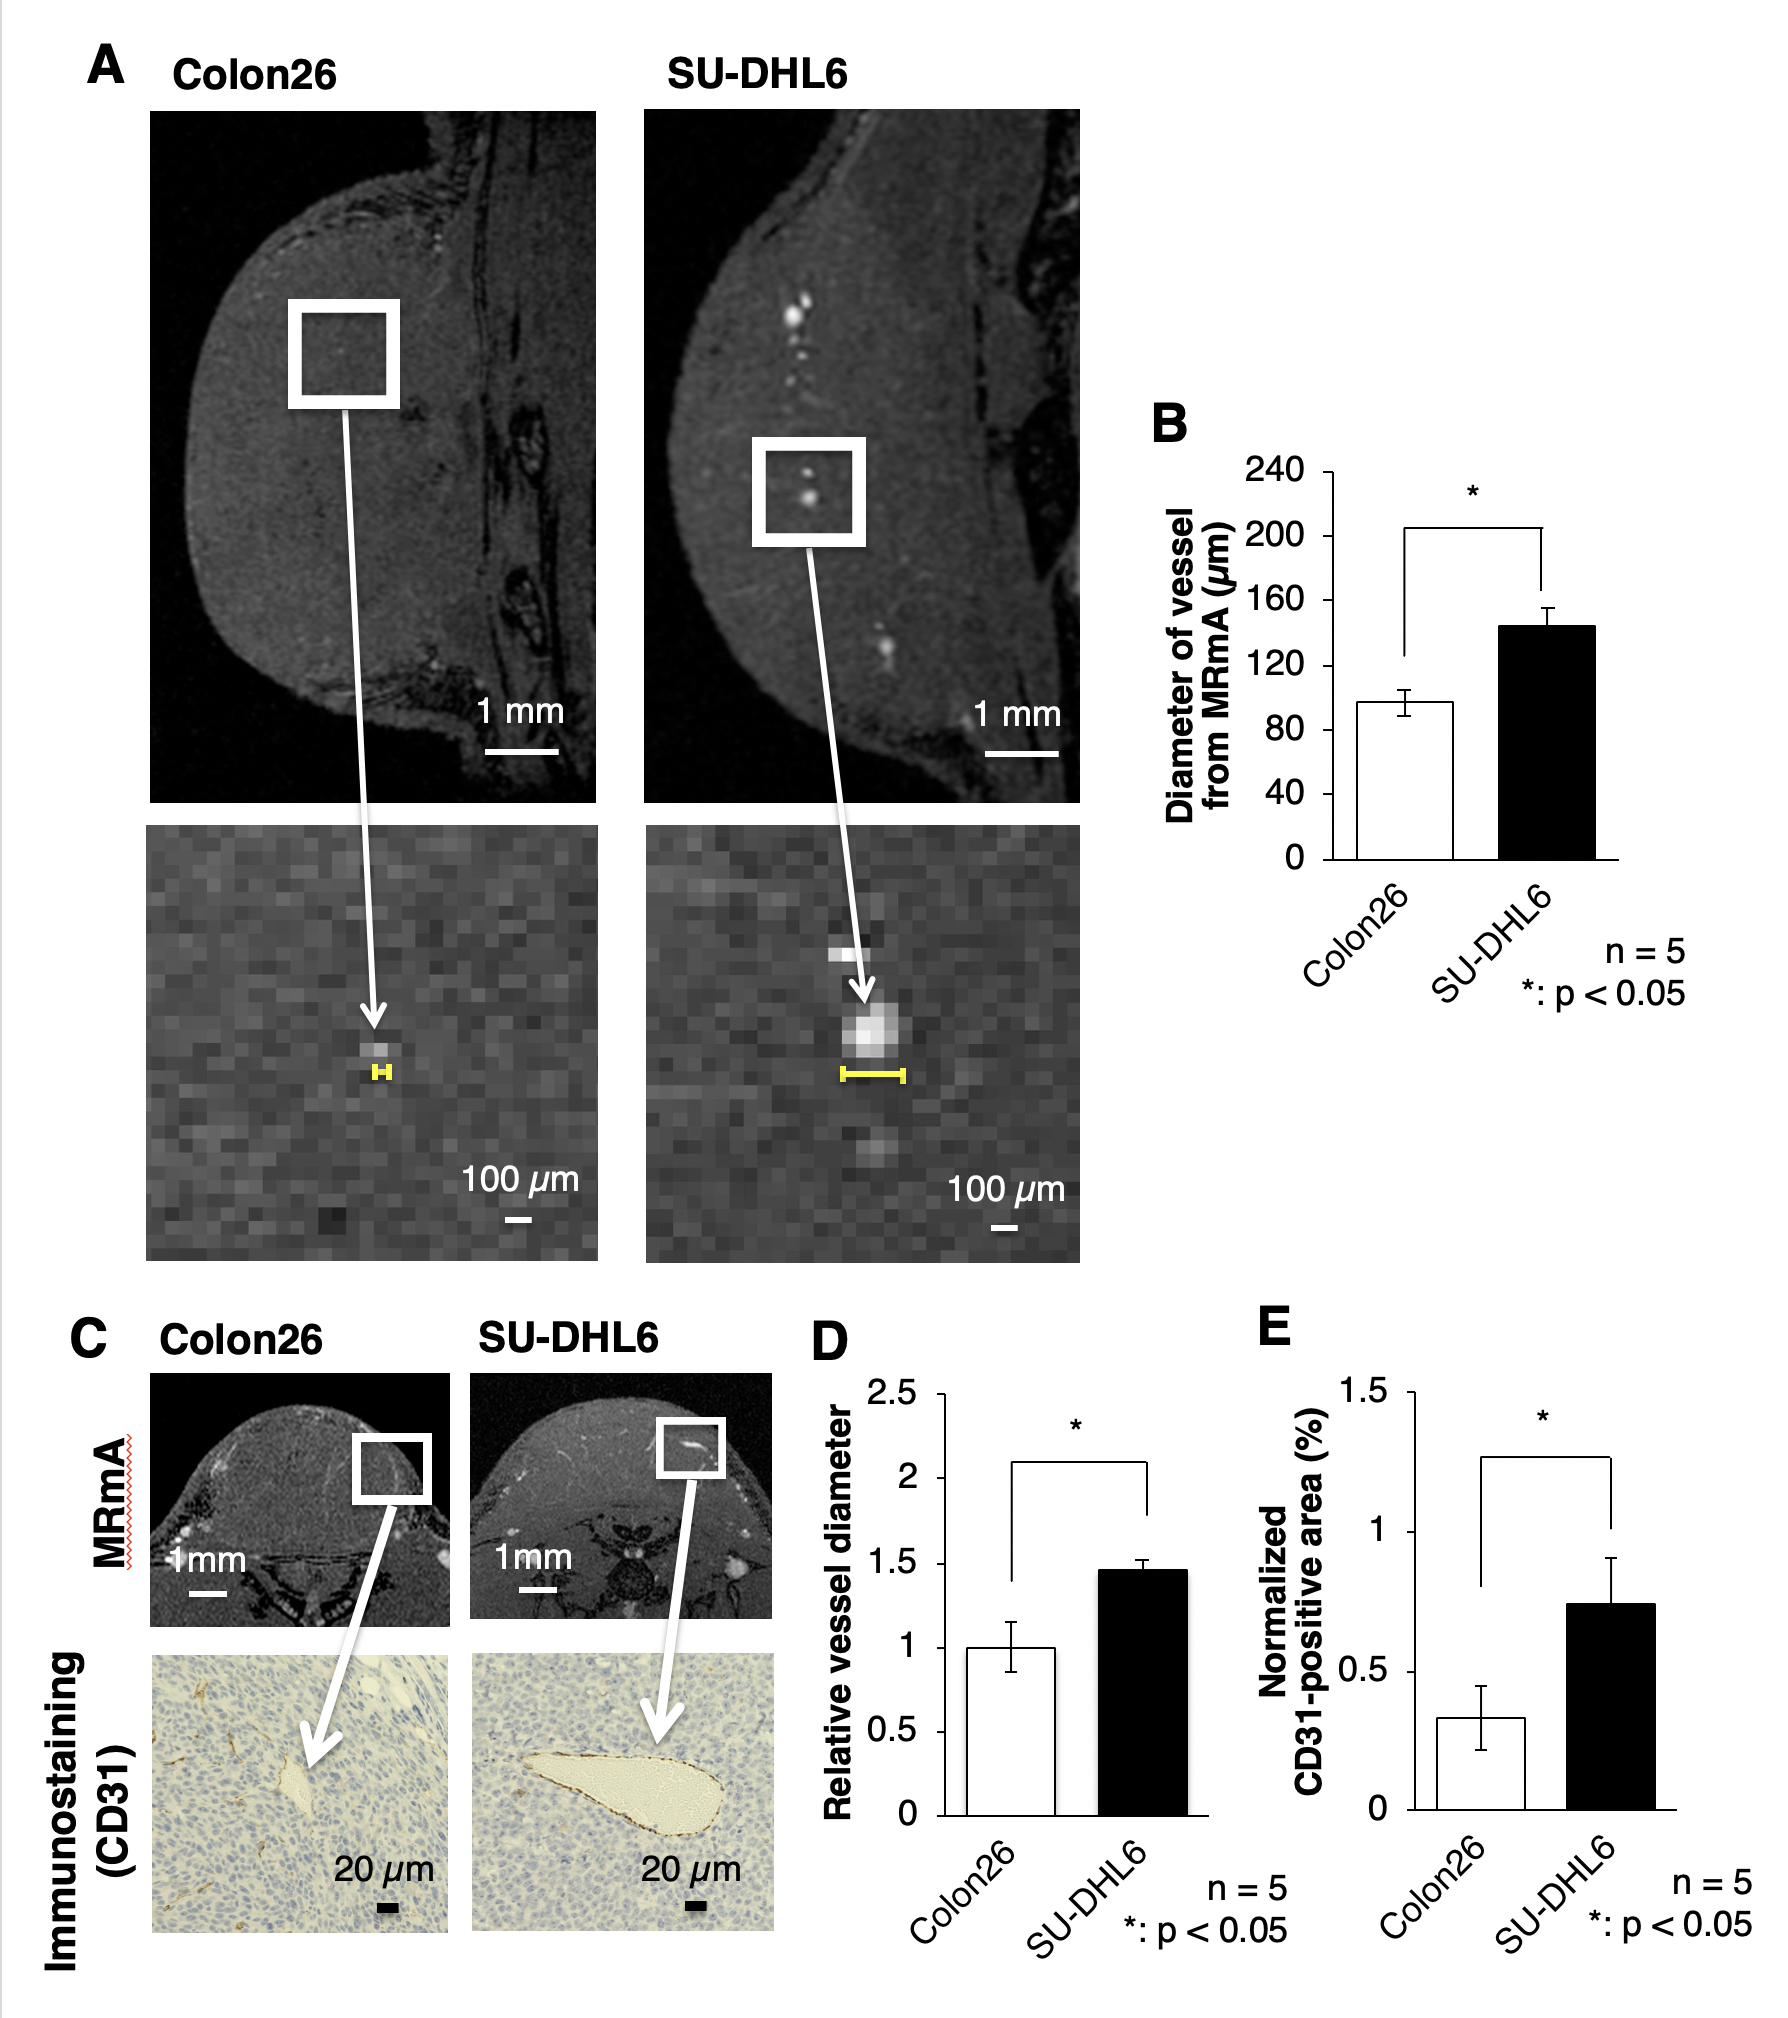
Histological analysis Immediately after MRI scanning, the mice in the MRI observation group were euthanized and their tumors were excised. To evaluate the area of vascular endothelial cells for histological staining, CD31 staining was performed.
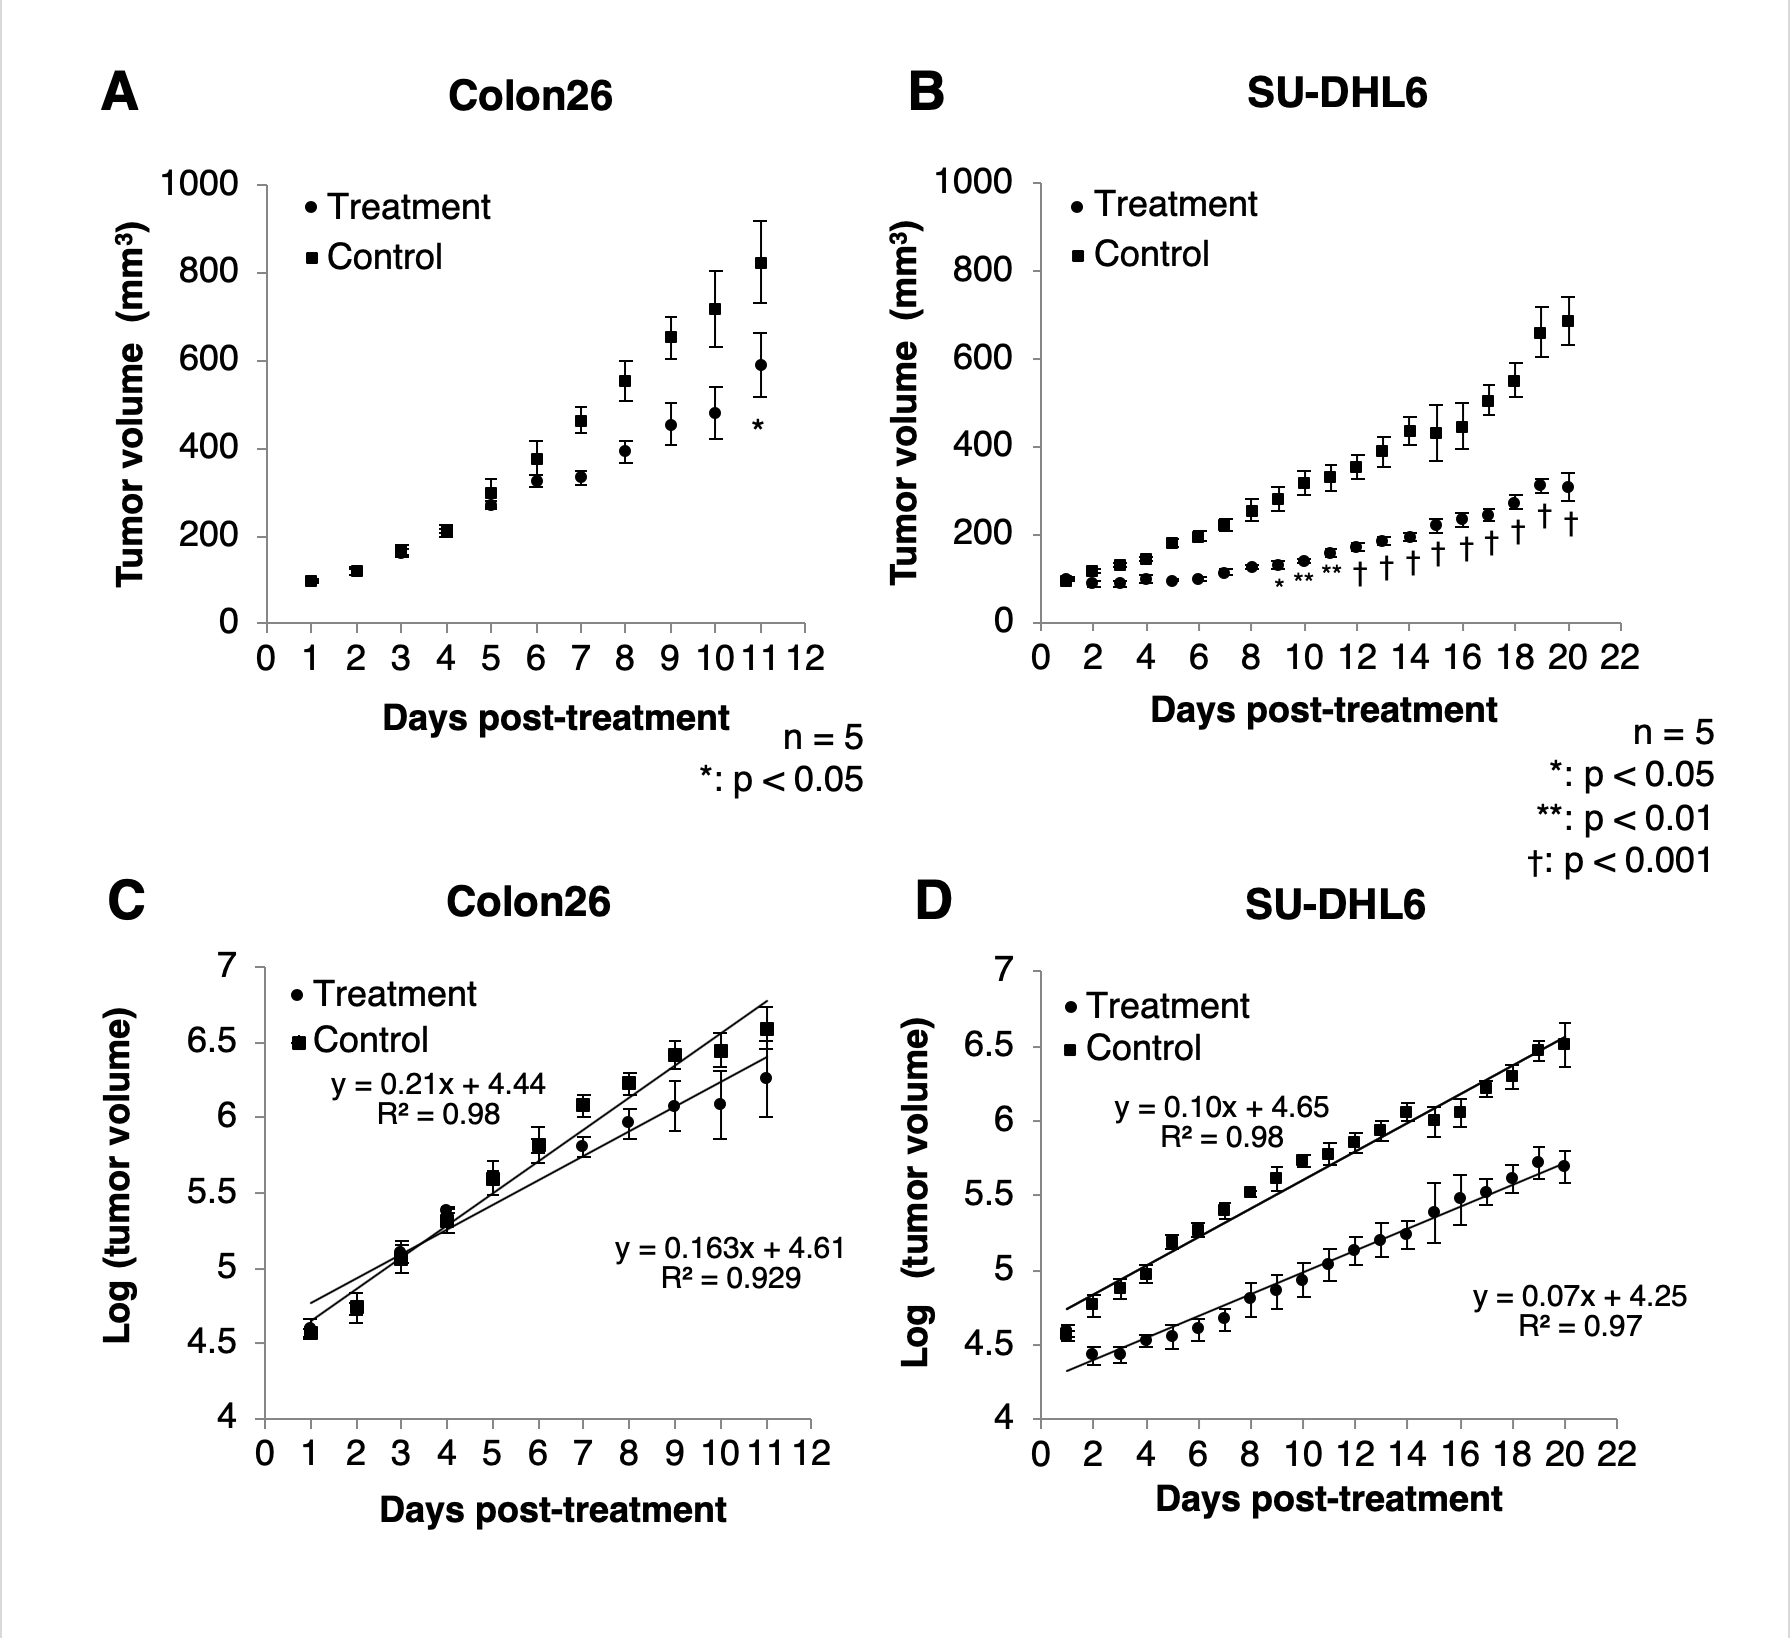
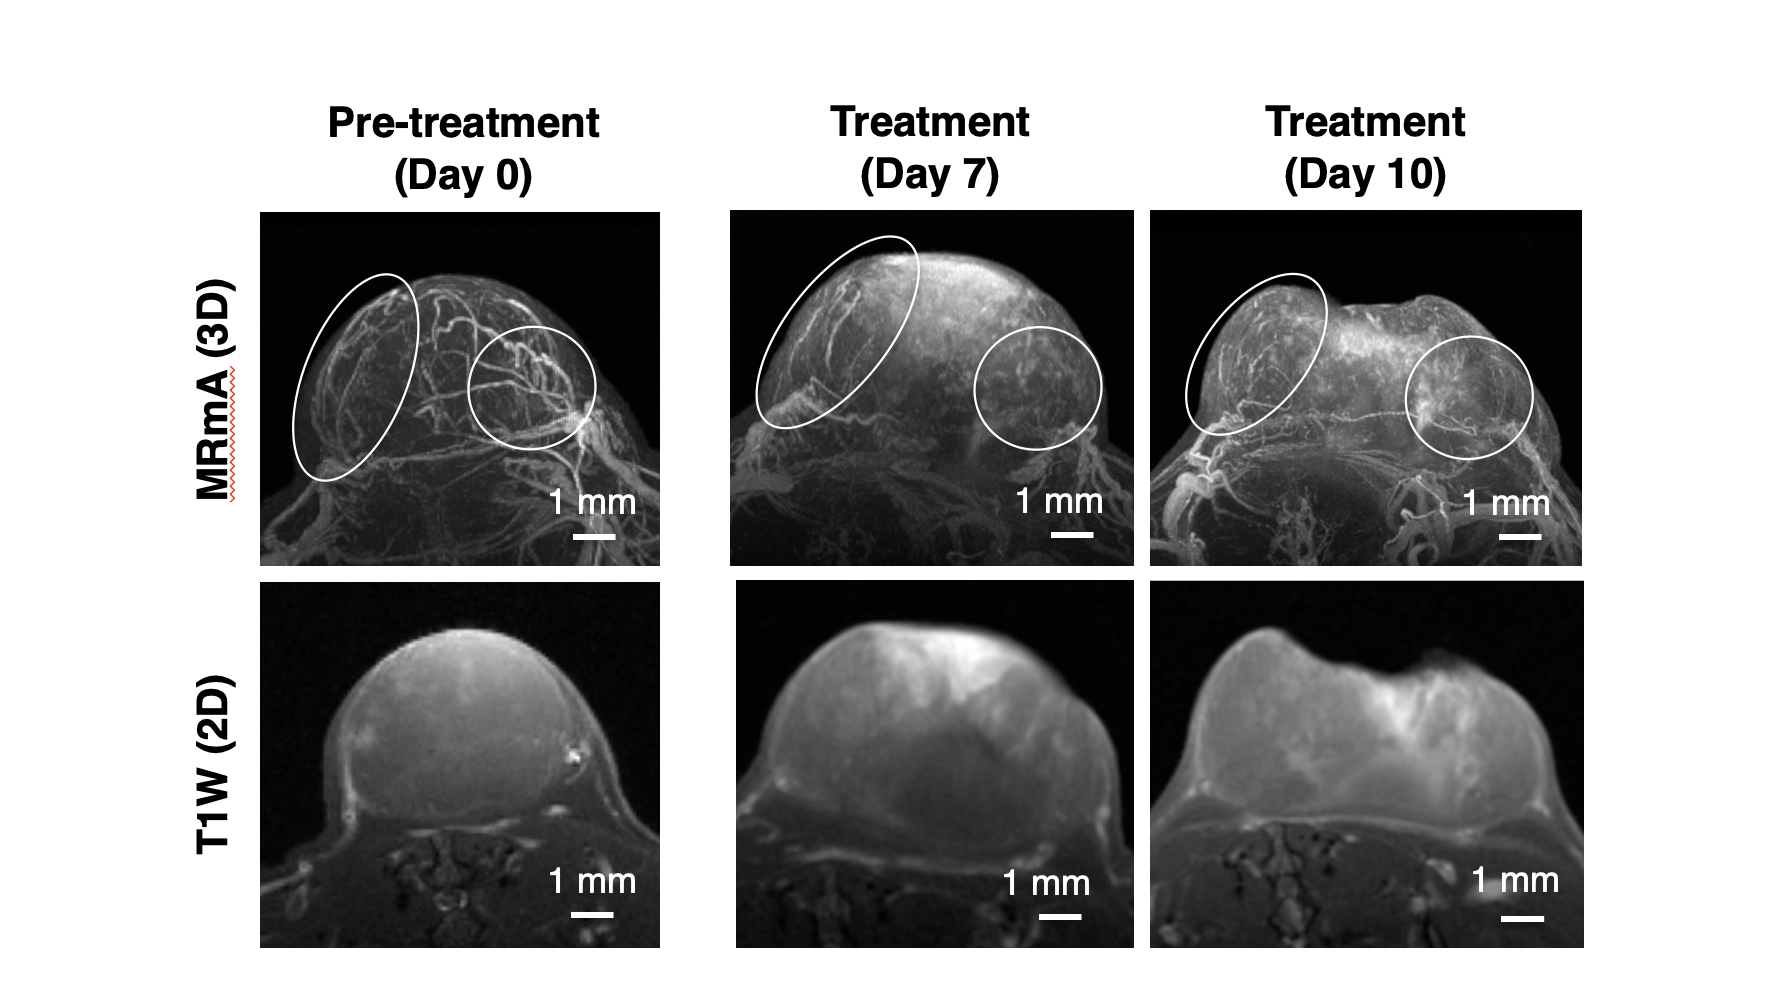
Anti-angiogenic agent treatment To evaluate the therapeutic effect and MRmA detection, the anti-angiogenic agent sunitinib and vehicle control solution were prepared. The sunitinib (50 mg/kg) or vehicle control solution was administrated perorally every day. The endpoint of the study was set to 800 mm3 of tumor volume. One of the Colon26-grafted BALB/c nude mice was used for longitudinal MRmA observation of the therapeutic effect with an anti-angiogenic agent.
Statistical analysis Statistical analyses of MRmA was performed using Student's unpaired t-test for two-group comparisons. One-way analysis of variance (ANOVA) with Tukey's correction was used for comparisons of vascular properties and, two-way ANOVA with Tukey's correction was used for evaluation of the therapeutic effect of sunitinib.
Results
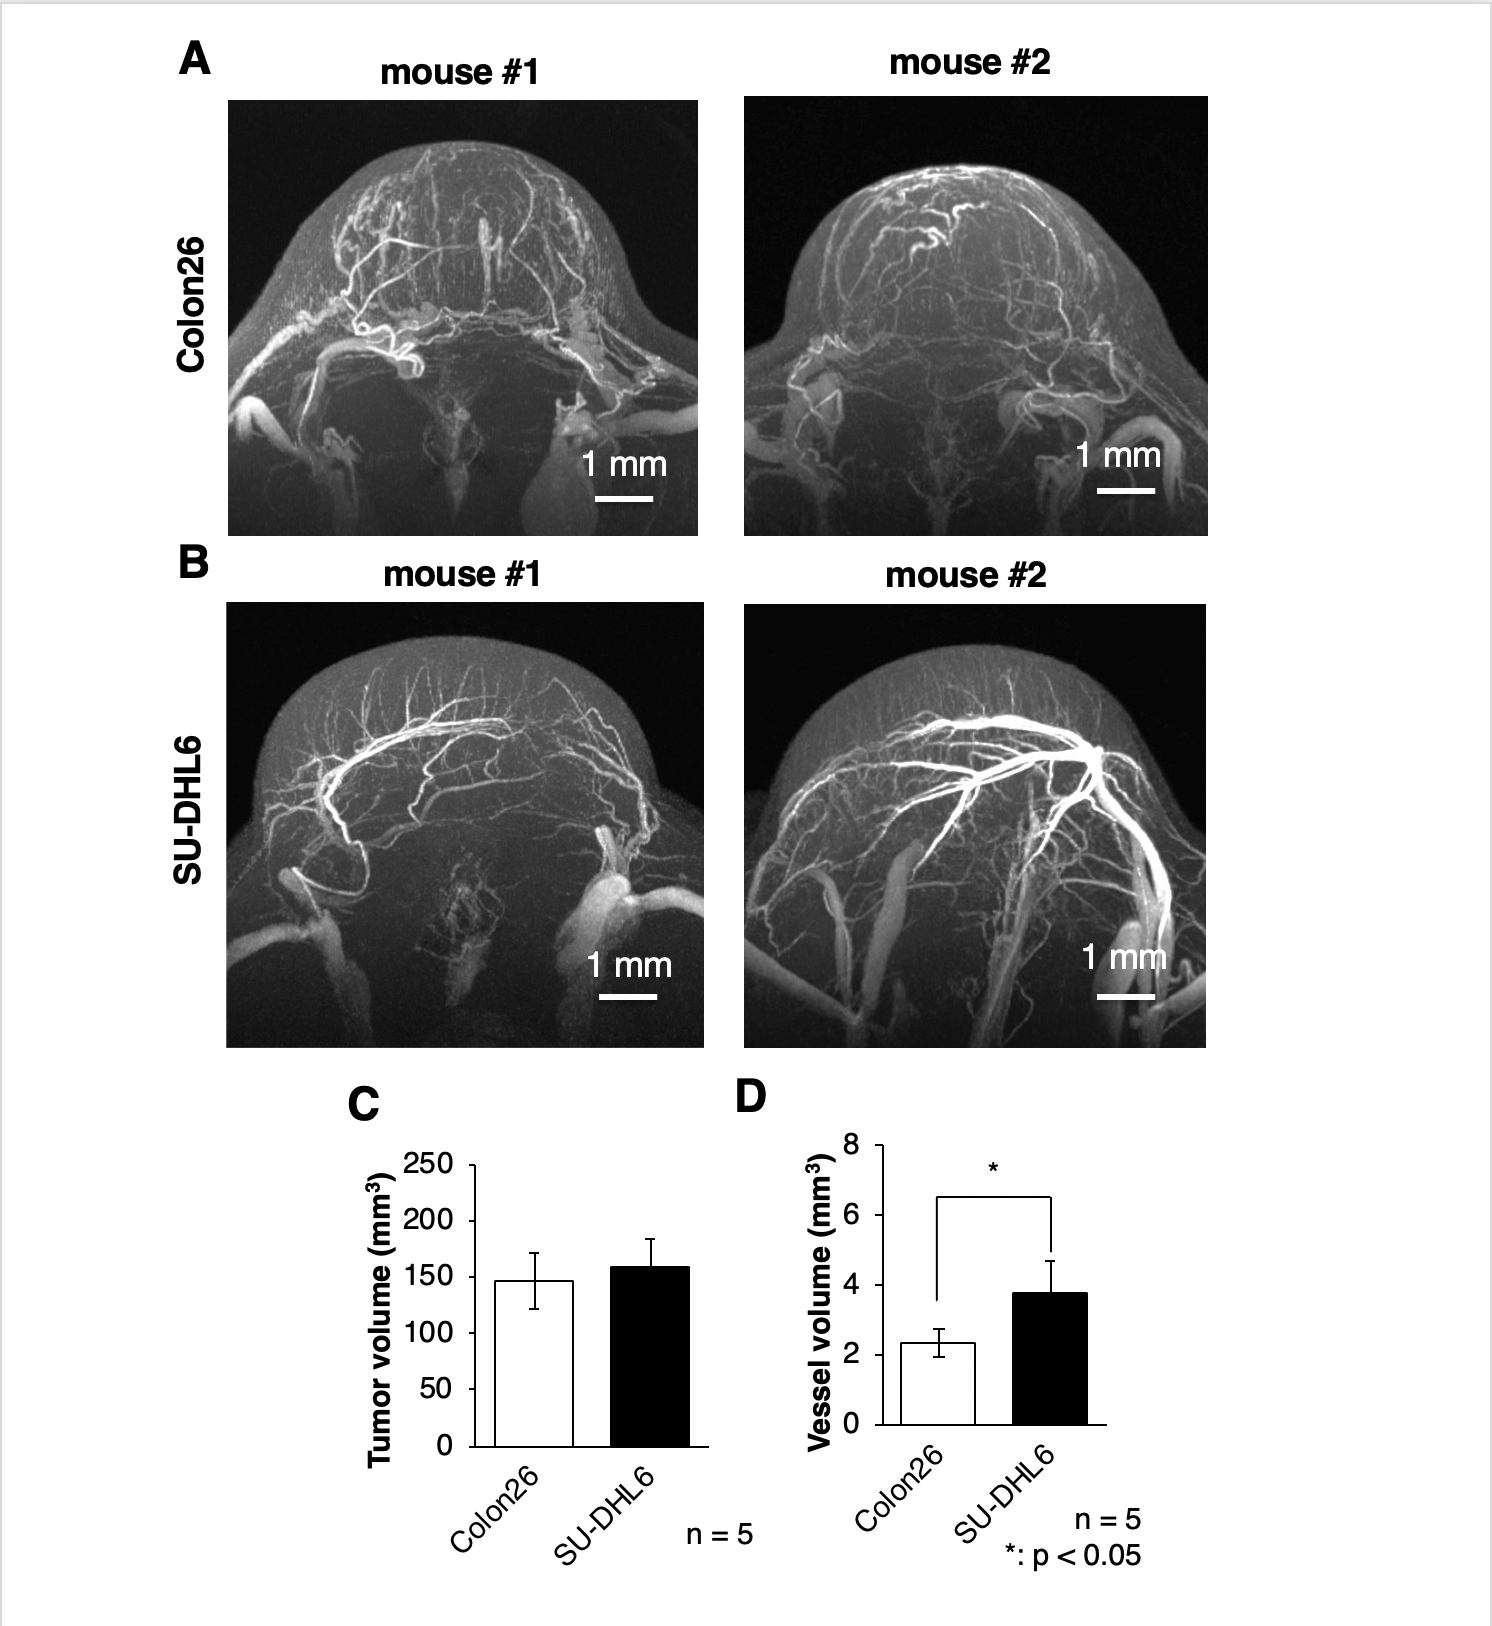
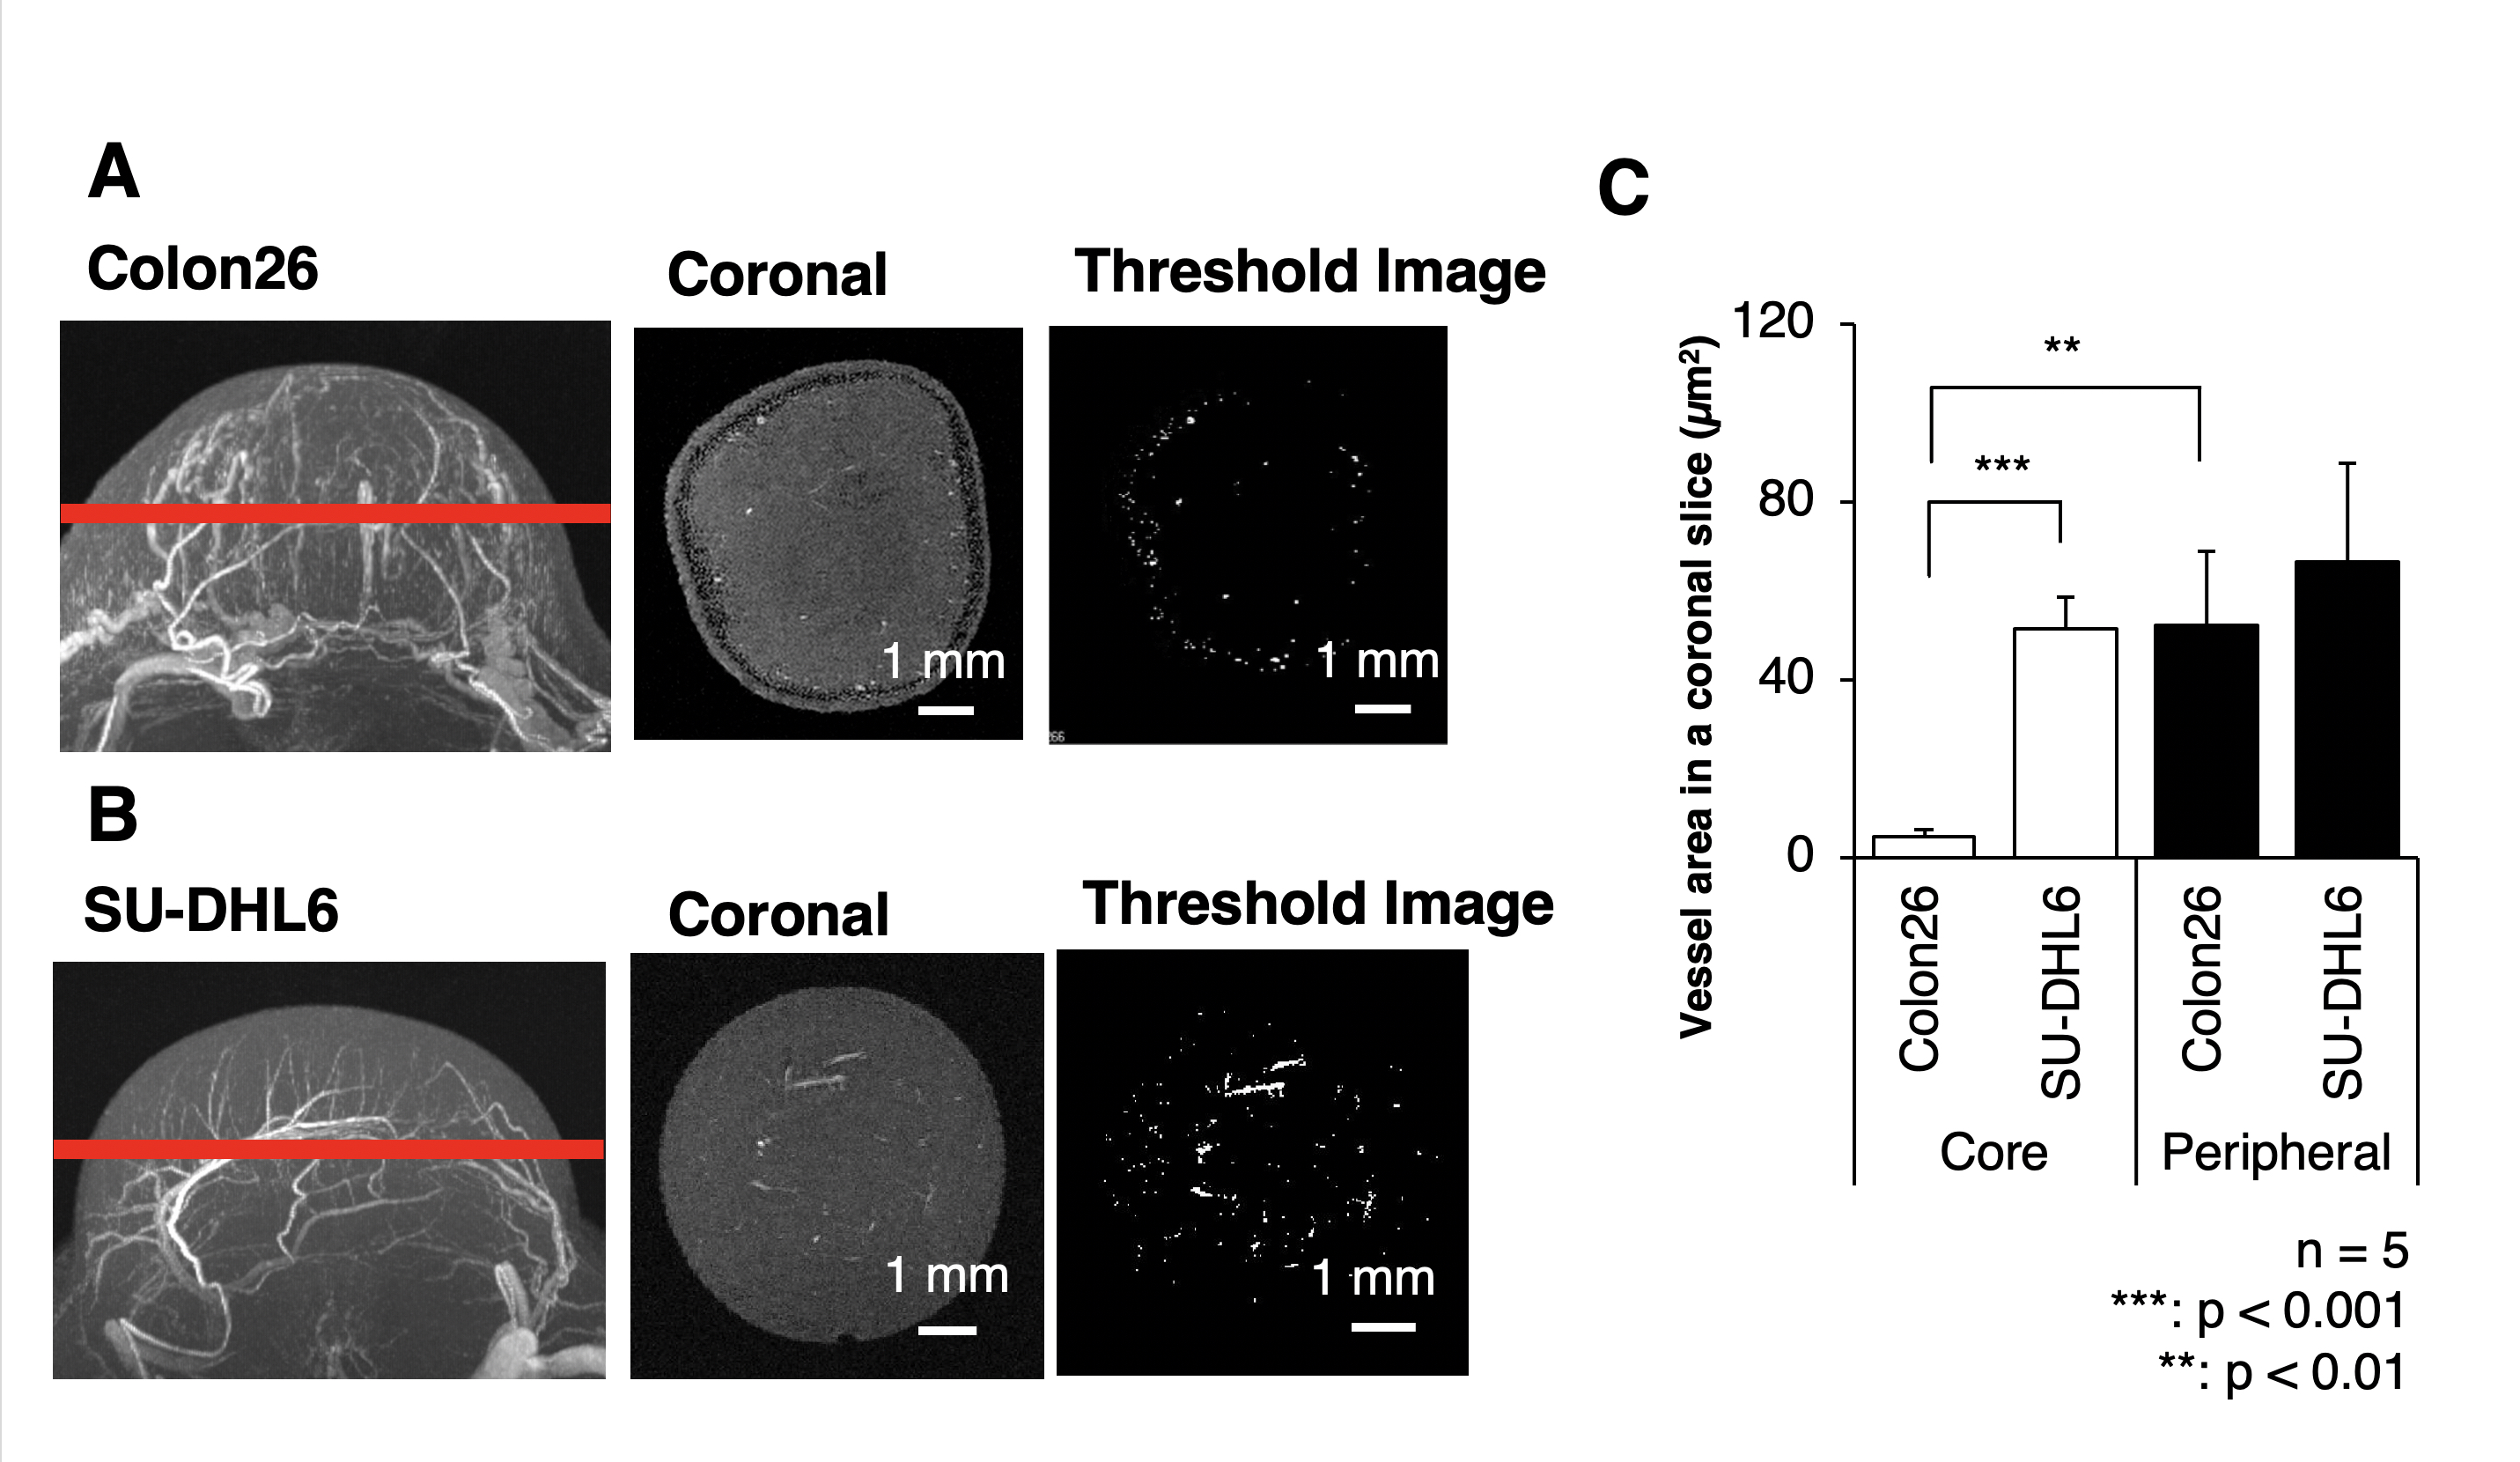
The present study using Gd-liposome and MR micro-imaging technology achieved 50 μm isotropic resolution MRmA, which enabled the quantitative assessment of tumor vasculature volume and diameter. In this study, Gd-liposome-enhanced 3D MRmA clearly distinguished the differences in vascular properties between colon26 and SU-DHL6. This positively enhanced contrast of blood vessels allowed measurement of the absolute tumor vessel volume (mm3) and provided evidence that sunitinib is more effective for SU-DHL6 than for colon26. The vessel diameter was also measured from CD31 immuno-histological images and compared between both tumors. Indeed, sunitinib administration was predominantly beneficial for the treatment of SU-DHL6 tumors in which vessel density and diameter were greater than in colon26. In addition, our method also allowed monitoring of the spatial and temporal alterations of tumor vasculature upon sunitinib treatment.Discussion
Vascularization patterns and vascular diameters differ in each tumor type.1 The noninvasive assessment of vascular properties is useful for the diagnosis of tumorigenesis or its malignant transformation. In addition to the vascular architecture, whether the EPR effect occurs in the tumor has a great influence on the strategy of nanomedicine.2 In this study, Gd-liposome-enhanced 3D MRmA clearly distinguished the differences in vascular properties between colon26 and SU-DHL6. This positively enhanced contrast of blood vessels allowed measurement of the absolute tumor vessel volume and provided evidence that sunitinib is more effective for SU-DHL6 than for colon26. In addition, our method also allowed monitoring of the spatial and temporal alterations of tumor vasculature upon sunitinib treatment. Thus, more precise evaluation of intratumoral vasculature is possible using our 3D MRmA, which enables the decision of the appropriate treatment method and on follow-up whether the anti-angiogenic therapy is effective and should be continued.Conclusion
We developed a 3D tumor vasculature evaluation method and a high-resolution nanoparticle-delivery imaging using MR micro-imaging technology with a Gd-dendron assembled liposomal nanoparticle contrast agent. The Gd-liposome-enhanced 3D MRmA technology revealed differences in the vascular structures between Colon26 and SU-DHL6 (malignant lymphoma) grafted models and facilitated the longitudinal observation of therapeutic alterations. The MR micro-imaging methods facilitate the evaluation of intratumoral vascularization patterns, the quantitative assessment of vascular properties that alter tumor malignancy, particle retentivity in tumors, and the effects of treatment. We expect that the 3D MR micro-imaging methods described herein will prove widely applicable for the in vivo evaluation of tumor heterogeneity and the fine prediction for nanomedicine following additional development of therapeutic nanoparticles and theranostic agents in the future.Acknowledgements
The authors thank the late Dr. Kenji Kono for the development of the Gd-liposome contrast agent. The authors would also like to thank Jeff Kershaw for English language revision and Ms. Sayaka Hayashi for the cell culture and animal care.References
1. Azzi S, Hebda JK, Gavard J. Vascular permeability and drug delivery in cancers. Front Oncol2013;3(211):1-14.
2. Kono K, Nakashima S, Kokuryo D, Aoki I, Shimomoto H, Aoshima S, etal. Multi-functional liposomes having temperature-triggered release andmagnetic resonance imaging for tumor-specific chemotherapy. Bioma-terials2011;32(5):1387-95.
Figures