0283
A Comprehensive, Adaptive Approach for Shutter-Speed DCE-MRI Analyses of Heterogeneous Brain Tumor Data1Interdisciplinary Institute of Neuroscience and Technology, School of Medicine, Zhejiang University, Hangzhou, China, 2Department of Radiology, Shandong University Qilu Hospital, Jinan, China, 3College of Biomedical Engineering and Instrument Science, Zhejiang University, Hangzhou, China, 4MR Collaboration, Siemens Healthcare, Shanghai, China, 5Advanced Imaging Research Center, Oregon Health & Science University, Portland, OR, United States, 6Department of Neurosurgery, Provincial Hospital Affiliated to Shandong University, Jinan, China
Synopsis
The [Shutter-Speed-Model-Dynamic-Contrast-Enhanced] SSM-DCE-MRI pharmacokinetic analysis has a metabolic dimension. However, SSM must be applied thoughtfully, especially in Glioblastoma multiforme [GBM], because of strong tissue vascular heterogeneity across the brain field-of-view Here, we present a method to select the appropriate SSM-DCE-MRI version to analyze such tissue, on a pixel-by-pixel basis. The supra-intensive parameters, vascular water efflux (kbo), cellular water efflux (kio), and vascular CA efflux (kpe) rate constants could be reliably determined. Pilot data on one recurrent and one pre-diagnosis GBM patient are presented to demonstrate method performance.
Introduction
The [Shutter-Speed-Model-Dynamic-Contrast-Enhanced] SSM-DCE-MRI pharmacokinetic analysis adds a metabolic dimension to DCE-MRI1,2. Changes in the on‑going plasma membrane Na+,K+-ATPase [NKA] metabolic rate can be detected1,3,4. This is of particular interest in cancers, since NKA activity seems to increase significantly. However, SSM must be applied thoughtfully, especially in Glioblastoma multiforme [GBM], because of strong tissue vascular heterogeneity across the brain field-of-view. Contrast agent (CA) extravasation is essentially negligible in normal-appearing [NA] cerebral regions with an intact blood-brain-barrier, but significant in the tumors. Here, we present a method to apply the appropriate SSM-DCE-MRI version to analyze such heterogeneous tissue on a pixel-by-pixel basis.Methods
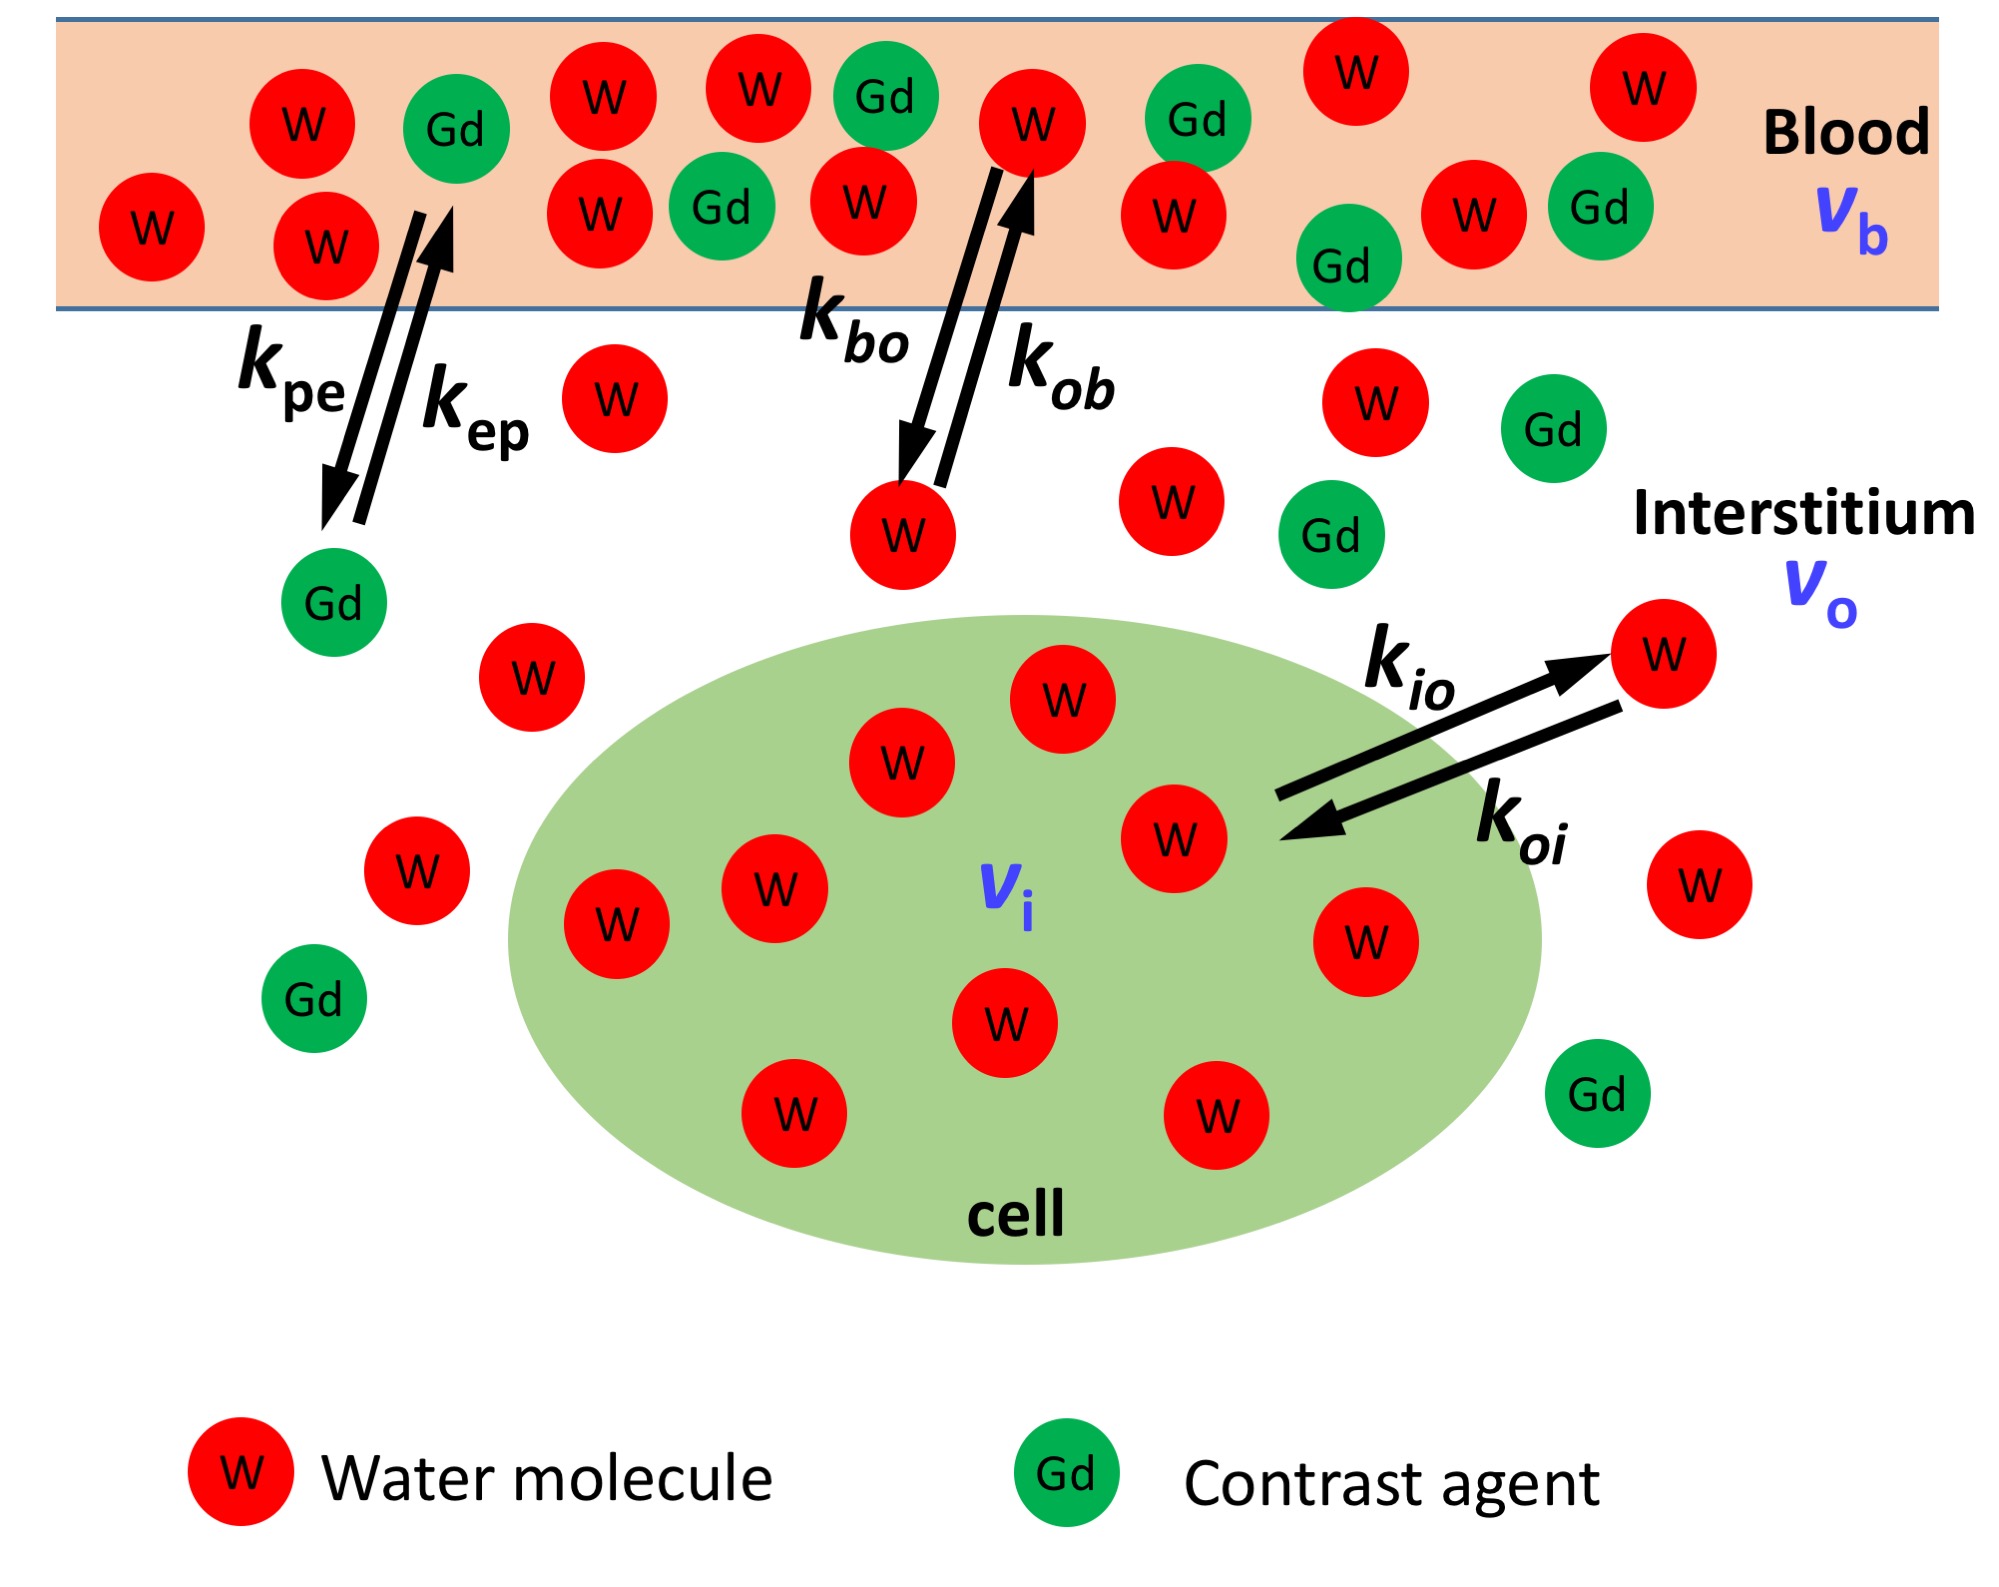
Recurrent GBM (subject A) and pre-diagnosis GBM (subject B) patients were studied. DCE-MRI was performed within a 3T MRI (Magnetom Skyra, Siemens Healthcare, Erlangen, Germany). 80 frames with 6.81 s per frame, (0.8 × 0.8 × 1.5) mm3 voxel size, TR/TE/flip angle 6.2ms/1.3ms/10o, were acquired for each patient. The corrected Akaike information criterion automatically separated data for proper SSM versions – pixels with sufficient CA extravasation were analyzed with the full 3-site-2-exchange (3S2X) SSM (SSMfull) model illustrated in Figure 1. SSMfull has potentially five independent physiological-related parameters: pb and po, the vascular and interstitial water mole fractions, kbo, and kio, the steady-state water molecule extravasation and cellular efflux rate constants, and Ktrans, – the CA extravasation rate constant (kpe)·plasma volume fraction (vp) product [i.e., Ktrans = kpevp = kepvo, where kep is the CA intravasation rate constant].5 For pixels with minimal CA extravasation, a restricted SSM version (SSMvas) is implemented, in which trans-cytolemmal water exchange, in the vanished SS (VSS) condition, has negligible effects. When accessible, the water exchange process parameters kio and kbo, were processed with error analyses to eliminate unreliable estimations.Results and Discussions
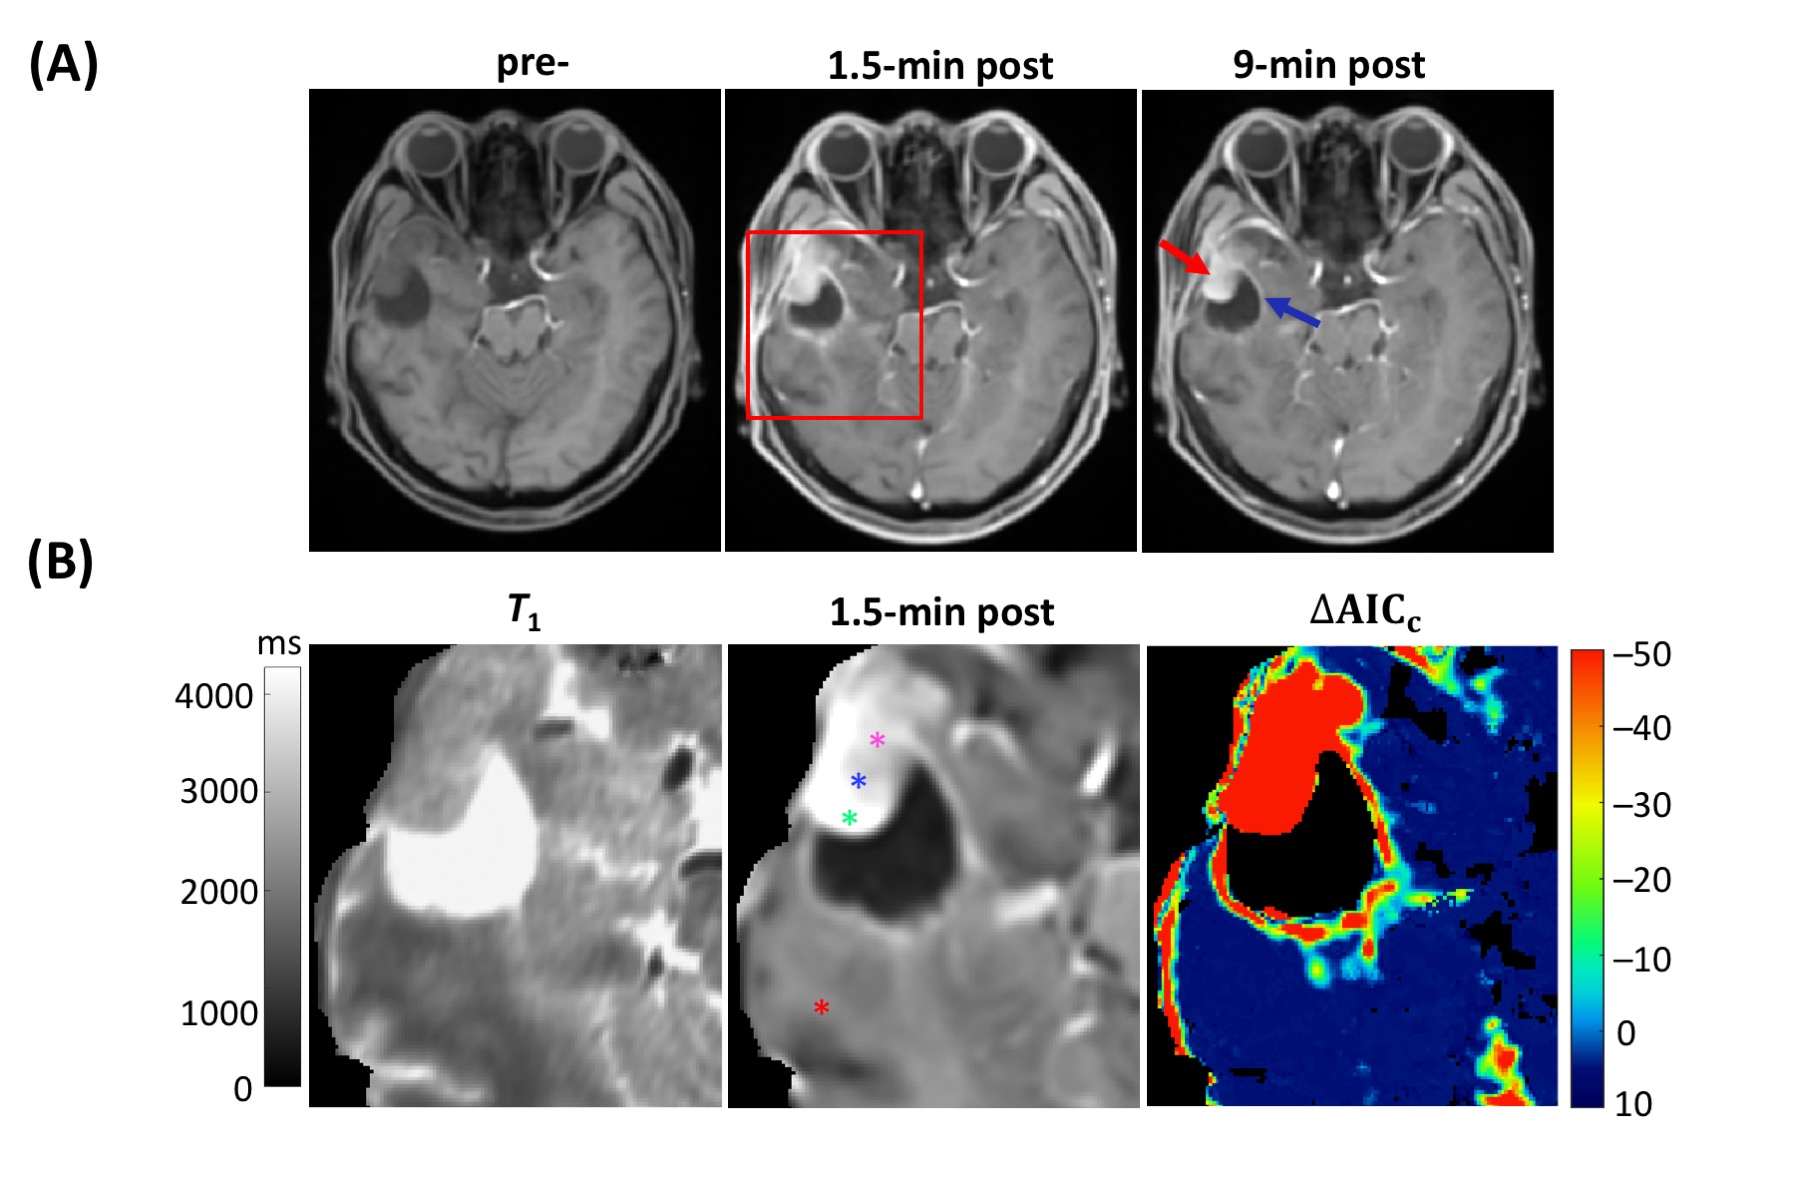
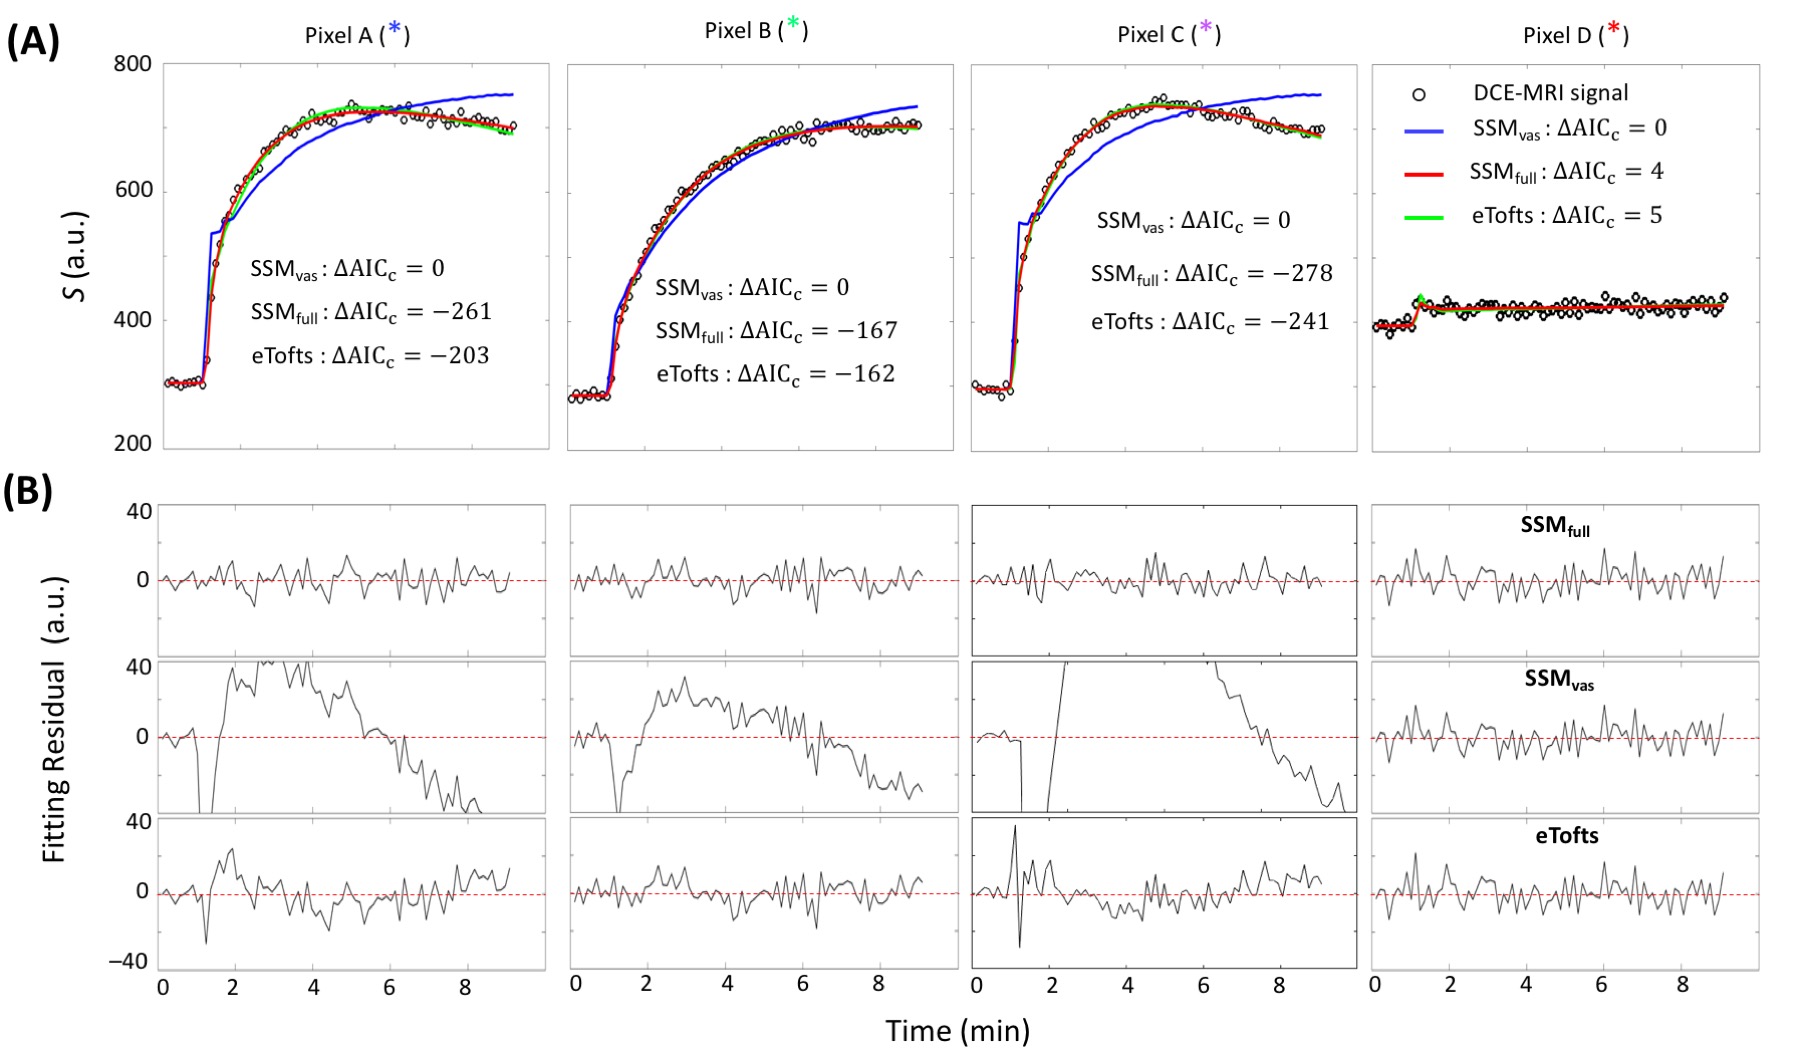
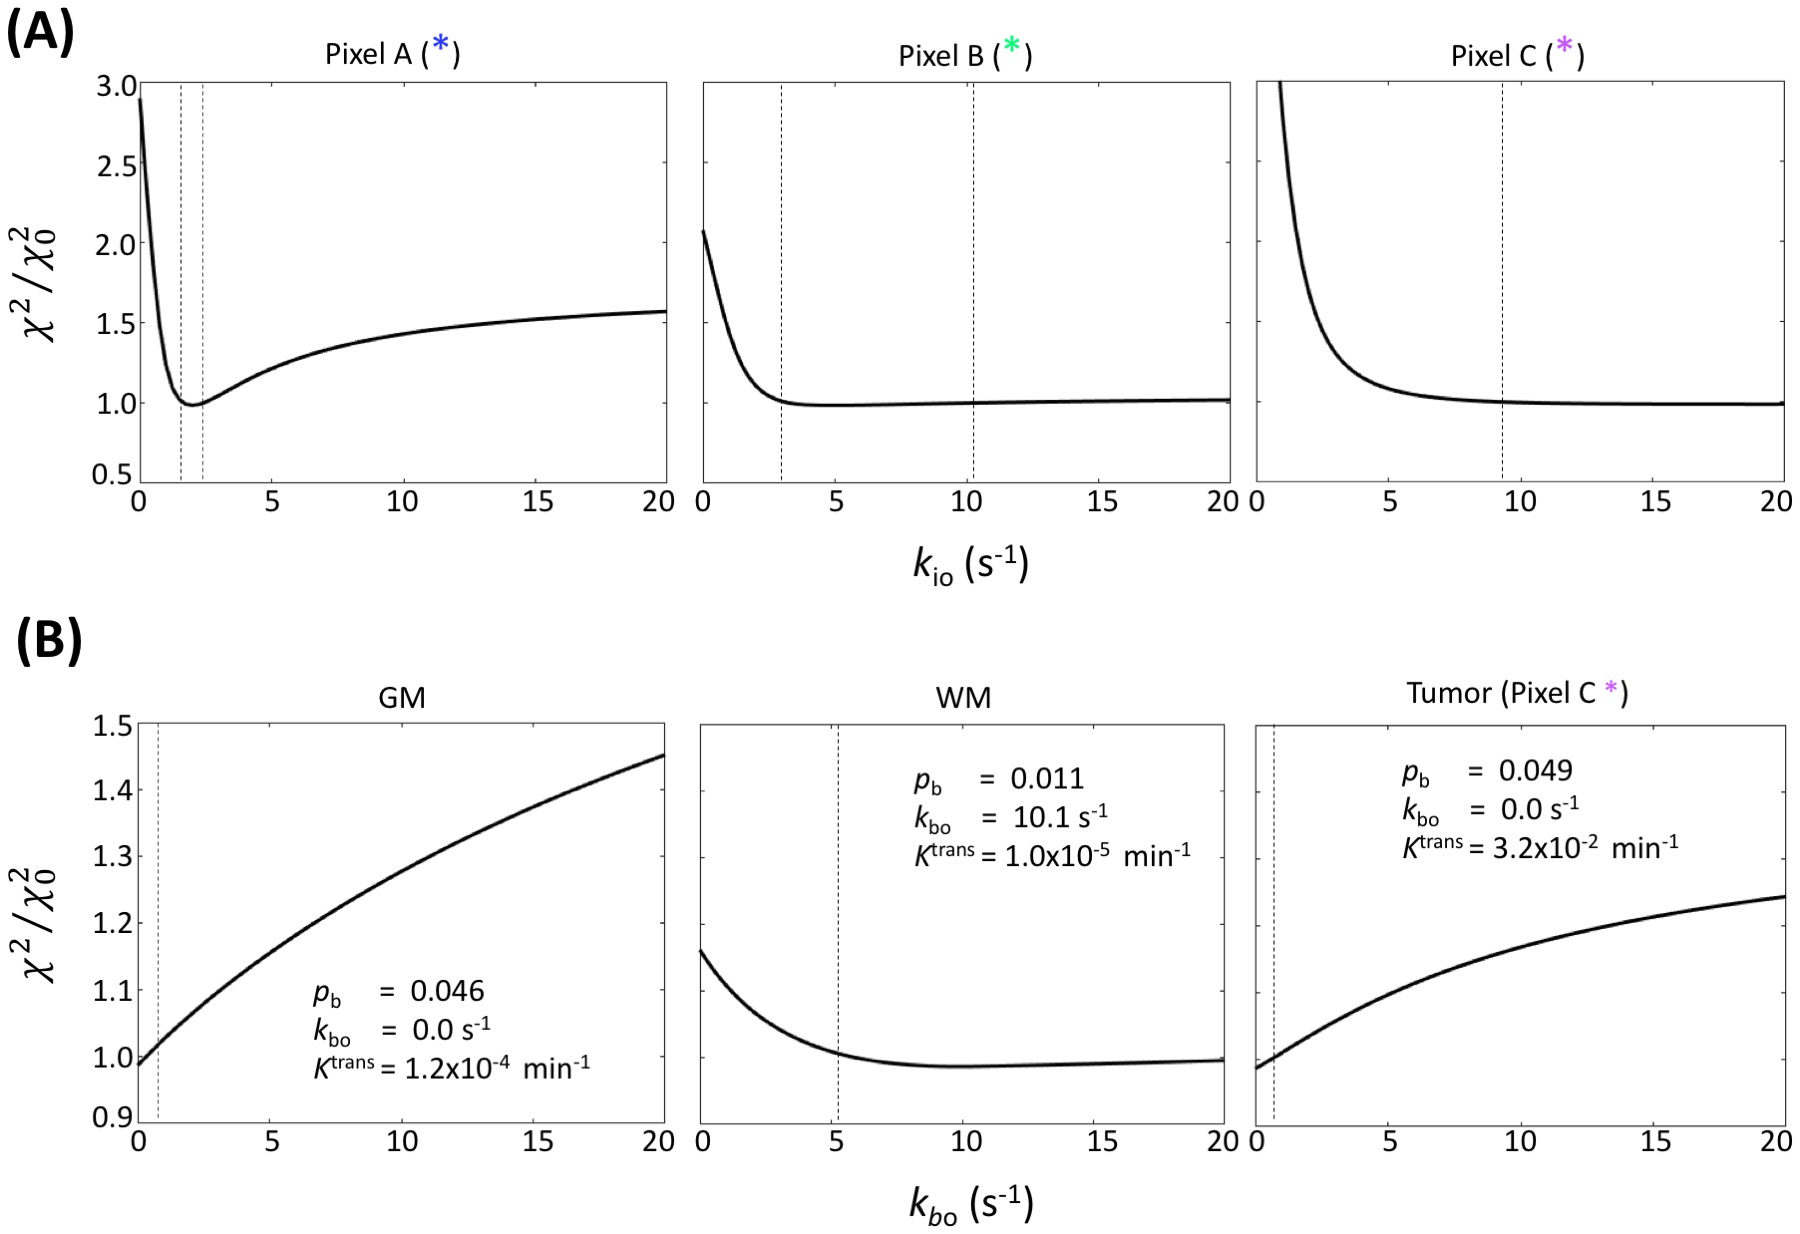
Figure 2A panels show single axial image slices pre-, 1.5 min post-, and 9 min post-CA (left-to-right) of subject A. The zoomed ΔAICc [ΔAICc ≡ AICc(SSMfull) – AICc(SSMvas) ] map in Fig. 2B shows that most pixels in tumor region showed sufficient contrast enhancement and were better matched by SSMfull: the ΔAICc values were generally more negative than -10. Most normal-appearing brain (NAB) pixels were better matched by SSMvas. In the three representative tumor single pixels (Figure 3A–3C), systematic SSMvas fitting bias was observed for Pixels A–C (Fig. 3B). For NAB pixel D, both SSMfull and SSMvas showed good fittings but SSMfull clearly overfitted the data with positive . In the three tumor region pixels (A–C), the SSMfull AICc value is more negative than for the extended Tofts model (eTofts). For NAB pixels, e.g., pixel D, SSMvas also shows better fitting than eTofts with smaller more negative AICc.For the kio error analysis, tumor core pixel A shows well-defined error bounds: 2.0 (–0.25/+0.5) s-1 (Figure 4A). Tumor rim pixel B shows a larger upper error bound: 5.0 (–1.75/+5.25) s-1. Tumor rim pixel C shows a poorly determined upper bound, but a lower error bound (9.0 s-1) can still be set. Subject B NAB gray matter (GM) and white matter (WM) pixels and the subject B tumor rim pixel C were selected as representatives for kbo error analysis (Fig. 4B). Most pixels still show well-defined error bounds for 95% confidence level or a well-defined lower bound.
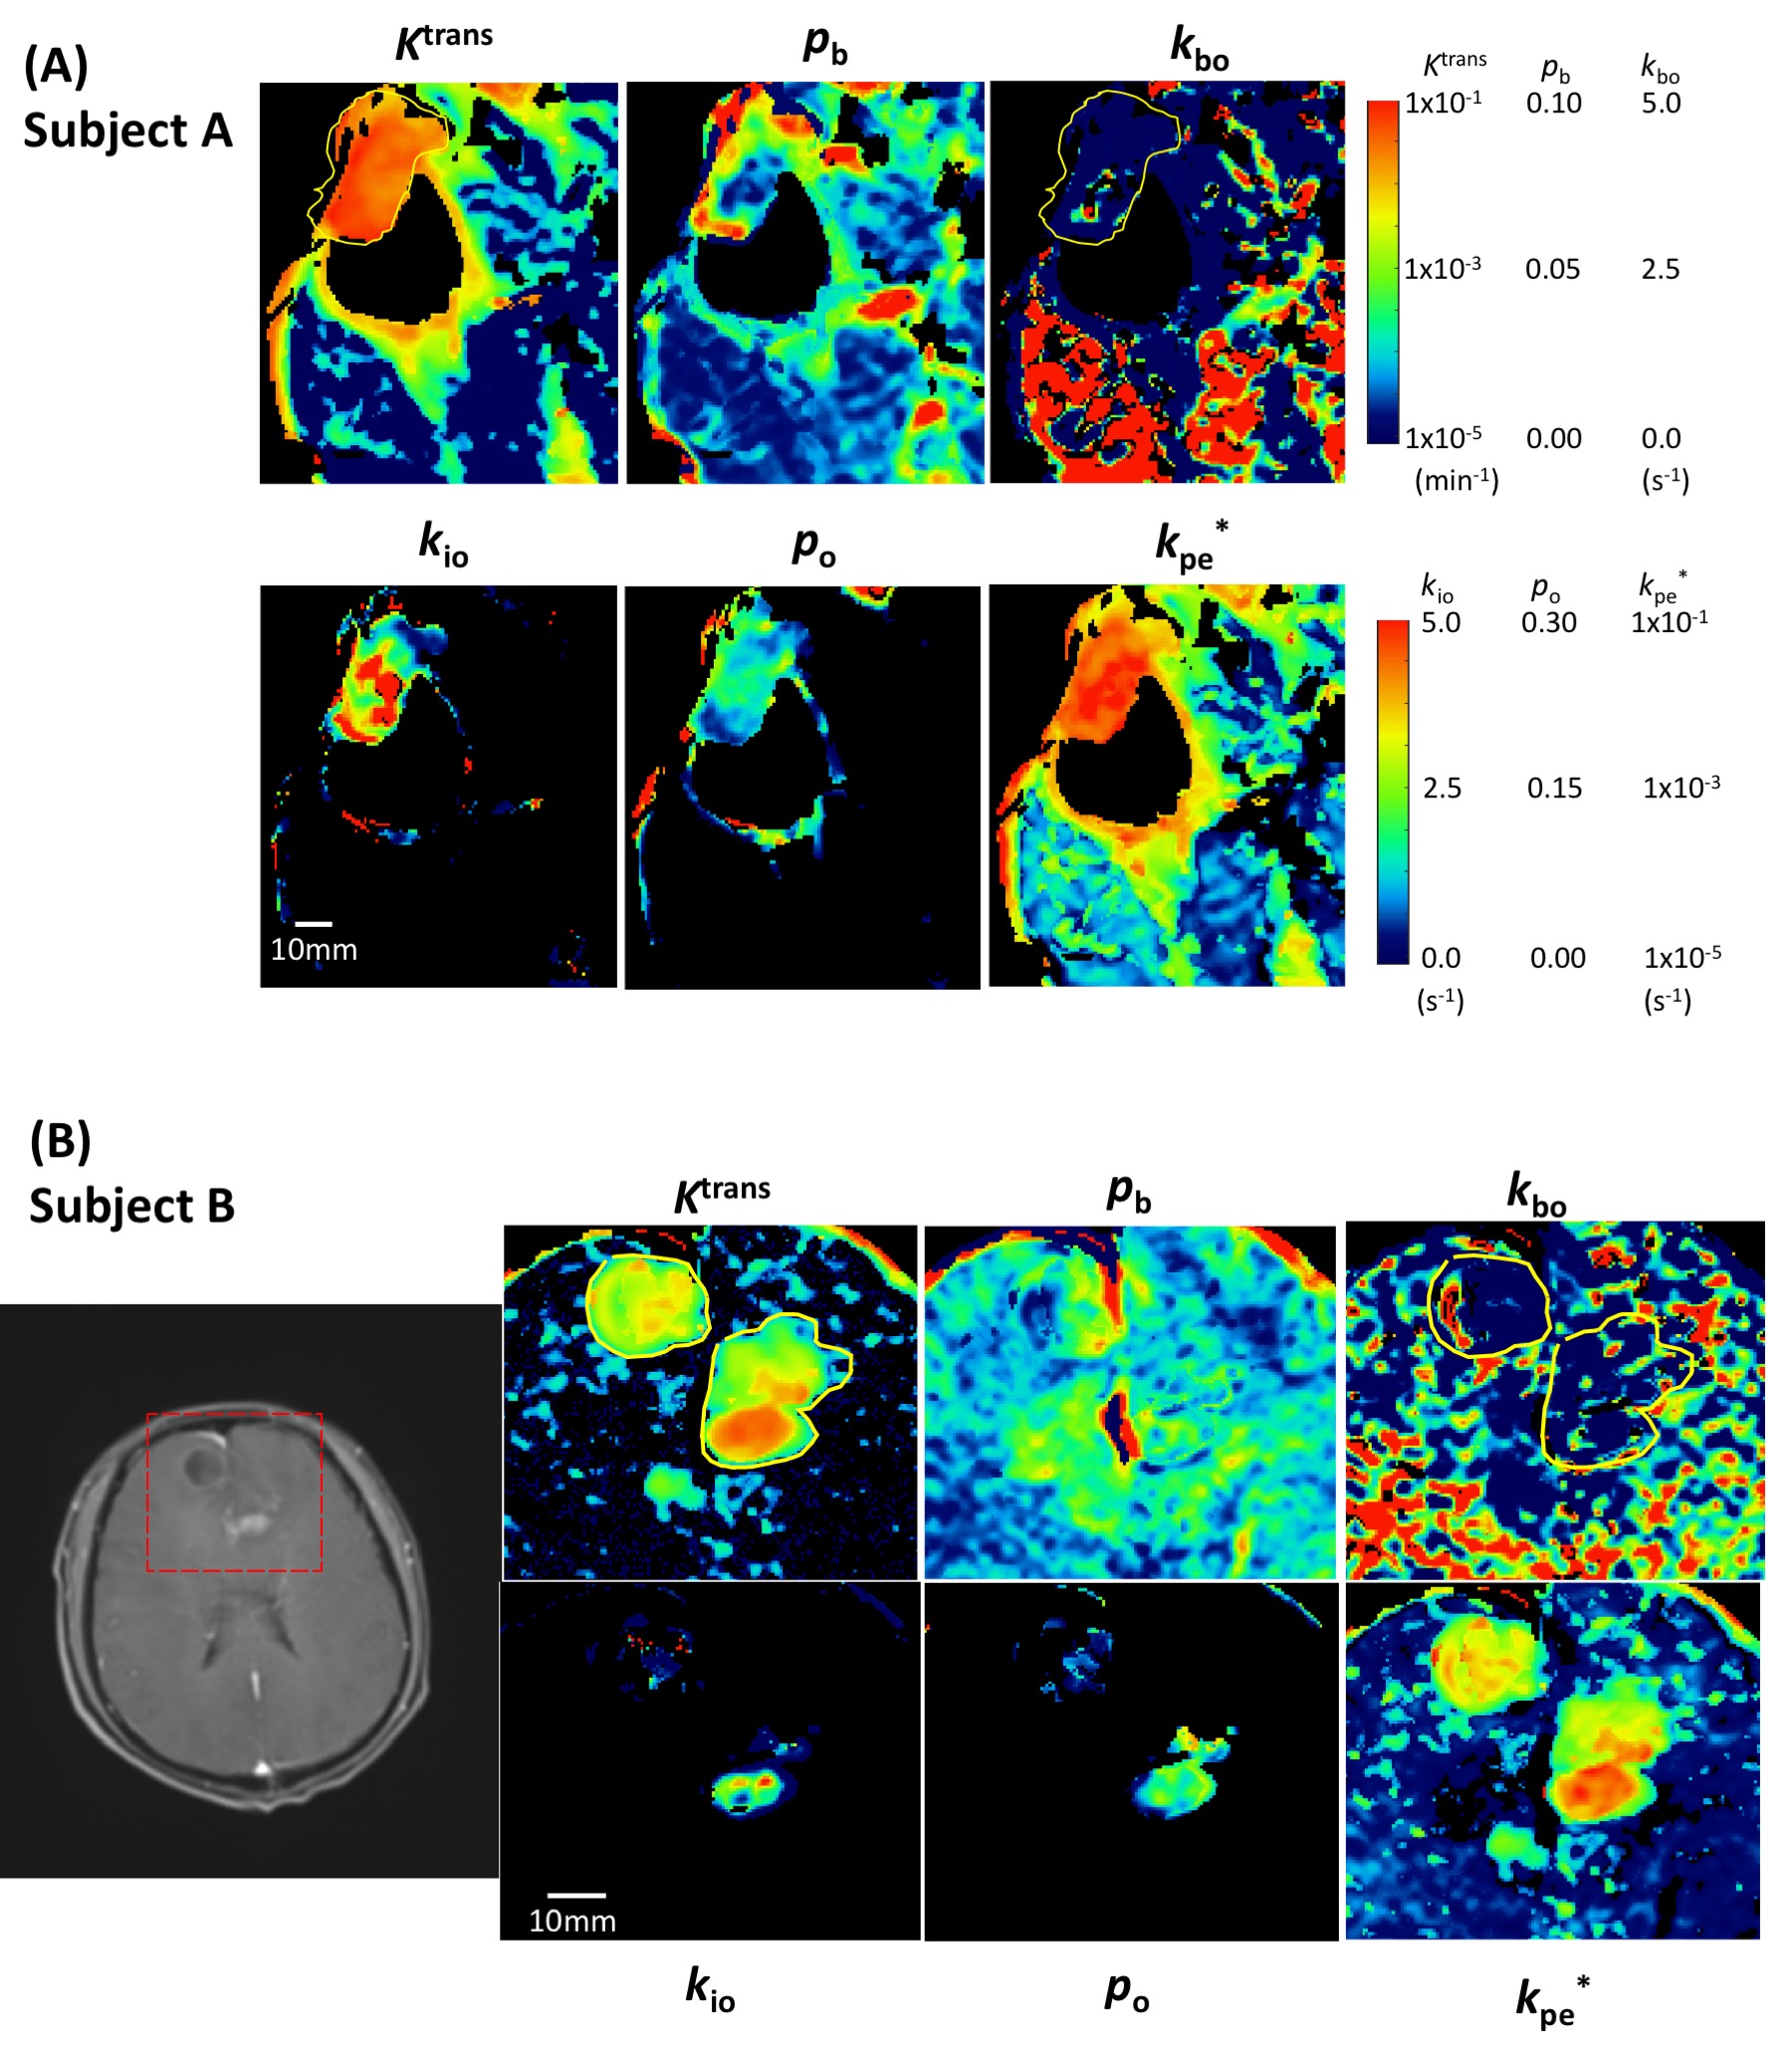
Figure 5 shows zoomed SSM parametric maps of subject A Fig. 2 slice and one slice of subject B. The Ktrans values are much larger (and rather homogenous) in extensive tumor than in NA regions in both subjects. Subject B (Fig. 5B), with GBM confirmed by biopsy diagnosis [Dx] only just after the DCE-MRI acquisition, shows smaller Ktrans elevation (0.8×10⁻² min-1 on average) than that of subject A (3.8x10⁻² min-1 on average, P < 10-10). Importantly, elevated kio is seen only in much smaller foci than Ktrans, even though it could be accurately estimated in such regions. It exhibits quite different distribution patterns than Ktrans, and between the two subjects: large kio in an annular shape [“ring-enhancement”] for A, smaller kio in a focal “hotspot” for B. These different patterns continued in several contiguous slices in each subject (not shown). Interestingly, the lesion-averaged kio in the pre-DX GBM (subject B, 0.5 s-1) is six times smaller than in the recurrent GBM (subject A, 3.1 s-1, P < 10-10).
The vascular water efflux rate constant kbo shows focal enhancements throughout the brain (Fig. 5), but suddenly decrease to near zero, in both subjects, due to neurogliovascular unit NKA activity compromise.6 In strong contrast, the mean kpe* values are two orders smaller than kbo in NAB, and rise dramatically in going from NAB to tumor (P < 10-10). These seemingly contradictory results are strong evidence for CA and H2O extravasating via different molecular pathways and for a kbo NKA contribution.
Conclusion
Within our analysis framework, the three supra-intensive rate constants kbo, kio, and kpe can be reliably determined. Pilot data for one recurrent and one pre-diagnosis GBM patient are presented to demonstrate this. For the pre-diagnostic subject, the combination of kio, kbo, and kpe maps is consistent with a new tumor, but a quite progressed malignancy for the recurrent GBM subject.Acknowledgements
We gratefully acknowledge the financial support of the National Natural Science Foundation of China (NSFC) Grant (No. 81873894), the Fundamental Research Funds for the Central Universities, the Taishan Scholars Program (No. tsqn20161070). CSS was supported by the Brenden-Colson Center for Pancreatic Care and the OHSU Advanced Imaging Research Center.References
1 Springer CS. Using 1H2O MR to measure and map sodium pump activity in vivo. J Magn Reson 2018; 291: 110–126.
2 Li X, Mangia S, Lee J-H, Bai R, Springer CS. The NMR Shutter-Speed Elucidates Apparent Population Inversion of 1H2O Signals Due to Active Trans-membrane Water Cycling. Magn Reson Med 2019; In Press. doi:10.1002/mrm.27725.
3 Bai R, Springer CS, Plenz D, Basser PJ, Dietmar J, Peter P et al. Brain active transmembrane water cycling measured by MR is associated with neuronal activity. Magn Reson Med 2019; 81: 1280–1295.
4 Bai R, Springer CS, Plenz D, Basser PJ. Fast, Na + /K + pump driven, steady-state transcytolemmal water exchange in neuronal tissue: A study of rat brain cortical cultures. Magn Reson Med 2018; 79: 3207–3217.
5 Li X, Rooney WD, Springer CS. A unified magnetic resonance imaging pharmacokinetic theory: Intravascular and extracellular contrast reagents. Magn Reson Med 2005; 54: 1351–1359.
6 Rooney WD, Li X, Sammi MK, Bourdette DN, Neuwelt EA, Springer CS. Mapping human brain capillary water lifetime: High-resolution metabolic neuroimaging. NMR Biomed 2015; 28: 607–623.
Figures