0282
Magnetization Transfer and Chemical Exchange Saturation Transfer in Glioblastoma at 1.5T: Comparison of Early and Late Tumor Progression1Physical Sciences, Sunnybrook Research Institute, Toronto, ON, Canada, 2Department of Radiation Oncology, Sunnybrook Health Sciences Centre, University of Toronto, Toronto, ON, Canada, 3Medical Biophysics, University of Toronto, Toronto, ON, Canada, 4Department of Neurosurgery and Pediatric Neurosurgery, Medical University, Lublin, Poland
Synopsis
This study aims to quantify the MT and CEST parameters in glioblastoma at 1.5T over four time points of chemoradiation. Previous approaches to quantify the MT/CEST signal in terms of response to treatment were at higher field strengths. Additionally, we analyzed different subregions within the clinical target volume and gross tumor volume, generated by thresholding based on the T1-weighted, FLAIR and DWI scans, for comparing the MT/CEST parameters between the early and late tumor progression. Results indicated that MT/CEST at 1.5T can be used for monitoring therapy and that the results depend on the specific tumor region analyzed.
Introduction
Glioblastoma multiforme (GBM) is the most aggressive and the most common form of brain tumor. The patient outcomes are poor despite standard treatment involving surgical resection, radiation therapy and chemotherapy1. Saturation transfer MRI, including quantitative magnetization transfer (MT)2-3 and amide proton transfer (APT) chemical exchange saturation transfer (CEST)4, have shown promise for monitoring response to treatment of brain tumors5-12. These CEST studies have been conducted at 3T or above. Recently, the feasibility of APT CEST at 1.5T was shown in a healthy human brain using a pulsed saturation method13. Using this approach13, we quantified the MT/CEST signal in GBM patients at 1.5T for distinguishing between early and late tumor progression.In addition, since GBM tumors are spatially heterogeneous, we quantified the parameters over different tumor subregions defined based on thresholding the standard T1-weighted, FLAIR, and DW images. Subregions with signal characteristics related to those of a previous study that were found to be correlated with overall survival14 were examined. The median parameter values within each region were compared between early and late progression groups.
Methods
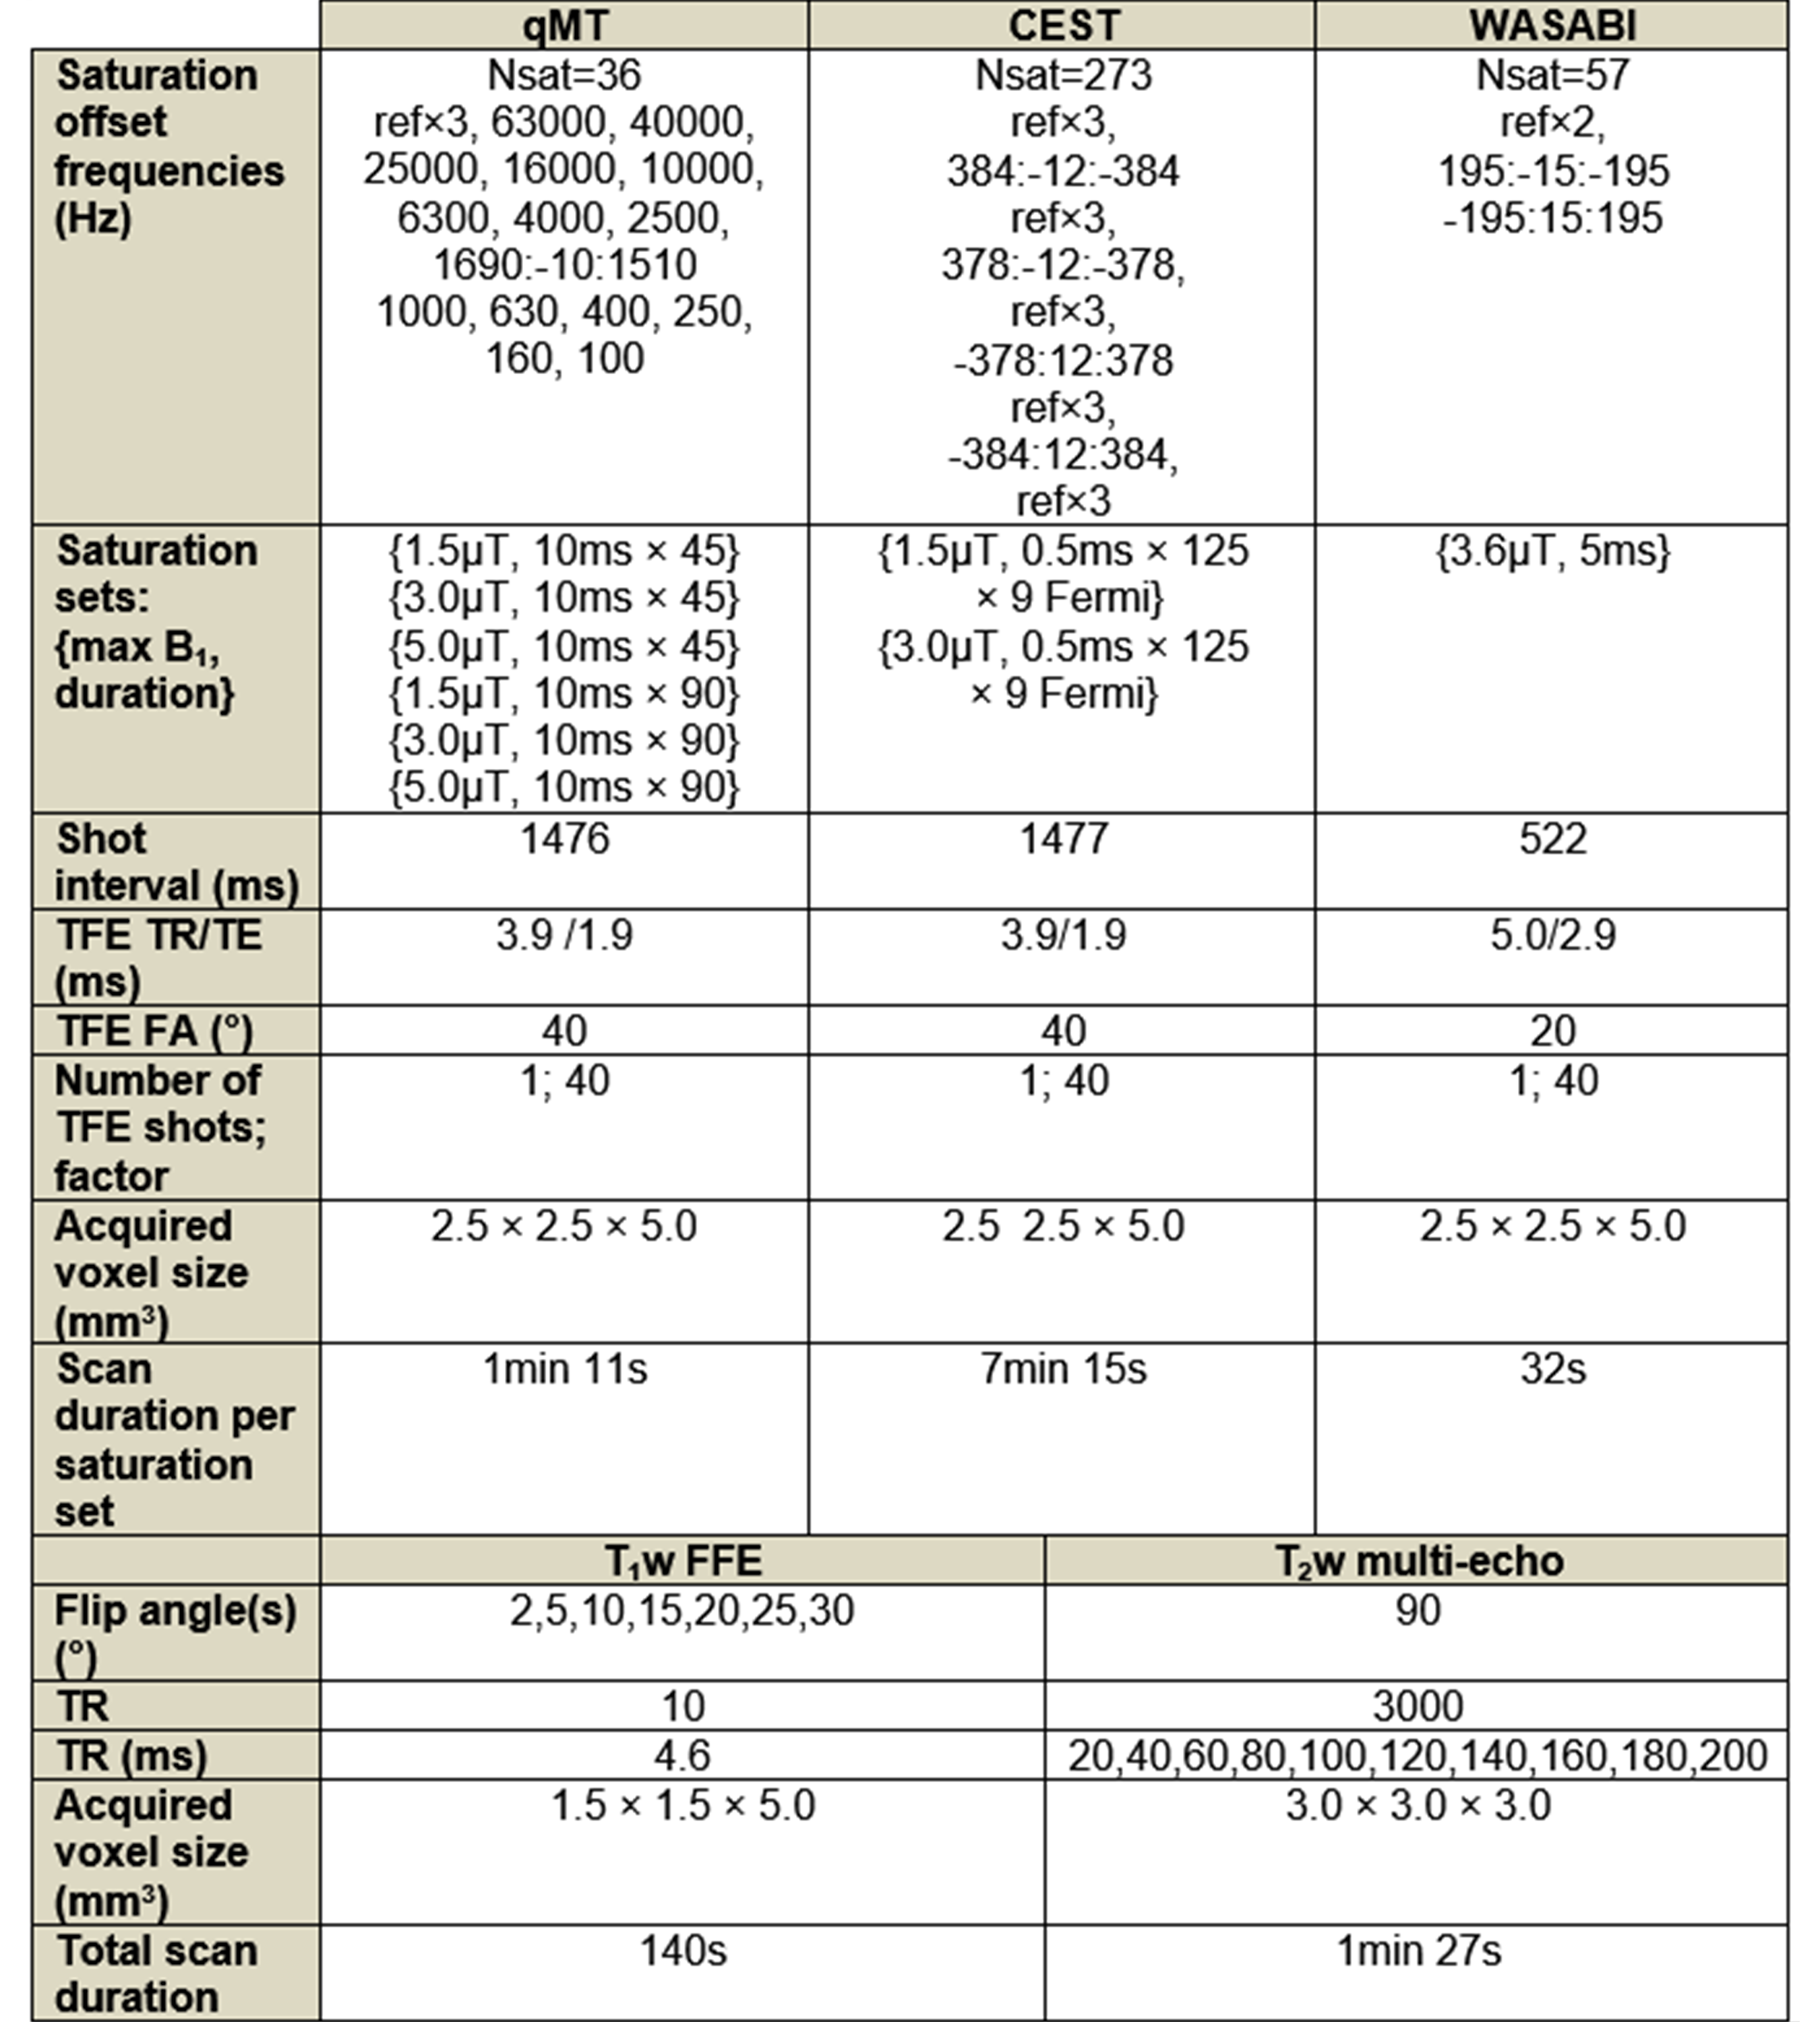
GBM study: Approval from the institutional research ethics board and informed consent from patients were obtained. Data from 34 patients (treated with intensity modulated radiation therapy with dose of 2 Gy per session with concurrent temozolomide) were analyzed. MRI was performed at four time points – at day 0 (“D0”) before radiation treatment, at fraction 10 and 20 of treatment (corresponding to days “D14” and “D28”, respectively) and 1 month following the final treatment fraction (“D70”).MR protocol: Data were acquired on a 1.5T Philips Ingenia system. Standard clinical sequences included pre-contrast T1-weighted (“T1w”), post-contrast T1w (“T1w+C”), FLAIR and DWI scans. For saturation, MT and CEST sequences used short, block pulses designed to overcome the RF amplifier limitations on this scanner13. T1/T2/B0/B1 maps were acquired. MR parameters are shown in Figure 1.
Image pre-processing: The T1w+C and FLAIR volumes were registered to the T1w volume using the “flirt” function from FSL15, with 2D slices extracted to match the scanned MT/CEST slice. For CEST, motion correction across the saturation frequencies was performed using the FSL “mcflirt” function. The clinical target volumes (CTV) and gross tumor volumes (GTV), delineated based on T1w+C, were obtained for each time point.
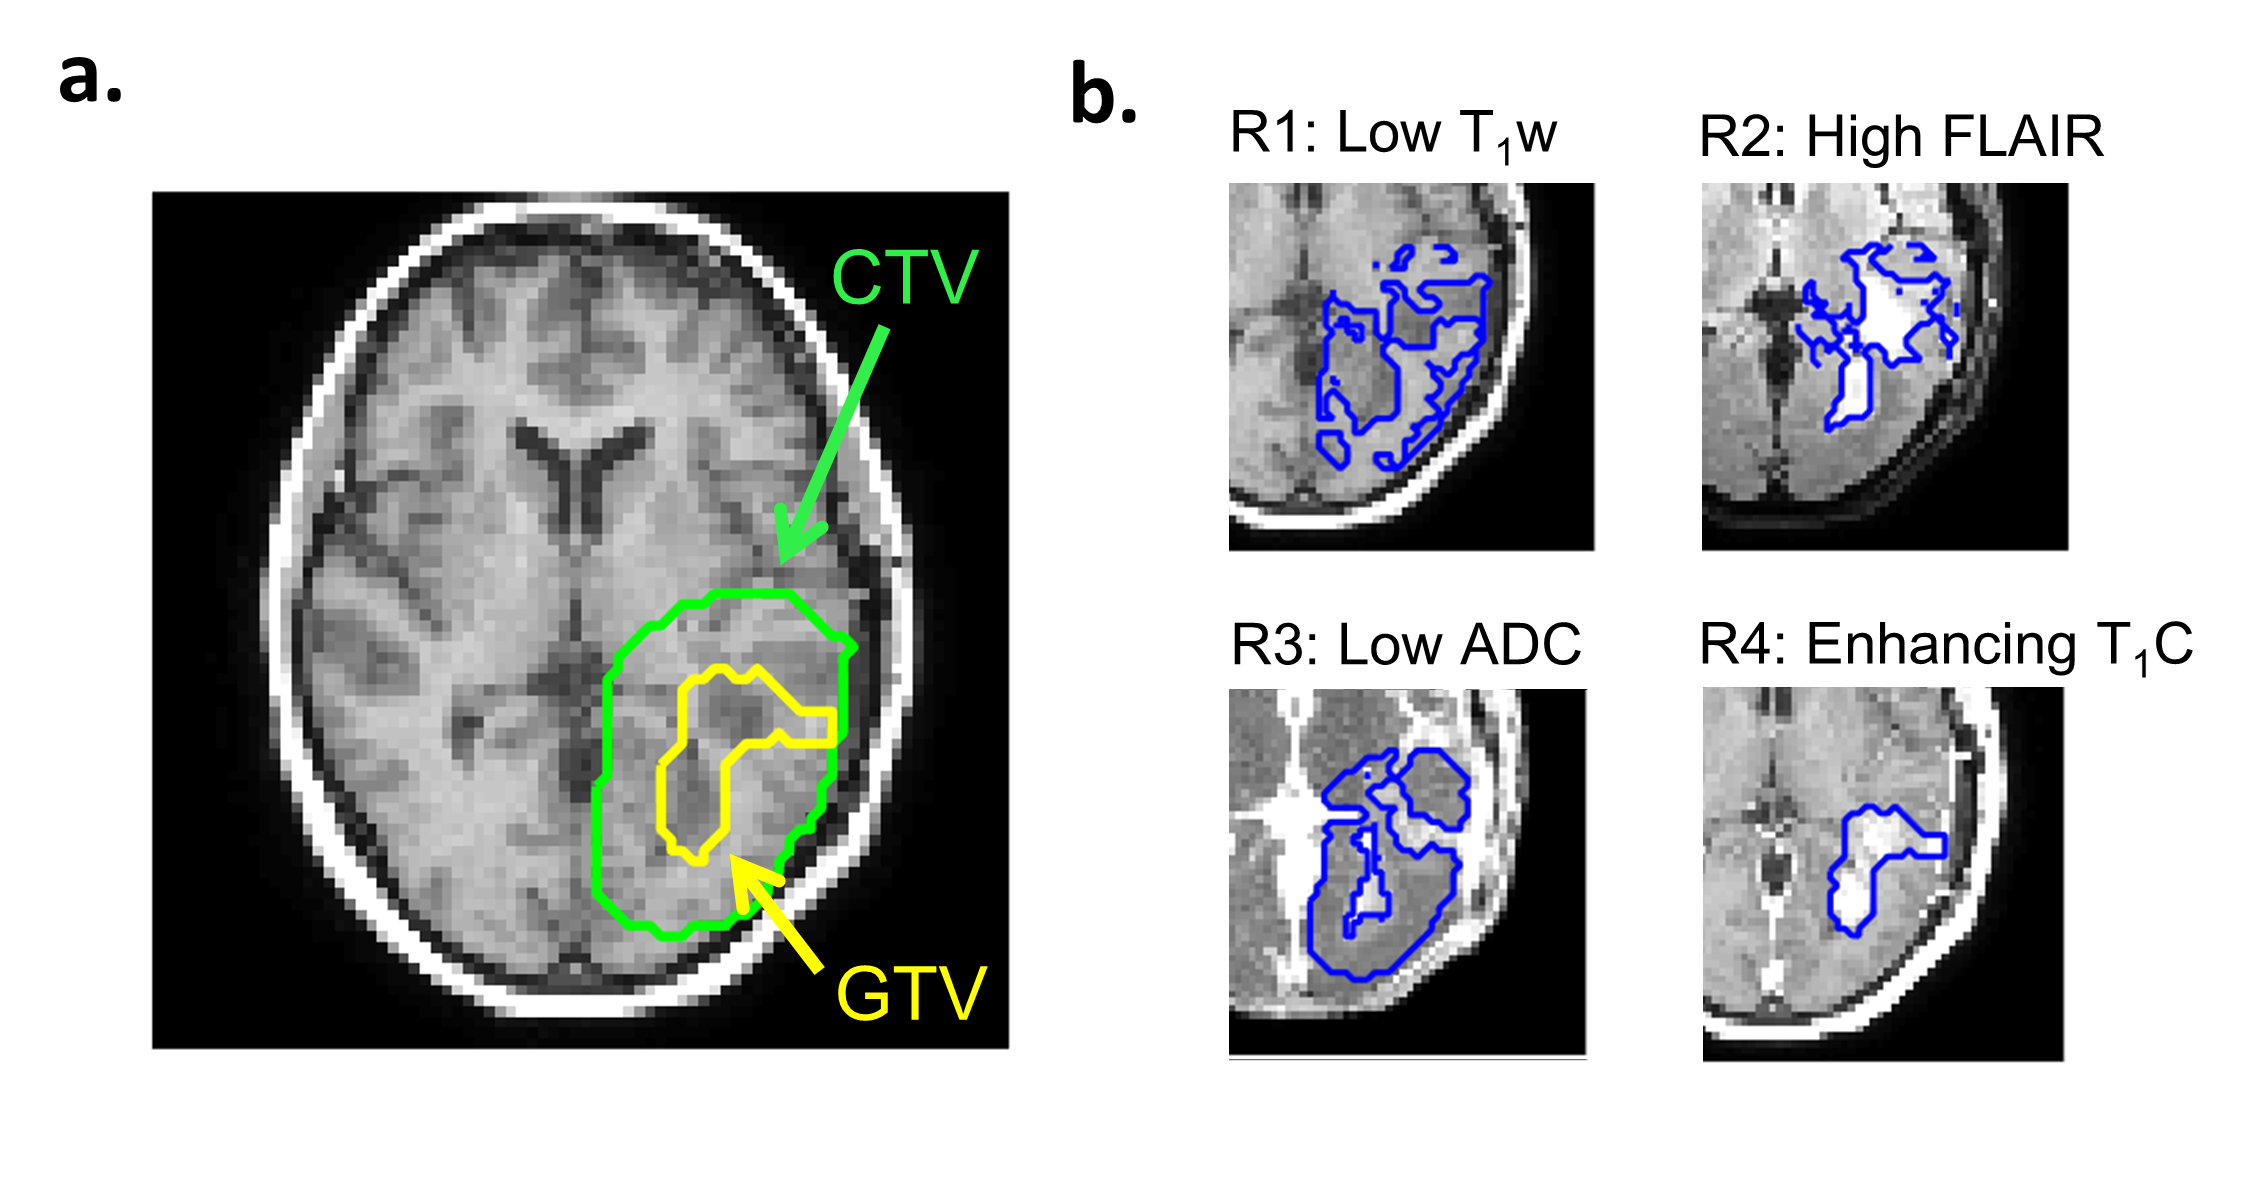
Tumor subregions: In addition to the GTV and CTV, four subregions were analyzed. The subregions were generated by classifying pixels into high or low signal regions based on thresholding. For regions R1-R3, the thresholds were defined as the mean D0 signal within the CTV averaged over the entire patient cohort, from each of the T1w, FLAIR and ADC images, respectively. For subregion R4, the enhancing area within the GTV was determined based on increased signal on T1w+C compared to T1w.
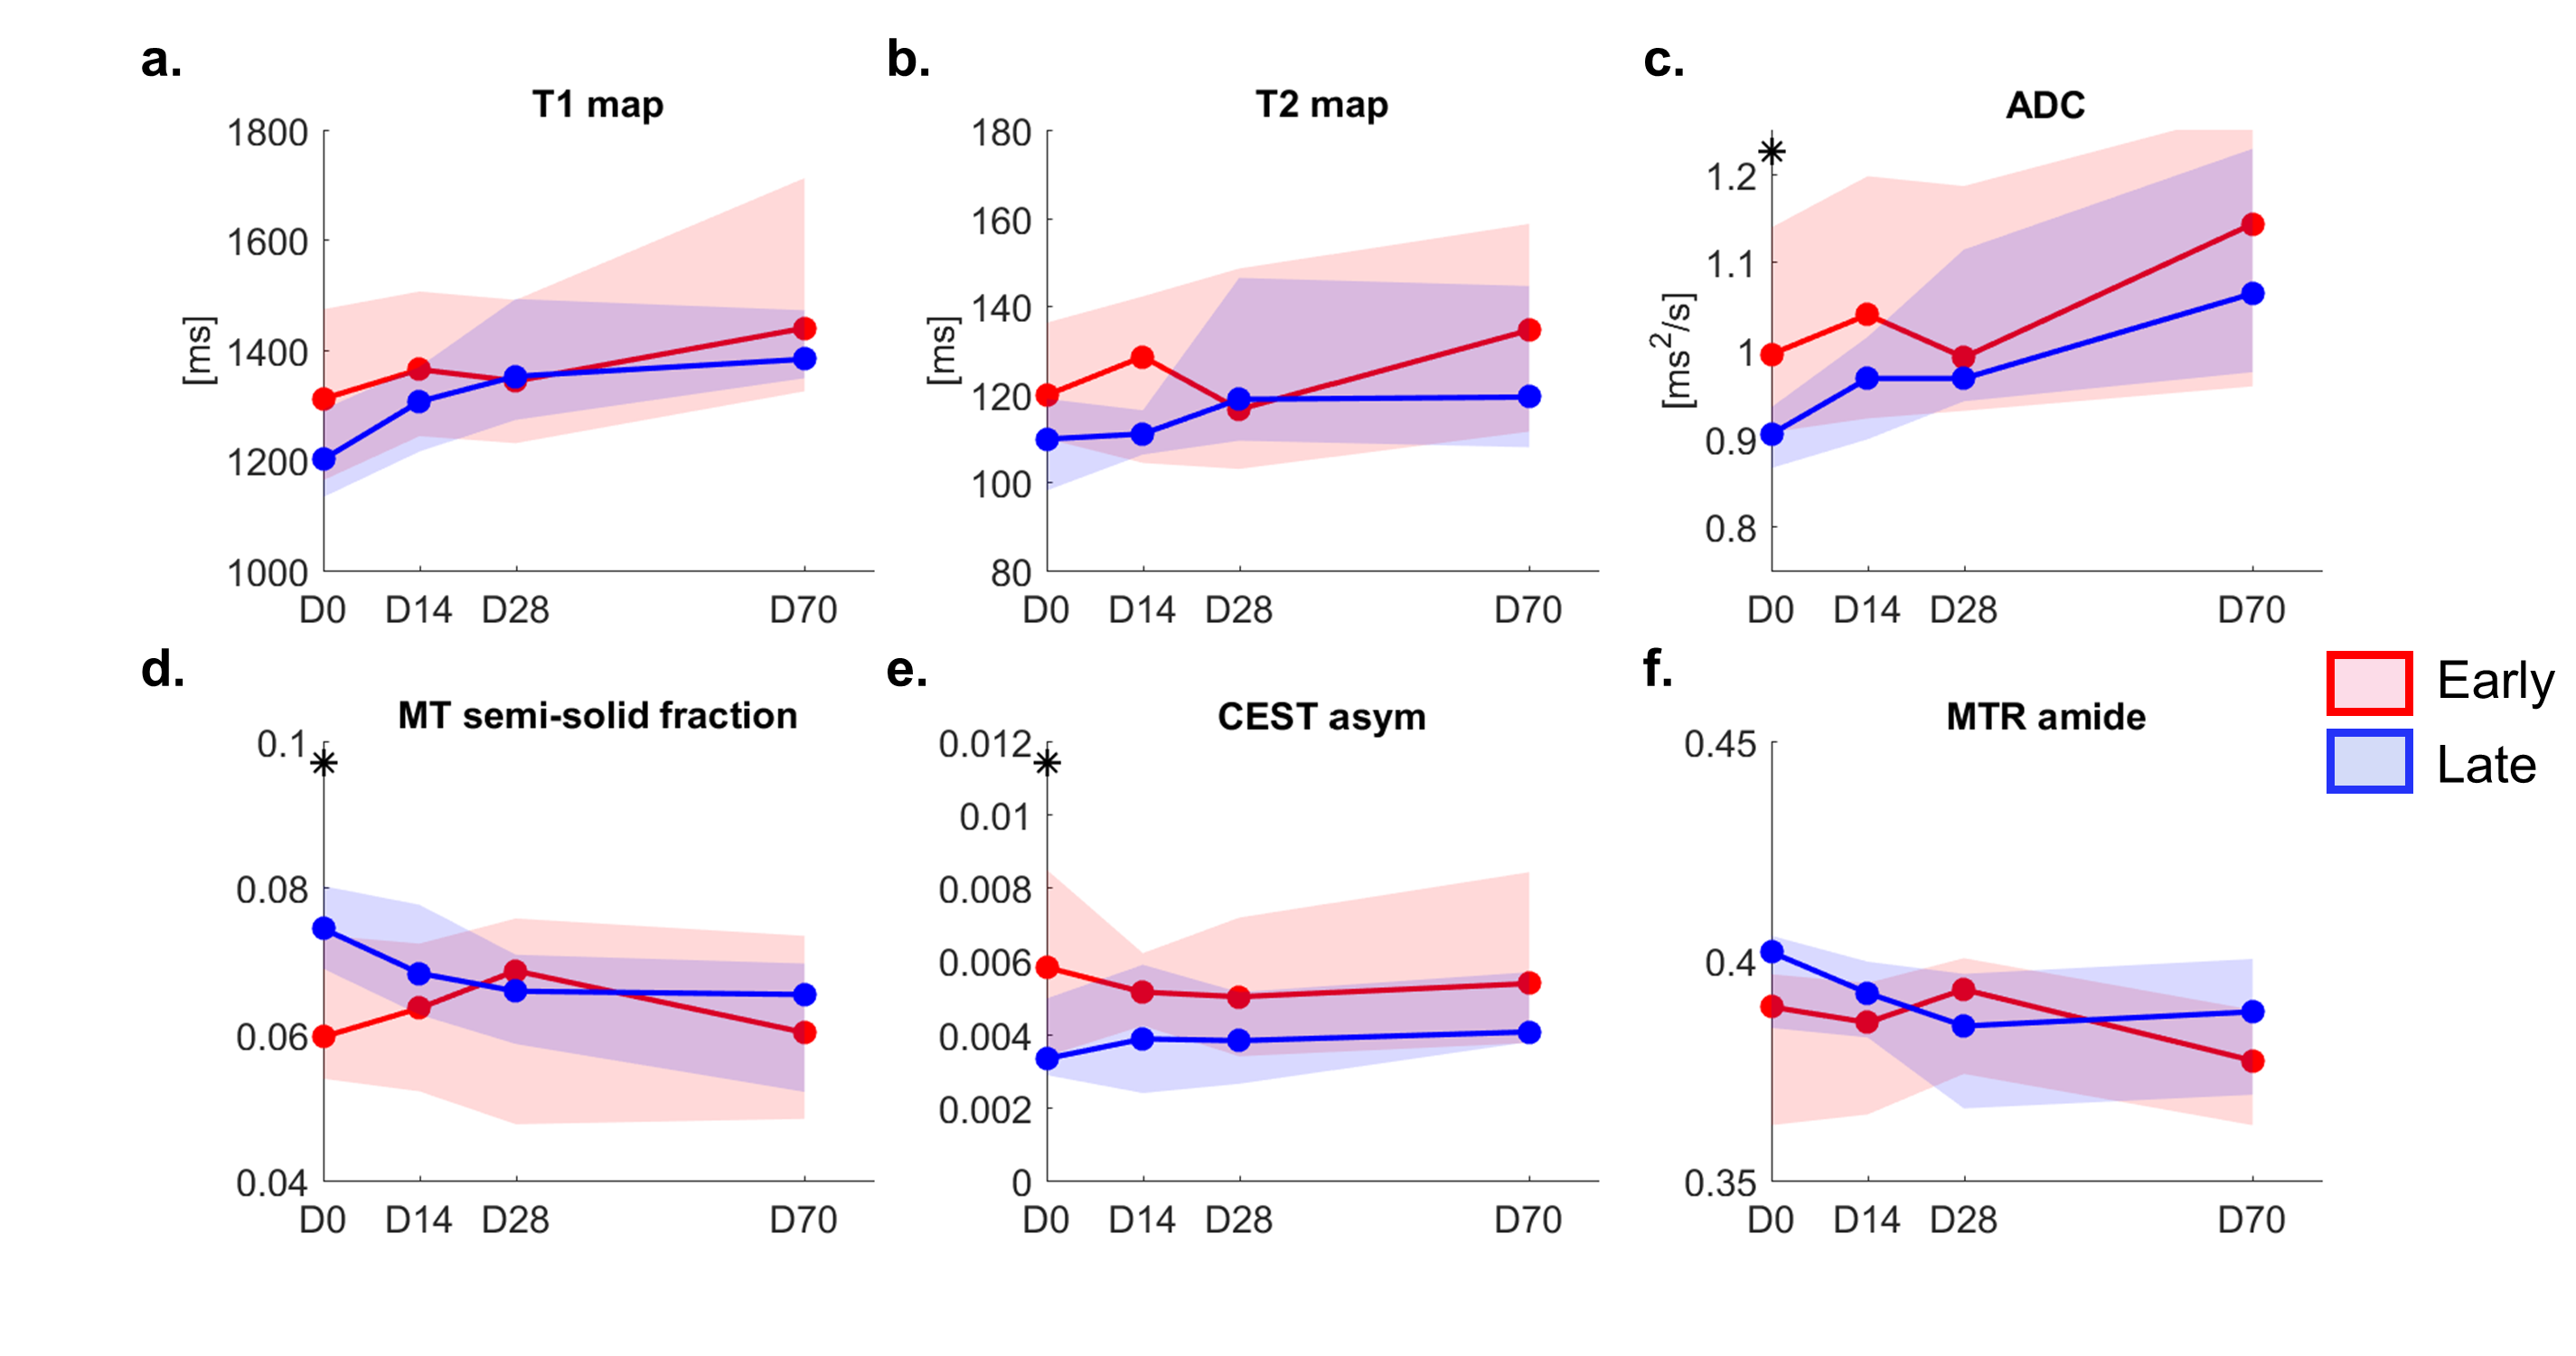
Parameter fitting and analysis: Pulsed saturation data were fitted to the Bloch-McConnell model as in previous work13. The MT semisolid fraction, CEST parameters (including asymmetry, MTRAmide and MTRNOE, between 2-4ppm), ADC, T1 and T2 maps were quantified. Tumor progression was assessed at 6.9 months (=209 days)1, with early or late progression categories for tumors that progressed before or after 209 days, respectively. Differences between early and late progression groups were computed using the Wilcoxon Rank-Sum test for each time point, region and parameter.
Results and Discussion
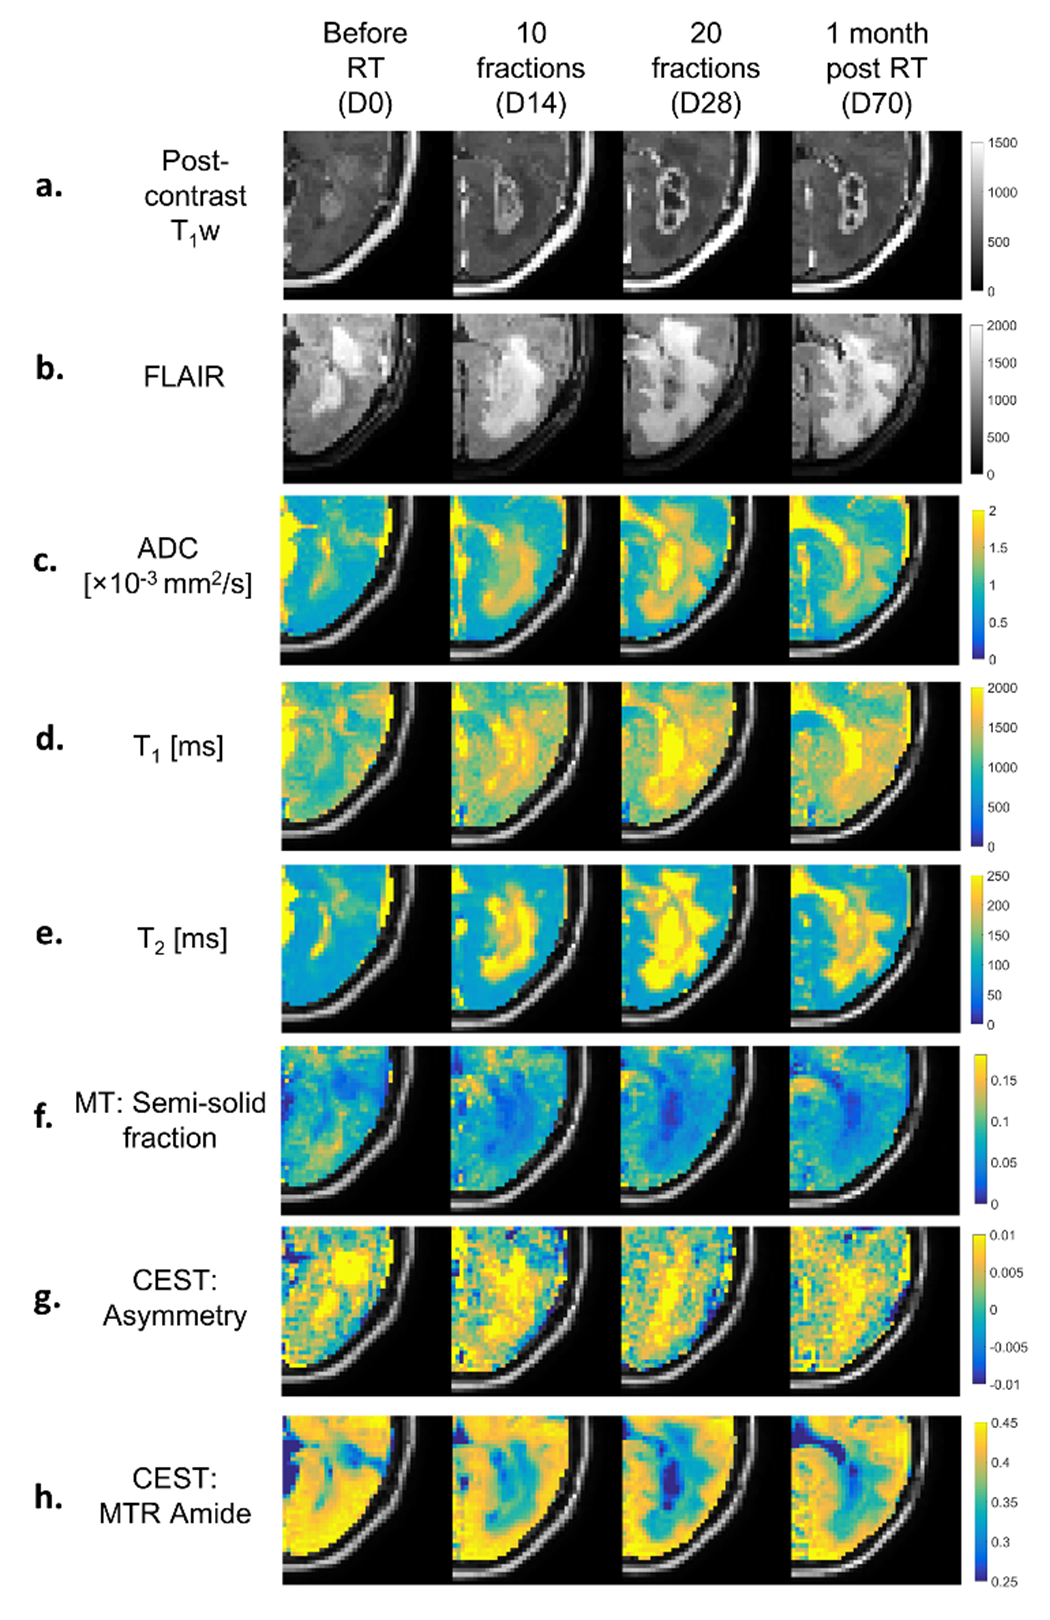
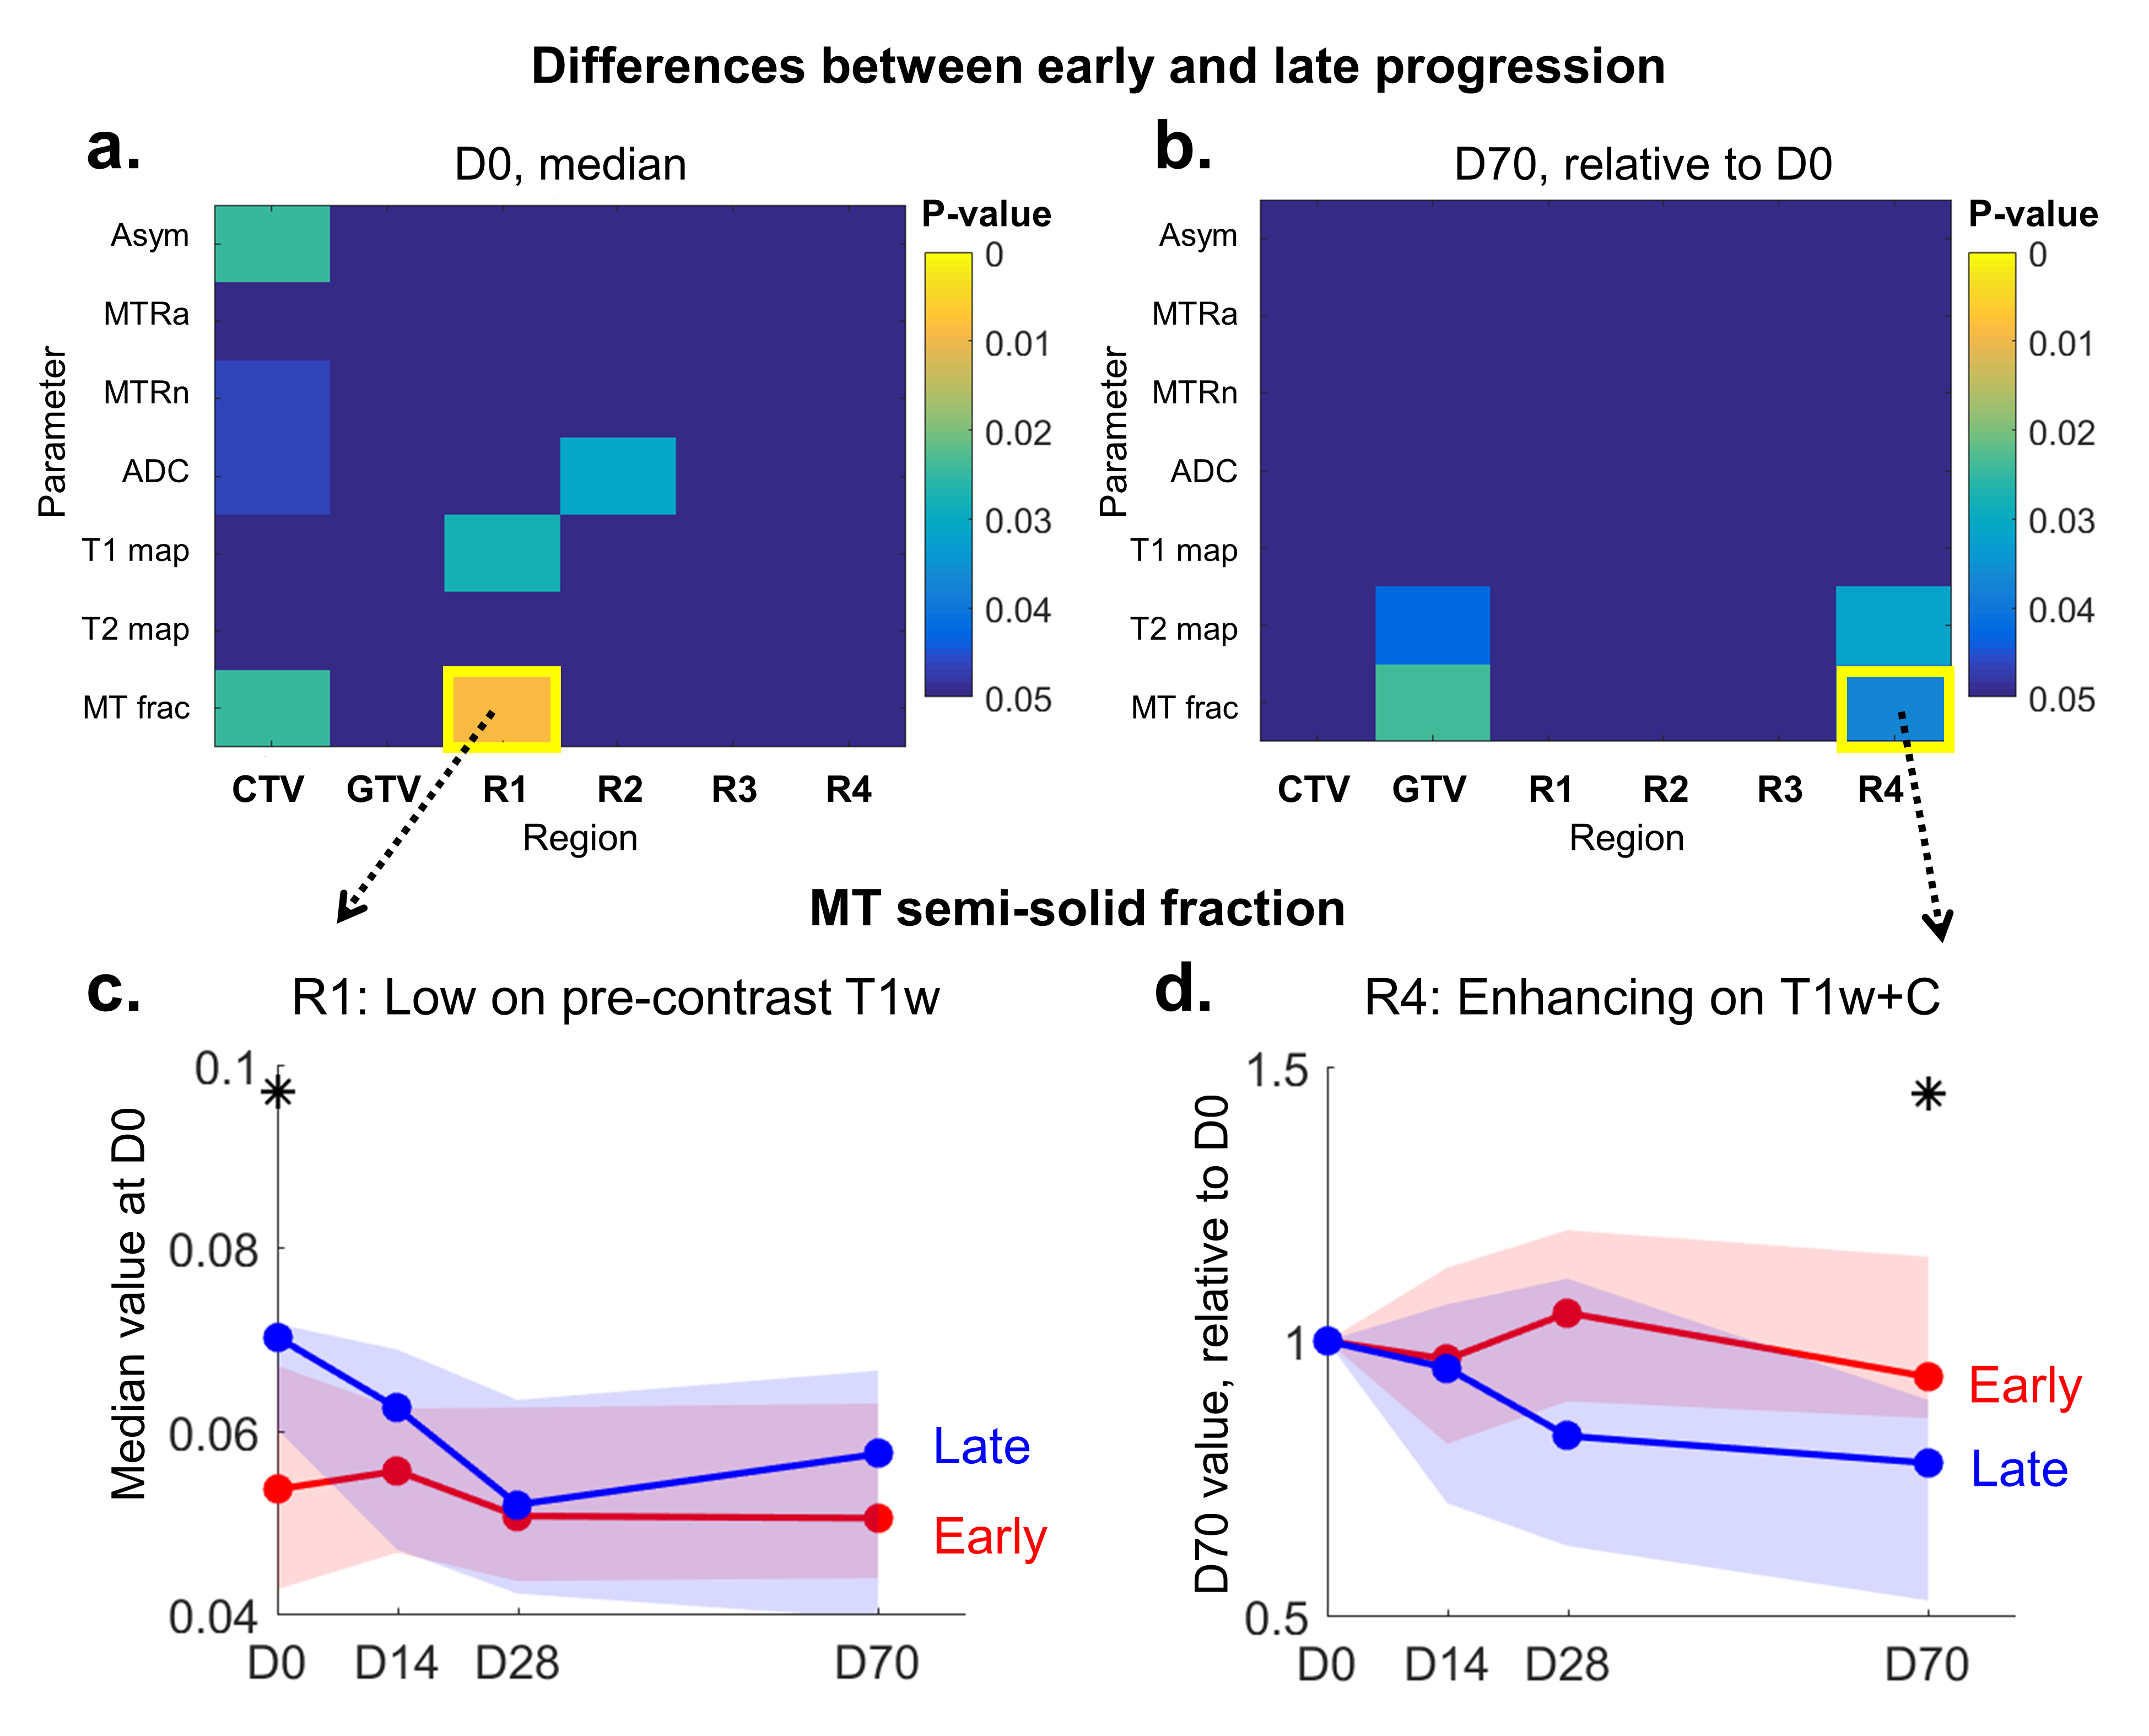
Clinical images and parameter maps for a selected GBM tumor are shown across time points in Figure 2. The central tumor region had lower signal for the semisolid fraction (M0B) and CEST MTRAmide maps, and higher signal on the CEST asymmetry maps, compared to surrounding regions. In Figure 3, the CTV and GTV are shown of the thresholded subregions at D0.In Figure 4, results comparing early and late progression over the CTV region are shown. At D0, the median MT semisolid fraction, CEST asymmetry and ADC were significantly different between the early/late groups (p<0.05). The values for early and late progression, respectively, were 6.0% (CI=[5.4, 7.4]%) and 7.4% (CI=[6.9,8.0]%) for the MT semisolid fraction, 0.58% (CI=[0.34, 0.85]%) and 0.33% (CI=[0.29,0.50]%) for CEST asymmetry, and 1.0×10⁻³mm2/s (CI=[0.91,1.1]×10-3mm2/s) and 0.9×10⁻³mm2/s (CI=[0.87,0.93]×10-3mm2/s) for ADC.
When thresholding was applied, there were increased differences in the MT fraction for the subregion R1 with low T1w signal compared to when the entire CTV was analyzed, as shown in Figure 5a,c. Additional differences were seen in the T1 value at D0 (Figure 5a). Difference in the CEST asymmetry was only apparent in the CTV and not in the thresholded subregions. Figures 5b,d show signal changes relative to D0, with differences in MT fraction and T2 value seen at D70 in the enhancing region R4. Differences were also present for the GTV at D70.
Conclusion
MT/CEST at 1.5T can be used for tracking the signal changes in GBM during chemoradiation. Significant differences were seen between early and late progression groups at certain time points and thresholded regions. Our results were dependent on the specific tumor region analyzed, suggesting that for robustness especially in heterogeneous tumors, subregions should be included for quantifying parameter maps to monitor response to therapy.Acknowledgements
We gratefully acknowledge funding from NSERC (RGPIN-2017-06596, CRD 507521-16), Terry Fox (New Frontiers Program Project Grant) and CIHR.References
1. Stupp R, Mason WP, Van Den Bent MJ, Weller M, Fisher B,
Taphoorn MJ, Belanger K, Brandes AA, Marosi C, Bogdahn U, Curschmann J.
Radiotherapy plus concomitant and adjuvant temozolomide for glioblastoma. New
England Journal of Medicine. 2005 Mar 10;352(10):987-96.
2. Wolff SD, Balaban RS. Magnetization transfer contrast
(MTC) and tissue water proton relaxation in vivo. Magn Reson Med.
1989;10(1):135–144.
3. Henkelman RM, Huang X, Xiang QS, Stanisz GJ, Swanson
SD, Bronskill MJ. Quantitative interpretation of magnetization transfer.
Magnetic resonance in medicine. 1993 Jun;29(6):759-66.
4. Wolff SD, Balaban RS. NMR imaging of labile proton
exchange. Journal of magnetic resonance. 1990;86:164-9.
5. Mehrabian H, Myrehaug S, Soliman H, Sahgal A, Stanisz
GJ. Evaluation of Glioblastoma Response to Therapy With Chemical Exchange
Saturation Transfer. Int J Radiat Oncol Biol Phys. 2018 Jul 1;101(3):713-723.
doi: 10.1016/j.ijrobp.2018.03.057.
6. Mehrabian, H., Desmond, K. L., Soliman, H., Sahgal, A.
& Stanisz, G. J. Differentiation between Radiation Necrosis and Tumor
Progression Using Chemical Exchange Saturation Transfer. Clin. Cancer Res.
clincanres.2265.2016 (2017). doi:10.1158/1078-0432.CCR-16-2265
7. Jones CK, Schlosser MJ, Van Zijl PC, Pomper MG, Golay
X, Zhou J. Amide proton transfer imaging of human brain tumors at 3T. Magnetic
Resonance in Medicine: An Official Journal of the International Society for
Magnetic Resonance in Medicine. 2006 Sep;56(3):585-92.
8. Zhou J, Zhu H, Lim M, Blair L, Quinones‐Hinojosa
A, Messina SA, Eberhart CG, Pomper MG, Laterra J, Barker PB, Van Zijl PC. Three‐dimensional
amide proton transfer MR imaging of gliomas: initial experience and comparison
with gadolinium enhancement. Journal of Magnetic Resonance Imaging. 2013
Nov;38(5):1119-28.
9. Scheidegger R, Wong ET, Alsop DC. Contributors to
contrast between glioma and brain tissue in chemical exchange saturation
transfer sensitive imaging at 3 Tesla. Neuroimage. 2014 Oct 1;99:256-68.
10. Regnery
S, Adeberg S, Dreher C, Oberhollenzer J, Meissner JE, Goerke S, Windschuh J,
Deike-Hofmann K, Bickelhaupt S, Zaiss M, Radbruch A. Chemical exchange
saturation transfer MRI serves as predictor of early progression in
glioblastoma patients. Oncotarget. 2018 Jun 19;9(47):28772.
11. Jiang
S, Eberhart CG, Lim M, Heo HY, Zhang Y, Blair L, Wen Z, Holdhoff M, Lin D,
Huang P, Qin H. Identifying Recurrent Malignant Glioma after Treatment Using
Amide Proton Transfer-Weighted MR Imaging: A Validation Study with Image-Guided
Stereotactic Biopsy. Clinical Cancer Research. 2018 Jan 1:clincanres-1233.
12. Ma
B, Blakeley JO, Hong X, et al. Applying amide proton transfer-weighted MRI to
distinguish pseudoprogression from true progression in malignant gliomas. J
Magn Reson Imaging 2016; 44:456–462.
13. Chan
RW, Myrehaug S, Stanisz GJ, Sahgal A, Lau AZ. Quantification of pulsed
saturation transfer at 1.5 T and 3T. Magnetic resonance in medicine. 2019 Jun
22.
14. McGarry
SD, Hurrell SL, Kaczmarowski AL, Cochran EJ, Connelly J, Rand SD, Schmainda KM,
LaViolette PS. Magnetic resonance imaging-based radiomic profiles predict
patient prognosis in newly diagnosed glioblastoma before therapy. Tomography.
2016 Sep;2(3):223.
15. Jenkinson,
M., Bannister, P., Brady, J. M. and Smith, S. M. Improved Optimisation for the
Robust and Accurate Linear Registration and Motion Correction of Brain Images.
NeuroImage, 17(2), 825-841, 2002.
Figures