0281
Characterization of CT-2A neurosphere-derived high-grade glioma in mice.1Biomedical MRI, University of Leuven, Leuven, Belgium, 2Department of Oncology, University of Leuven, Leuven, Belgium
Synopsis
Several promising treatments against high-grade gliomas (HGGs) failed to provide significant benefit when translated from the preclinical setting to patients. Improving animal models is fundamental to overcome this translational gap. We have developed and comprehensively characterized in-vivo model based on the orthotopic implantation of CT-2A cells cultured in neurospheres (NS). Anatomical, metabolic (MRS) and perfusion MRI indicated that CT-2A NS-derived tumors showed a more HGG-like behavior, which was supported by survival data, increased glioma stem cell population and enhanced neoangiogenesis. Because of these specific features, the CT-2A NS-derived model represents a high-translational platform for the search of new HGG treatments.
INTRODUCTION
The failure of current standard therapy for high grade gliomas (HGGs) to prevent relapse of tumor growth and to extend the median survival beyond 15 months requires alternative therapies and preclinical models for their assessment and to improve our knowledge of HGG biology [1]. However, the inability of animal models to accurately mimic the clinical scenario probably played a relevant role in weakening the validity of preclinical studies and drastically reducing their translational impact. A tumor model using monolayer-cultured CT-2A (ML/CT-2A) cells was developed for implantation in immune-competent C56BL/6J mice, giving rise to orthotopic HGGs [3]. Cullturing CT-2A cells in neurospheres (NS/CT-2A) induces an increase of the GSC population compared to the standard ML conditions [4]. We have used this model to generate brain tumors in vivo [4]. It is the aim of this study to further characterize differences between tumors derived from ML/ and NS/CT-2A cells by using a multimodal/ multiparametric in vivo imaging approach.MATERIAL AND METHODS
Cell culture and animal experimentsCT-2A cells were cultured as mono-layers (ML) and neurospheres (NS) as described recently [4].
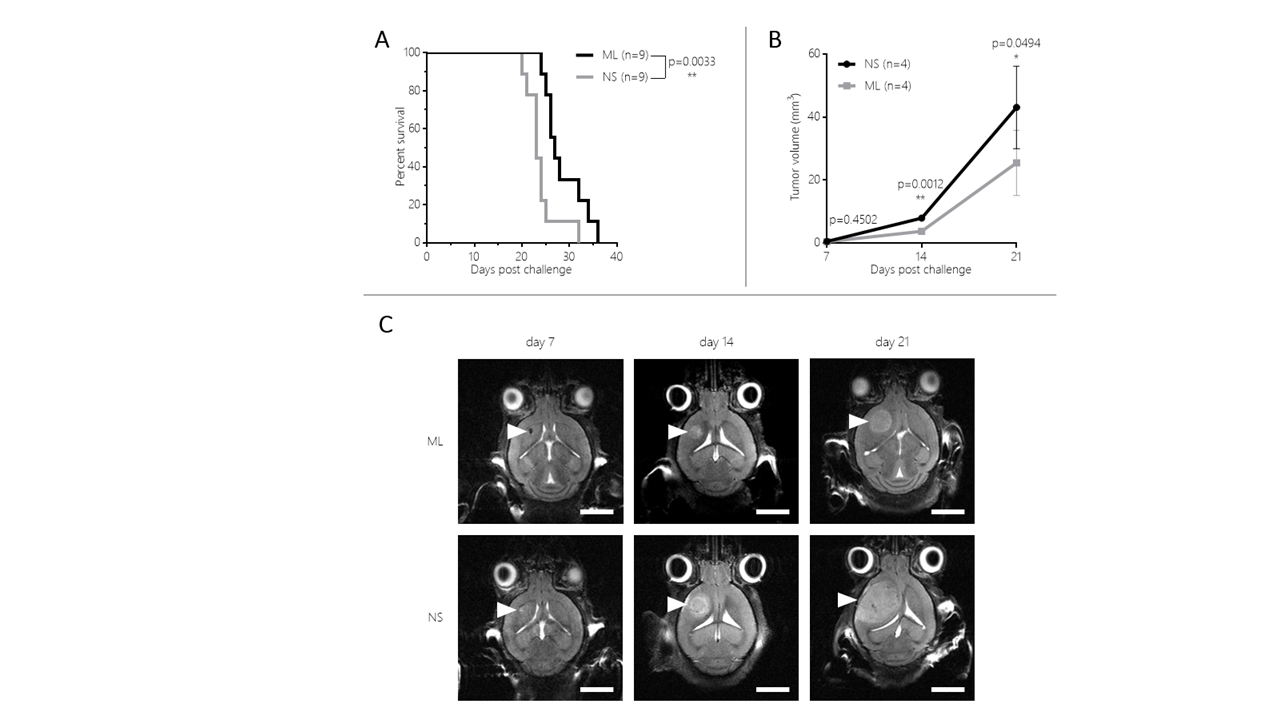
CT-2A cells were injected intracranially in C57BL/6J mice using a stereotactic frame as described [4]. Nine animals received NS/CT-2A and nine animals received ML/CT-2A. Animals were imaged weekly (up to three weeks). After reaching a human end point, brains were harvested for immunohistochemistry and assessment of tumor-infiltrating immune cells.
Multimodal/ multiparametric imaging
In vivo imaging was performed on a 7T Biospec small animal MR system (Biospec 70/30, Bruker BioSpin, Ettlingen, Germany) equipped with an Albeira SiPM based PET insert (Bruker BioSpin) [5]. MR images were acquired with a quadrature volume radio-frequency coil for transmission and a mouse brain surface coil for detection (Bruker Biospin).
The following imaging data have been acquired:
- Anatomical T2-weighted (T2w) RARE, RARE factor 8, TR/TE 2843.5/35ms, FOV 25×25 mm, matrix 256x256, 25 slices (axial) of 0.5mm thickness
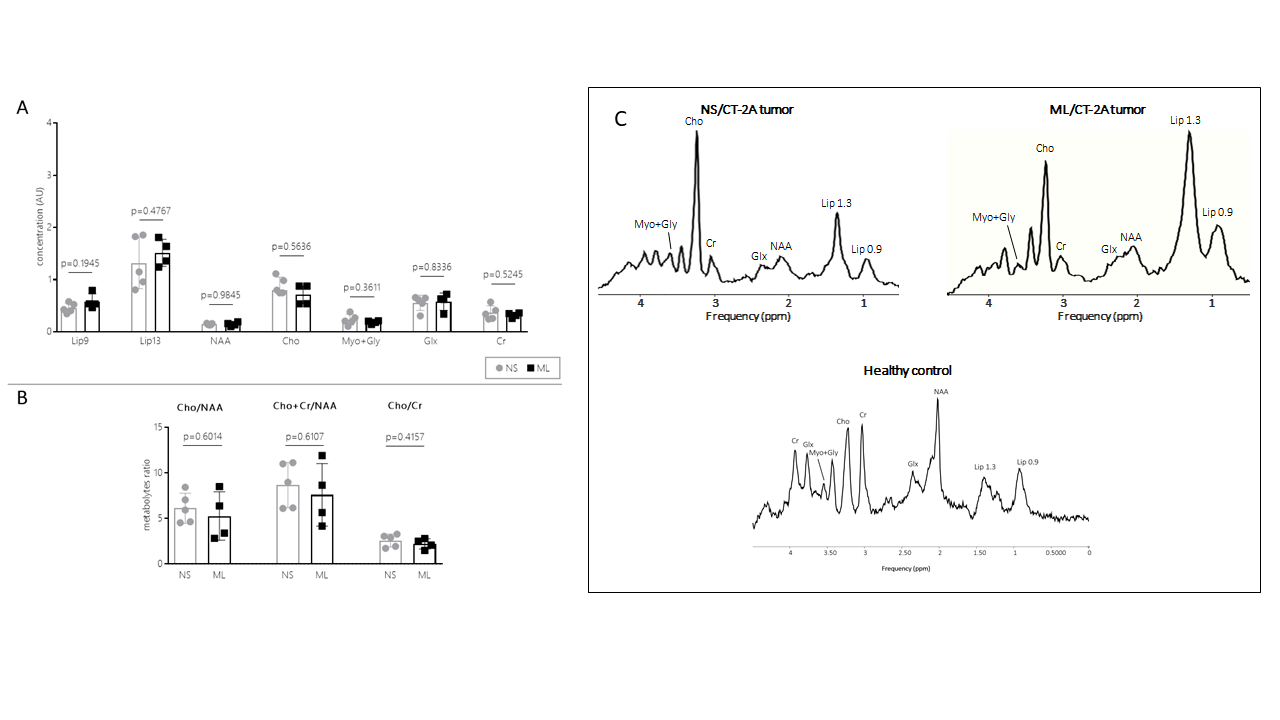
- MR spectroscopy were acquired on day 19 using a PRESS sequence with TR/ TE = 2000/ 20 ms, 320 averages, 3301 Hz spectral width of and 2048 sampling points. A VOI (2.5x2.5x2.5 or 3.0x3.0x3.0 mm3) was placed in the tumor area maximizing the amount of tumor tissue present in the voxel. Water signal was suppressed using VAPOR. Spectra were processed and quantified using jMRUI v6.0 (www.jmrui.eu) [6, 7] and the in house-developed software SPID [8]. Metabolites concentrations were expressed in arbitrary units (AU).
- DCE-MRI scans were acquired using FLASH, TR/ TE = 84/ 2.9ms, FA = 40°, 100 repetitions, temporal resolution = 7.199 s, 4 slices (slice thickness = 1 mm, slice gap = 0.2 mm), isotropic in-plane resolution = 0.23 mm. Gadopentetate dimeglumine (Magnevist ® - Bayer) was injected i.v. after the 10th repetition of the scan. Before and after acquisition of DCE-MRI, T1 parametric maps were acquired with the same spatial geometry as the DCE scans (VRT with RARE readout, TR = 156, 1842, 2226, 2859, 5000 ms, rare factor = 8, effective TE = 40 ms).
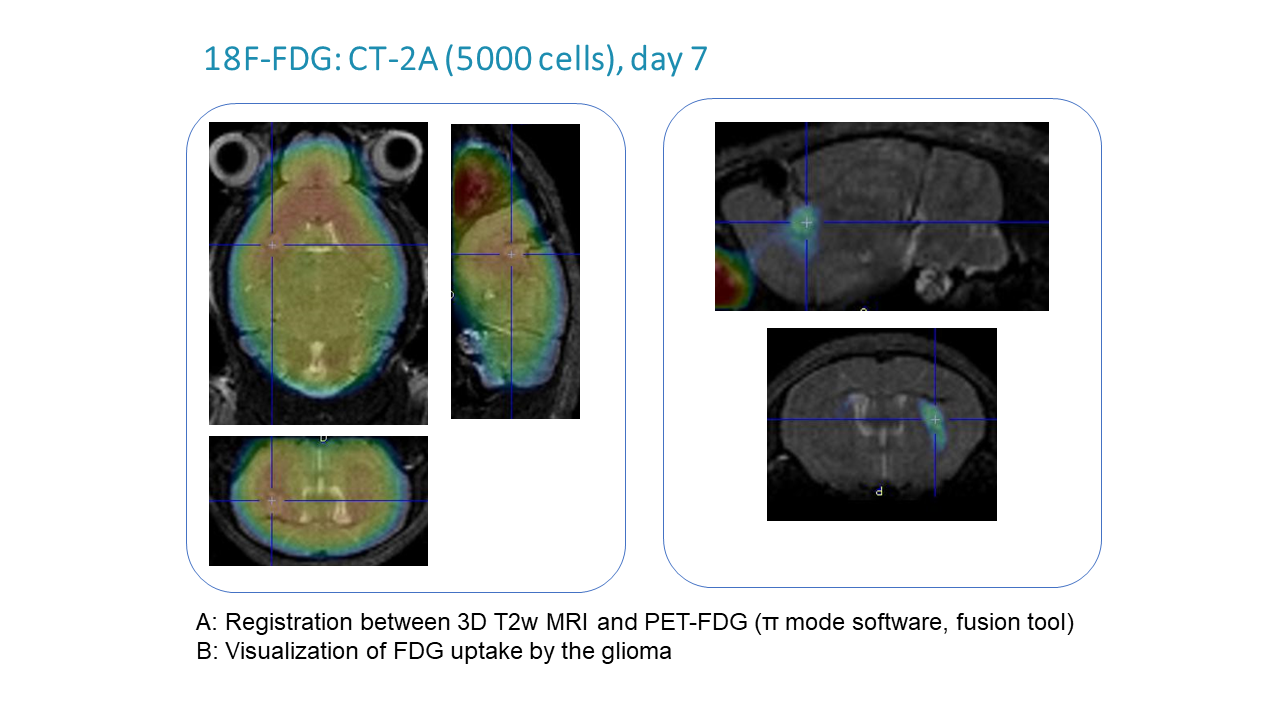
- Simultaneously with MR acquisition, a static PET scan was acquired for a small number of animals after intravenous injection of 72 – 197 µCi 18F-FDG.
RESULTS AND DISCUSSION
Mice harboring NS tumors had a significant shorter survival compared to mice harboring ML tumors (see Figure 1). On T2-weighted MRI, 7 days after tumor cells inoculation a very small tumor was already visible and no significant difference was found between NS and ML tumors. Increased FDG uptake was already noticed at this early time point (see Figure 2). Fourteen and 21 days after tumor cells inoculation, NS tumors were significantly larger than ML tumors (see Figure 1). On MR spectra, no significant differences were found in the major metabolites and metabolite ratios (Figure 3). However, a trend towards increased Cho/NAA, Cho+Cr/NAA and Cho/Cr ratios, also point towards increased malignancy of NS-tumors compared with the ML counterpart. On histology, NS/CT-2A showed an increase in glioma stem cells (Nestin and CD133) and increased vascular proliferation (CD31), which was partially supported by the DCE data (Figure 4).CT-2A NS-derived tumors in mice behaved more aggressively (growths, shorter survival, vascularization) than those derived from CT-2A ML. This was confirmed by longitudinal multimodal/ multiparametric imaging.
CONCLUSIONS
Compared to standard CT-2A ML-derived tumors, NS-derived tumors show increased aggressiveness, immunosuppression and glioma stem cell (GSC) proliferation. Because of these specific features, the CT-2A NS-derived model represents a high-translational platform for the search of new HGG treatments aimed at reducing immunosuppression and eliminating GSCs.Acknowledgements
References
- Ostrom QT, Bauchet L, Davis FG, et al. The epidemiology of glioma in adults: a “state of the science” review. Neuro Oncol. 2014;16(7):896-913
- Martinez-Murillo R, Martinez A. Standardization of an orthotopic mouse brain tumor model following transplantation of CT-2A astrocytoma cells. Histol Histopathol. 2007;22(12):1309-1326.
- Binello E, Qadeer ZA, Kothari HP, et al. Stemness of the CT-2A Immunocompetent Mouse Brain Tumor Model: Characterization In Vitro. J Cancer. 2012;3:166-174.
- Riva R, Wouters R, Weerasekera A, Belderbos S, Nittner D, Thal DR, Baert T, Giovannoni R, Gsell W, Himmelreich U, Van Ranst M, Coosemans A: CT-2A neurosphere-derived high-grade glioma in mice: a new model to address tumor stem cells and immunosuppression. Biology Open 2019, 8: 44552
- Gsell W, Molinos C, Correcher C, Junge S, Heidenreich M, Himmelreich U, Deroose CM, Gonzalez AJ: Characterization of preclinical PET insert for 7T: beyond NEMA testing. Proc ISMRM 2019
- Stefan D, Cesare F Di, Andrasescu A, et al. Quantitation of magnetic resonance spectroscopy signals: The jMRUI software package. Meas Sci Technol. 2009;20(10)
- Naressi A, Couturier C, Devos JM, et al. Java-based graphical user interface for the MRUI quantitation package. MAGMA 2001; 12:141-152
- Poullet J-B, Sima DM, Simonetti AW, et al. An automated quantitation of short echo time MRS spectra in an open source software environment: AQSES. NMR Biomed. 2007;20(5):493-504
Figures
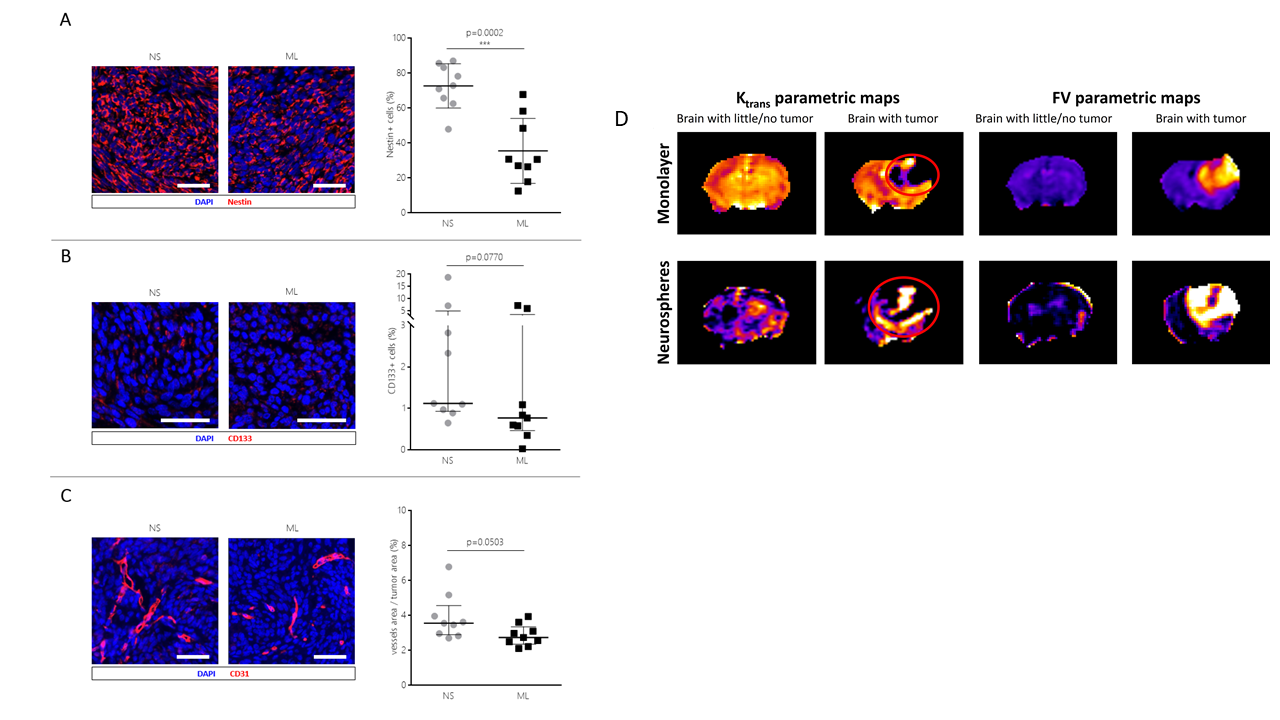
Expression of the Glioma Stem Cell (GSC) markers Nestin [A] and CD133 [B] and of the endothelial marker CD31 [C] in NS/ and ML/CT-2A tumors.
[D] Representative DCE data for the two tumor types.